Harmonic Oscillator - Multi-Component Momentum
Seven-component voting system with composite oscillator and regime detection. Displays vote count (X/7) and regime classification (TRENDING/BIAS/RANGING) based on multi-factor consensus.
New to Technical Analysis? Start Here
What Is Momentum?
Momentum = The speed and strength of price movement in a direction.
- Strong momentum = Prices moving fast in one direction (trend likely to continue)
- Weak momentum = Prices drifting slowly or sideways (trend may be ending)
In Plain English: Harmonic Oscillator combines 7 different momentum measurements into a composite oscillator and gives you ONE clear answer about market conditions. Instead of studying 7 separate indicators, you get one regime classification.
What You'll See on Your Chart:
Status panel showing regime and vote count:
- 📈 TRENDING▲/▼ = Strong directional momentum confirmed by multiple factors
- 📊 BIAS▲/▼ = Moderate directional lean
- ↔️ RANGING = Neutral/sideways conditions
- Vote Count (X/7) = How many components agree on direction
How the "Voting" Works (Simple Version):
Imagine 7 expert analysts looking at your chart. Each one checks different momentum aspects:
- Analyst 1: Checks momentum-aware RSI
- Analyst 2: Checks smoothed stochastic with slope
- Analyst 3: Checks MACD histogram acceleration
- Analyst 4: Checks EMA trend position and slope
- Analyst 5: Checks rate of change momentum
- Analyst 6: Checks confirming volume
- Analyst 7: Checks divergence zones
- Vote count shown as X/7 in status panel
- 5+ votes = High consensus, on the default Balanced mode
- 3-4 votes = Moderate consensus
- 0-2 votes = Low consensus
- Conservative moves the High Consensus line to 6+, Aggressive to 4+
You Don't Need to Know HOW Each Analyst Thinks! Just trust the consensus vote. That's the power of this indicator: it does the complex analysis for you.
🎓 What's an "oscillator"?
An oscillator is a technical tool that bounces between high and low values, like a pendulum swinging back and forth.
Think of it like a speedometer:
- High reading = Momentum is strong (overbought zone)
- Low reading = Momentum is weak (oversold zone)
- Middle reading = Neutral momentum
Oscillators help identify when price moves are "stretched" and due for a rest or reversal.
Start by watching the status panel. Notice regime labels and vote counts, then observe how they change.
🎯 Core Functionality Intermediate
Seven-Component Voting System
Seven independent components analyze market conditions and vote. Vote count displayed as "X/7" in status panel:
7 Voters: RSI | StochRSI | MACD | EMA | Momentum | Volume | Divergence
5+ votes = high consensus · 3-4 votes = moderate · 0-2 votes = low (Balanced mode; Conservative 6+, Aggressive 4+)
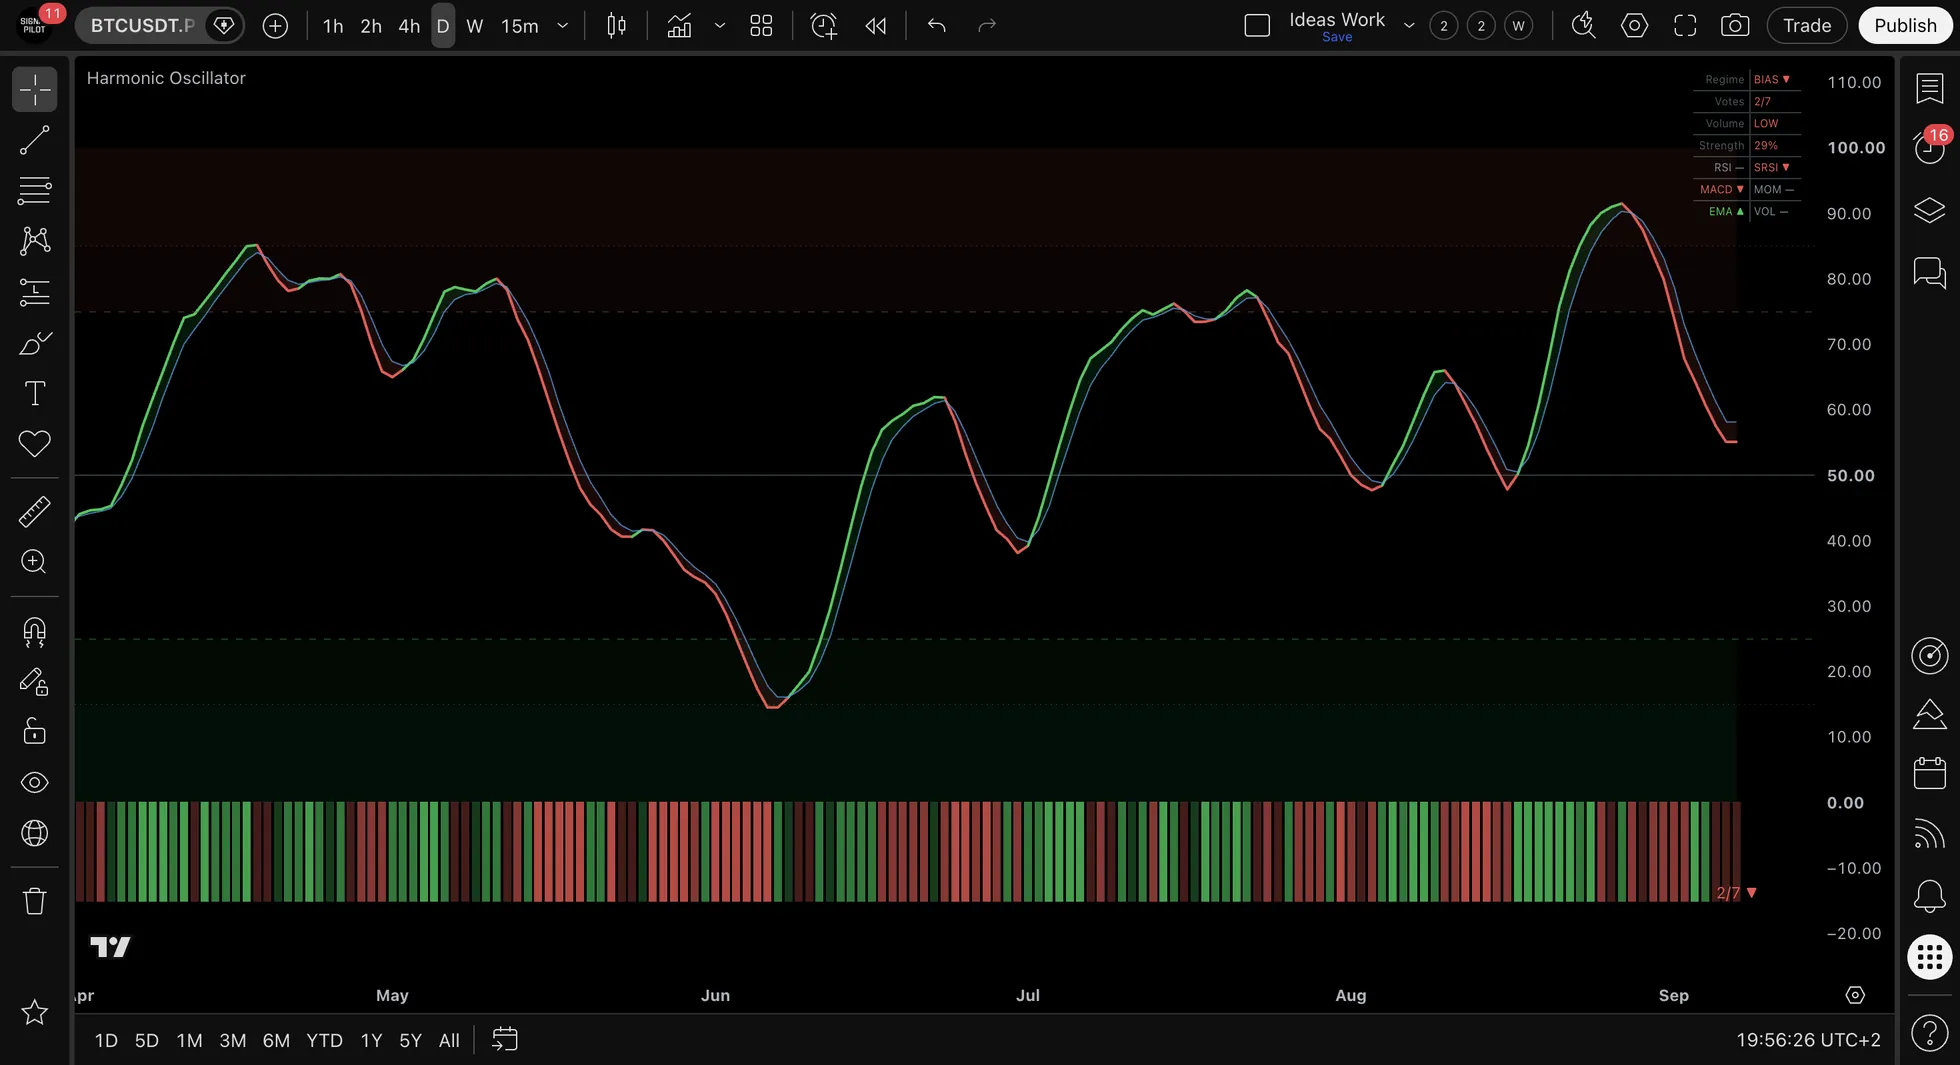
Harmonic Oscillator combines seven momentum components into a unified voting system with composite oscillator output and regime classification.
The Seven Voting Components:
| # | Component | What It Analyzes |
|---|---|---|
| 1 | RSI | Momentum-aware RSI with directional confirmation |
| 2 | Stochastic RSI | Smoothed stochastic with slope analysis |
| 3 | MACD | Histogram acceleration detection (not just direction) |
| 4 | EMA Trend | Price position relative to trend with slope confirmation |
| 5 | Momentum | Rate of change analysis |
| 6 | Volume | Confirming volume on directional candles |
| 7 | Divergence Zone | Extreme zone detection with price confirmation |
Regime Classification: Based on composite oscillator level and multi-factor consensus:
- TRENDING▲/▼: Strong directional momentum confirmed by multiple factors
- BIAS▲/▼: Moderate directional lean
- RANGING: Neutral/sideways conditions
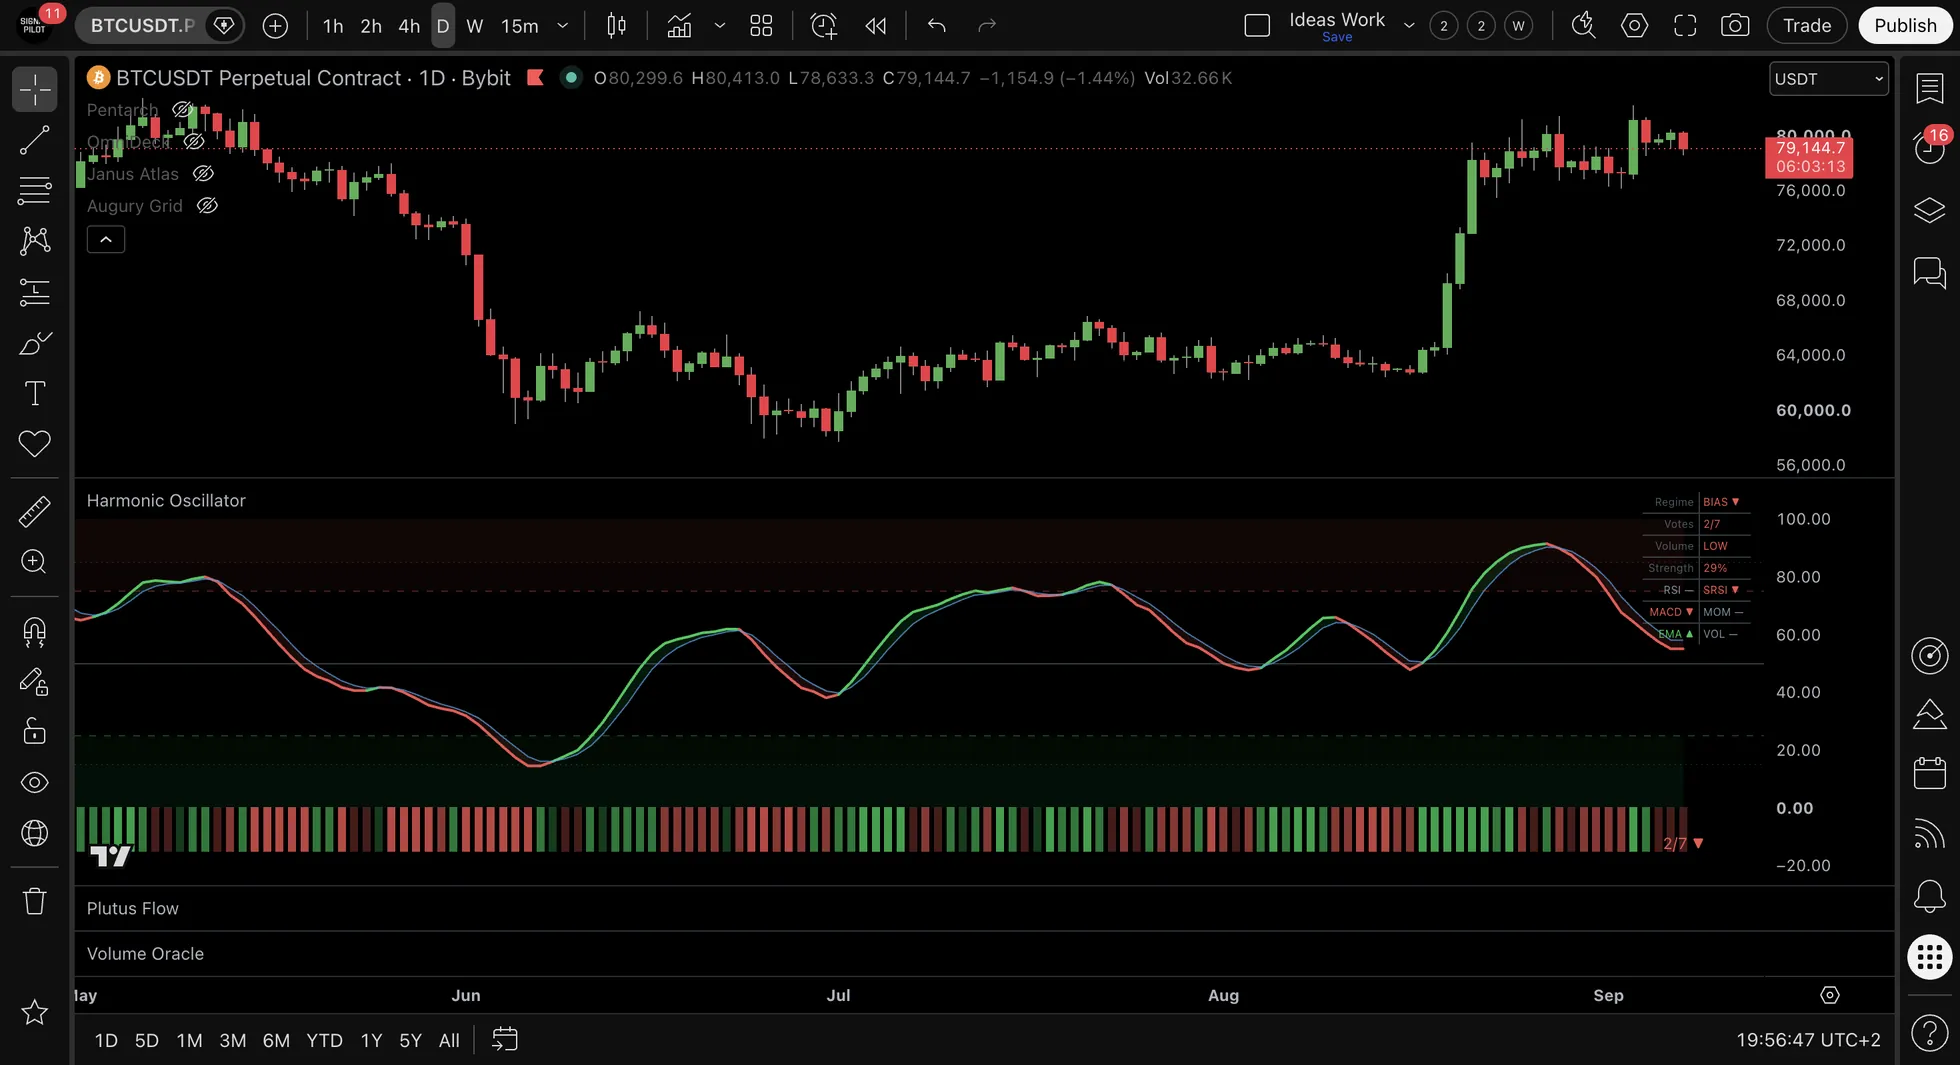
Visual Display: Status panel shows regime + direction arrow, vote count (X/7), and individual component states.
Timeframe Compatibility: Works on all timeframes.
📊 A Worked Example: Reading the Regimes
(An illustration with round numbers, not a record of any real period. Educational only. Not financial advice.)
4-Hour Chart Observation:
| Bar | Price | Votes | Composite | Regime |
|---|---|---|---|---|
| Bar 1 | $60,000 | 5/7 Bull | 62 | BIAS▲ |
| Bar 3 | $61,000 | 7/7 Bull | 78 | TRENDING▲ |
| Bar 8 | $64,000 | 5/7 Bear | 35 | BIAS▼ |
| Bar 11 | $63,000 | 3/7 mixed | 48 | RANGING— |
Pattern Observed: BIAS▲ at $60,000 came before a $4,000 rise to $64,000, where BIAS▼ appeared.
Outcome: a 6.7% move from the bullish regime to the bearish one.
This shows the order the regimes appear in. What anyone does about them varies, and no sequence guarantees any particular outcome.
⚙️ Settings Beginner Friendly
Note: Oscillator parameters are optimized internally and not user-adjustable.
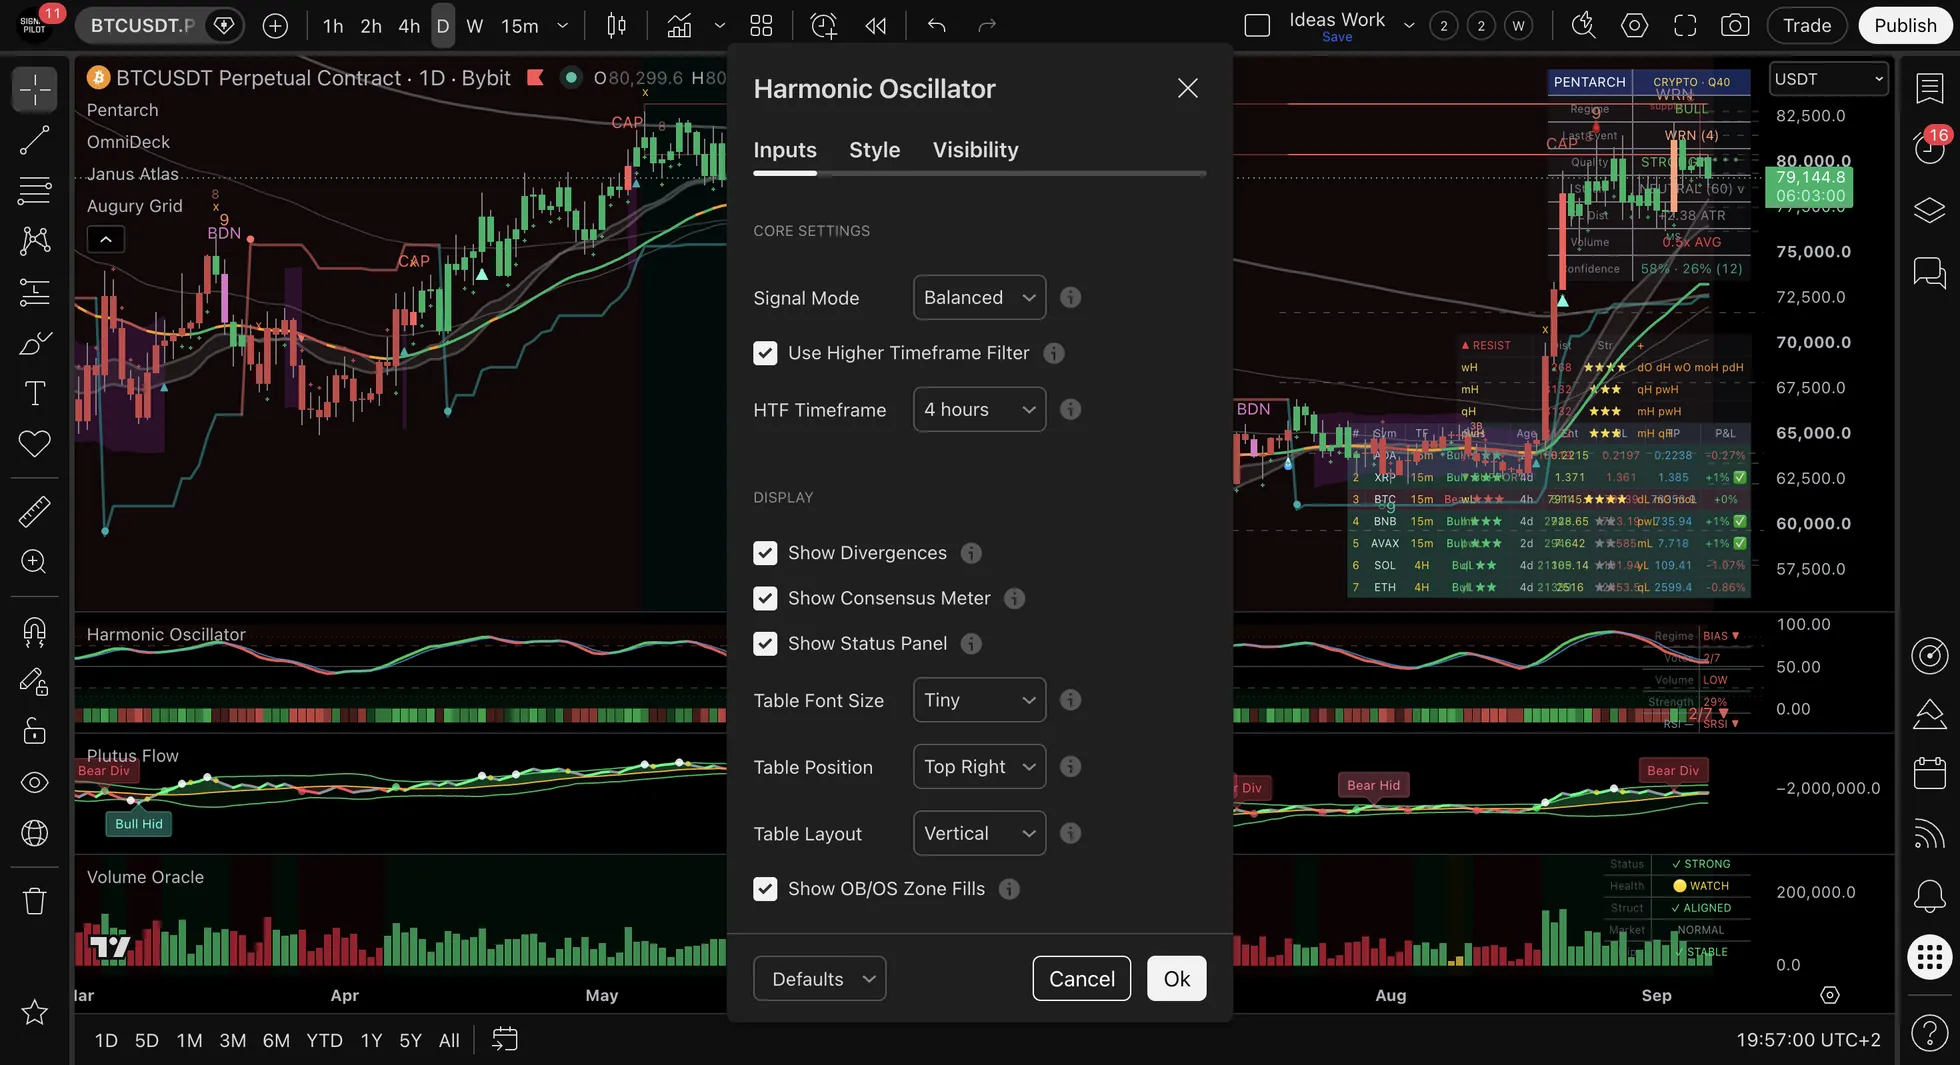
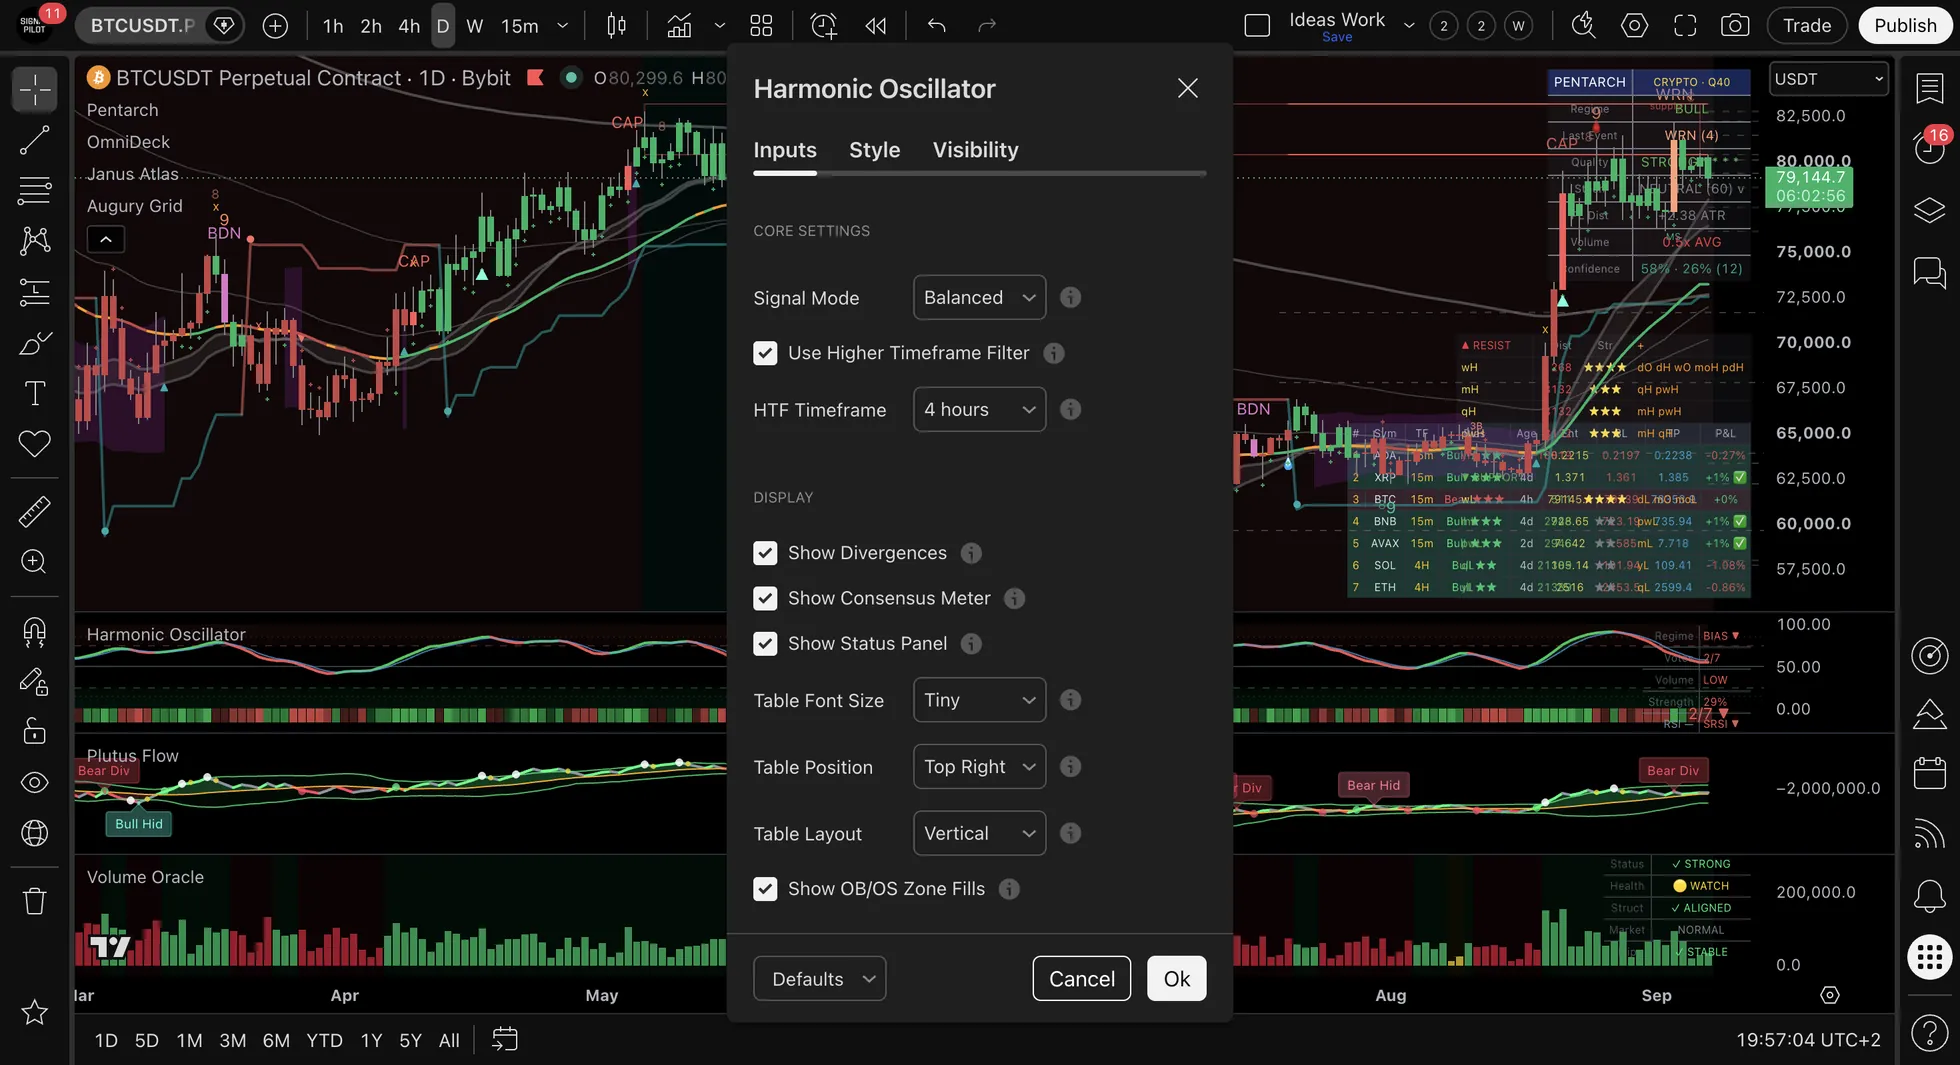
Core Settings
| Setting | Options | Default |
|---|---|---|
| Signal Mode | Conservative / Balanced / Aggressive | Balanced |
| Higher Timeframe Filter | On / Off | On |
| HTF Timeframe | Timeframe selection | 4H |
Signal Mode Explained
Signal Mode controls how many component votes are needed for High Consensus alerts:
| Mode | Votes Required | Best For |
|---|---|---|
| Conservative | 6/7 votes | Fewer alerts, each needing six of the seven components. Multi-day analysis, position analysis. |
| Balanced | 5/7 votes | Default setting. Five of seven, which is the middle of the three thresholds. |
| Aggressive | 4/7 votes | More events, catches more moves. Short-term analysis, intraday analysis. |
What it affects:
- High Bull Consensus alert threshold
- High Bear Consensus alert threshold
Example: In Conservative mode, you only receive a "High Bull Consensus" alert when 6 or 7 components vote bullish. In Aggressive mode, 4 bullish votes triggers the alert.
Higher Timeframe Filter Explained
When enabled, divergence signals are filtered by the higher timeframe trend direction:
| HTF Trend | Bullish Divergence | Bearish Divergence |
|---|---|---|
| HTF Bullish (price > HTF EMA50) | ✅ Shown | ❌ Filtered |
| HTF Bearish (price < HTF EMA50) | ❌ Filtered | ✅ Shown |
| Filter Disabled | ✅ Shown | ✅ Shown |
Why use it: Filters out counter-trend divergence events. If the 4H trend is bullish, you won't see bearish divergences that fight the larger trend. This reduces noise and focuses analysis on trend-aligned events.
When to disable: If you specifically want to catch trend reversals, or if you trade very short timeframes where HTF context matters less.
Display Settings
| Setting | Options | Default |
|---|---|---|
| Show Divergences | On / Off | On |
| Show Consensus Meter | On / Off | On |
| Show Status Panel | On / Off | On |
| Show OB/OS Zone Fills | On / Off | On |
Table Settings
| Setting | Options | Default |
|---|---|---|
| Table Position | 9 options (Top Left through Bottom Right) | Top Right |
| Table Font Size | Tiny / Small / Normal | Small |
| Table Layout | Horizontal / Vertical | Vertical |
🔢 Regime Classification
Harmonic Oscillator classifies market conditions into three regimes based on the composite oscillator level combined with baseline trend confirmation:
| Regime | Composite Level | Additional Condition |
|---|---|---|
| TRENDING▲ | Above 65 | 200 EMA rising |
| TRENDING▼ | Below 35 | 200 EMA falling |
| BIAS▲ | Above 55 | — |
| BIAS▼ | Below 45 | — |
| RANGING | Between 45-55 | — |
Important: Regime classification uses the composite oscillator value, not a direct vote count. However, high vote counts typically push the composite to extreme levels, so there's strong correlation between vote consensus and regime.
The relationship:
- High consensus (6-7 votes) → Composite at extremes → Usually TRENDING
- Moderate consensus (4-5 votes) → Composite showing lean → Usually BIAS
- Low consensus (0-3 votes) → Composite near neutral → Usually RANGING
📈 TRENDING Regime
Status Panel Display: "TRENDING▲" (bullish) or "TRENDING▼" (bearish)
Interpretation: Clear trending conditions with the composite oscillator at an extreme and the EMA agreeing.
📊 BIAS Regime
Status Panel Display: "BIAS▲" (bullish lean) or "BIAS▼" (bearish lean)
Interpretation: Directional lean without full trend confirmation. Early trend or weakening trend.
↔️ RANGING Regime
Status Panel Display: "RANGING—"
Interpretation: Choppy or consolidating conditions. Composite oscillator in neutral zone.
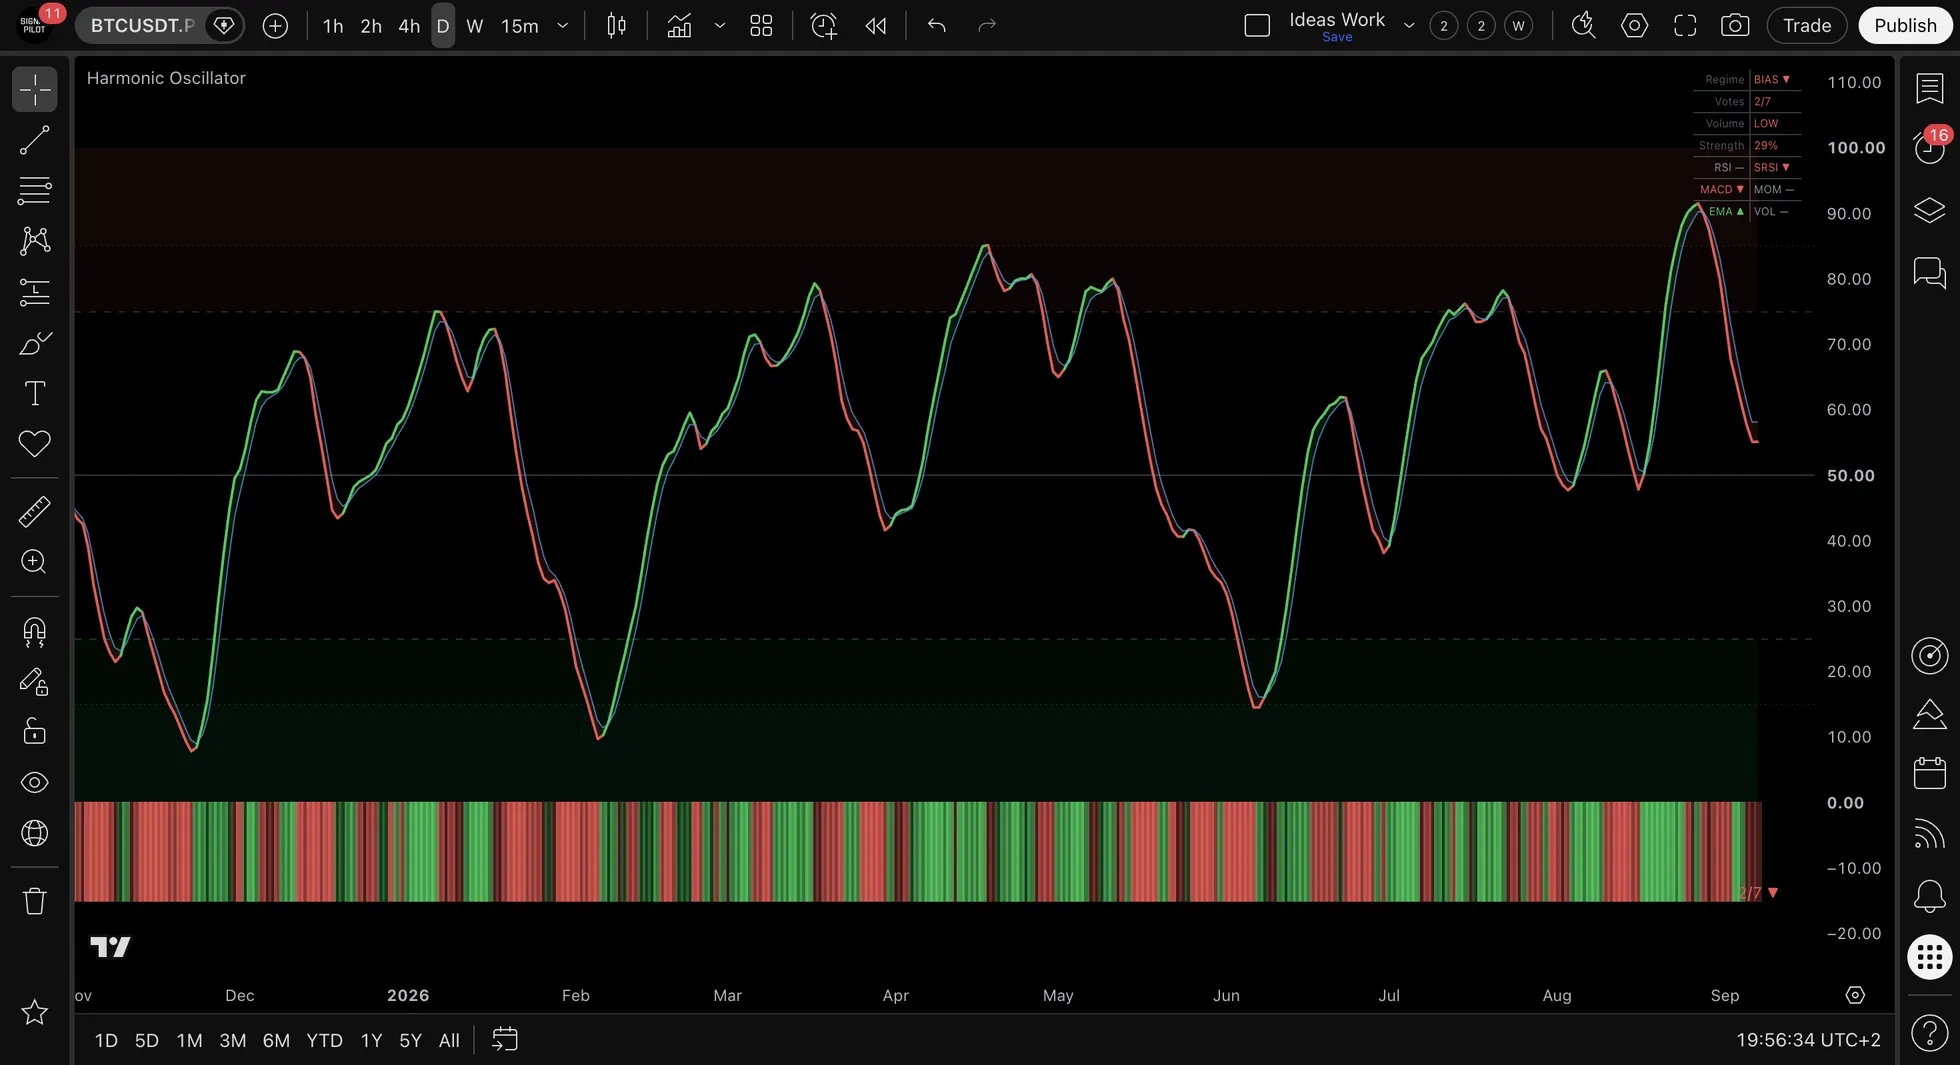
📊 Composite Oscillator
The composite oscillator blends multiple momentum measurements into a single normalized line using proprietary statistical methods. This creates a smoother, more reliable momentum reading than any single oscillator.
Visual Elements
| Element | Description |
|---|---|
| Composite Line | Main oscillator line (0-100 scale) |
| Signal Line | Smoothed reference for crossovers |
| Color | Green when bullish, red when bearish |
| Zone Fills | Overbought and oversold regions highlighted |
| Consensus Meter | Bar showing vote count visually |
| Divergence Labels | "▲ DIV" / "▼ DIV" when detected |
Status Panel
The status panel displays:
- Regime + direction (TRENDING▲, BIAS▼, RANGING—)
- Vote count (X/7)
- Individual component states
📚 Understanding the Voting System Intermediate
Data → [RSI, StochRSI, MACD, EMA, Momentum, Volume, Divergence] → Vote Count → Composite → Regime
■ 5+ votes = high consensus · ■ 3-4 votes = moderate · ■ 0-2 votes = low (Balanced mode; Conservative 6+, Aggressive 4+)
The Seven Components
| # | Component | What It Measures |
|---|---|---|
| 1 | RSI | Momentum-aware RSI with directional confirmation |
| 2 | Stochastic RSI | Smoothed stochastic with slope analysis |
| 3 | MACD | Histogram acceleration (not just direction) |
| 4 | EMA Trend | Price position relative to trend with slope confirmation |
| 5 | Momentum | Rate of change analysis |
| 6 | Volume | Confirming volume on directional candles |
| 7 | Divergence Zone | Extreme zone detection with price confirmation |
Consensus Levels
Consensus thresholds vary based on your Signal Mode setting:
| Consensus Level | Conservative | Balanced | Aggressive |
|---|---|---|---|
| High Consensus | 6+ votes | 5+ votes | 4+ votes |
| Moderate Consensus | 4-5 votes | 3-4 votes | 2-3 votes |
| Low Consensus | 0-3 votes | 0-2 votes | 0-1 votes |
High Consensus triggers the "High Bull Consensus" and "High Bear Consensus" alerts. The threshold adapts to your chosen Signal Mode.
Default (Balanced): 5+ of 7 components voting the same direction = High Consensus alert fires.
📖 A Worked Example: A Full Regime Sequence
(An illustration with round numbers, not a record of any real period. Educational only. Not financial advice.)
15-Minute Chart - Full Regime Sequence:
| Bar | Price | Votes | Composite | Regime |
|---|---|---|---|---|
| Bar 1 | 4,700 | 4/7 Bull | 58 | BIAS▲ |
| Bar 6 | 4,715 | 6/7 Bull | 72 | TRENDING▲ |
| Bar 12 | 4,735 | 5/7 Bear | 38 | BIAS▼ |
| Bar 18 | 4,725 | 3/7 Bear | 45 | RANGING— |
| Bar 24 | 4,720 | 7/7 Bear | 22 | TRENDING▼ |
Sequence Analysis:
-
BIAS▲ at 4,700: Four components agreed bullish. A moderate bullish lean.
-
TRENDING▲ at 4,715: Six components aligned bullish. Strong consensus, 15 points above the BIAS▲ bar.
-
BIAS▼ at 4,735: The components shifted bearish, 35 points above the first BIAS bar and 20 above the TRENDING bar.
-
RANGING at 4,725: The components diverged, with no clear consensus. A transitional stretch.
-
TRENDING▼ at 4,720: All seven components aligned bearish. Strong downside momentum confirmed.
Total Move: +35 points from BIAS▲ to BIAS▼ regime.
This shows one complete pass through the regimes. Individual interpretation and outcomes vary.
🎯 Regime Interpretation Patterns
Pattern 1: BIAS → TRENDING Progression
Sequence: BIAS regime followed by TRENDING regime in same direction
Interpretation: Momentum strengthening, more components joining consensus
Example: 4 components bullish (BIAS▲) → 6 components bullish (TRENDING▲) = Momentum acceleration pattern
Pattern 2: Direct TRENDING Regime
Sequence: TRENDING regime appears without preceding BIAS
Interpretation: Rapid multi-component alignment, with the components agreeing within a bar or two
Example: RANGING conditions → All components suddenly align → TRENDING regime = Swift momentum shift pattern
Pattern 3: BIAS → RANGING Transition
Sequence: Directional regime followed by RANGING
Interpretation: Consensus breaking down, momentum diverging
Example: BIAS▼ → RANGING (components diverge) = Momentum loss or consolidation pattern
Pattern 4: RANGING → BIAS Emergence
Sequence: RANGING regime followed by directional regime
Interpretation: Consensus forming after period of disagreement
Example: RANGING (choppy) → BIAS▲ (4+ bullish) = Direction emerging from neutral conditions
Pattern 5: Regime Clusters
Sequence: Multiple regime changes in short time period
Interpretation: High volatility, components responding to rapid price changes
Example: BIAS▲ → BIAS▼ → BIAS▲ within 1 hour = Choppy volatile conditions, whipsaw characteristics
🔔 Alert Configuration
14 Available Alerts:
Divergence Alerts
| Alert | Trigger | Use Case |
|---|---|---|
| Bullish Divergence | Bullish divergence detected on composite oscillator | Potential reversal from oversold conditions |
| Bearish Divergence | Bearish divergence detected on composite oscillator | Potential reversal from overbought conditions |
| Any Divergence | Either bullish or bearish divergence detected | Universal divergence scanner |
Crossover Alerts
| Alert | Trigger | Use Case |
|---|---|---|
| Bullish Crossover | Composite oscillator crosses above signal line | Momentum shifting bullish |
| Bearish Crossover | Composite oscillator crosses below signal line | Momentum shifting bearish |
| Any Crossover | Either bullish or bearish crossover detected | Universal crossover scanner |
Extreme Zone Alerts
| Alert | Trigger | Use Case |
|---|---|---|
| Extreme Overbought | Composite oscillator enters overbought zone | Caution for extended moves, potential reversal setup |
| Extreme Oversold | Composite oscillator enters oversold zone | Caution for extended moves, potential bounce setup |
| Exit Overbought | Composite oscillator exits overbought zone | Bearish momentum confirmation |
| Exit Oversold | Composite oscillator exits oversold zone | Bullish momentum confirmation |
Regime Change Alerts
| Alert | Trigger | Use Case |
|---|---|---|
| Regime to Bullish | Regime classification changes to bullish (TRENDING▲ or BIAS▲) | Market structure shifting bullish |
| Regime to Bearish | Regime classification changes to bearish (TRENDING▼ or BIAS▼) | Market structure shifting bearish |
Consensus Alerts
| Alert | Trigger | Use Case |
|---|---|---|
| High Bull Consensus | Vote count reaches Signal Mode threshold (Conservative: 6+, Balanced: 5+, Aggressive: 4+) | Strong bullish agreement across multiple factors |
| High Bear Consensus | Vote count reaches Signal Mode threshold (Conservative: 6+, Balanced: 5+, Aggressive: 4+) | Strong bearish agreement across multiple factors |
Alert Setup:
- Open indicator settings
- Navigate to Alerts section
- Enable desired alerts
- Set TradingView alert on the indicator
- Configure notification method (popup, email, webhook, app)
🔗 Integration with Other Indicators
While Harmonic Oscillator reports momentum consensus on its own, reading it alongside the other Signal Pilot indicators gives a reading more than one source. Here is how they are commonly read together:
Harmonic Oscillator + Pentarch (Momentum + Timing)
Workflow:
- Check Harmonic Oscillator state → Identify current regime (TRENDING, BIAS, or RANGING) and vote count
- Wait for an aligned event from Pentarch → Bullish regime + TD/IGN event = accumulation phase confluence. Bearish regime + CAP/WRN event = distribution phase confluence
- High consensus + Pentarch = the broadest agreement the pair can show → 6/7 or 7/7 component agreement + timing event = strong confluence setup
- Expected outcome: Momentum consensus + precise timing = strong confluence detection
Example: Harmonic Oscillator shows TRENDING▲ (6/7) → Pentarch IGN event fires = maximum accumulation phase confluence
Harmonic Oscillator + Janus Atlas (Momentum at Levels)
Workflow:
- Price approaches a key level drawn by Janus Atlas → Daily Low, Weekly support, or major Fibonacci level
- Check Harmonic Oscillator for regime shift → Look for transition from bearish → RANGING → bullish regime as price nears support
- Momentum shift at level = reversal confirmation → Oscillator confirming support level with momentum change
- Expected outcome: A structural level and a momentum shift on the same bar: two instruments describing one condition
Example: Price hits Daily Low + Weekly Low confluence → Harmonic Oscillator shifts from BIAS▼ to BIAS▲ = momentum-confirmed support bounce
Harmonic Oscillator + Volume Oracle (Momentum + Regime)
Workflow:
- Harmonic Oscillator shows high consensus → 5+ components voting same direction (TRENDING regime)
- Look for an aligned regime in Volume Oracle → Is the regime supporting the momentum direction?
- TRENDING + aligned regime = volume participation → Bullish TRENDING + Accumulation regime = volume-confirmed momentum
- Conflicting regime with TRENDING signal = caution → Momentum may lack follow-through without volume support
- Expected outcome: Volume Oracle regime validates which momentum signals have volume support
Example: Harmonic shows TRENDING▲ (6/7) → Volume Oracle shows Accumulation regime (green, 80%) = confirmed buying momentum with accumulation
Harmonic Oscillator + OmniDeck (Momentum + Regime)
Workflow:
- Start with the Regime Box in OmniDeck → Establish overall trend context (bullish, bearish, or neutral regime)
- Align Harmonic regime with OmniDeck → Bullish Harmonic regime in bullish OmniDeck regime = trend continuation. Bearish Harmonic in bullish OmniDeck = potential pullback or reversal warning
- Conflicting signals = early warning → OmniDeck bullish + Harmonic turning bearish regime = possible trend exhaustion
- Expected outcome: Harmonic Oscillator identifies momentum shifts WITHIN the broader regime context
Example: OmniDeck bullish regime + Pilot Line rising → Harmonic TRENDING▲ = fully aligned bullish confluence. OmniDeck bullish + Harmonic BIAS▼ = early weakness warning, monitor closely
Pro Tip: The Momentum Confirmation Workflow
To read three instruments on one bar, combine Harmonic Oscillator (momentum) + Pentarch (timing) + Janus Atlas (levels) + Volume Oracle (regime confirmation). Wait for a Harmonic TRENDING regime at a key level drawn by Janus Atlas, then for a timing signal from Pentarch, with an aligned regime confirming volume support. This multi-layer confluence filters for only the strongest opportunities.
See also: Analysis Workflow Guide for detailed multi-indicator approaches.
⚠️ Common Mistakes to Avoid
These mistakes are frequently made by new Harmonic Oscillator users. Avoid them to improve your results:
Mistake #1: Ignoring RANGING Signals (Forcing Analysis)
The Problem: RANGING— events indicate component disagreement or neutral momentum. Acting during RANGING periods forces conclusions when the market lacks directional conviction, leading to false expectations.
The Fix:
- RANGING = wait for clarity → Wait for BIAS or TRENDING regime to emerge before drawing conclusions
- RANGING periods often occur during consolidation, choppy ranges, or low-volume conditions
- Use RANGING as a filter: Don't force conclusions when components can't agree on direction
- Patience during RANGING preserves focus for high-confluence BIAS/TRENDING setups
Remember: RANGING is valuable information: it tells you to wait. The best analysis knows when to be patient.
Mistake #2: Treating TRENDING as Automatic Reversal Signal
The Problem: TRENDING signals (6/7 or 7/7 consensus) show extreme momentum, not guaranteed reversals. Beginners assume TRENDING = "overbought/oversold, must reverse," but strong momentum can persist.
The Fix:
- TRENDING signals show maximum directional agreement, which can continue trending OR signal exhaustion
- Wait for price confirmation: a reversal candle, a support or resistance level, or a signal from Pentarch
- TRENDING in trending market = continuation strength (don't fade it)
- TRENDING at a key level, a volume spike, and a signal from Pentarch together are three sources describing one condition
Remember: TRENDING means "strong momentum," not "imminent reversal." Combine with other confirmation before counter-trending.
Mistake #3: Using Harmonic Oscillator in Isolation
The Problem: Using oscillator events without checking levels, volume, or broader trend context leads to incomplete analysis and missed context clues.
The Fix:
- Always combine with Janus Atlas: Bullish regime at support level > Bullish regime at resistance
- Take the timing from Pentarch: bullish regime + TD/IGN event = precise timing confluence
- Confirmation comes from Volume Oracle: momentum shifts backed by volume have higher follow-through
- The Regime Box in OmniDeck gives the trend context: a bullish Harmonic regime inside a bullish OmniDeck regime is the strongest confluence
Remember: Harmonic Oscillator is a powerful filter, but it's not a complete analysis system. Layer it with levels, timing, and volume.
Mistake #4: Overreacting to Every Regime Transition
The Problem: Not all regime transitions carry the same amount of agreement behind them. The regime label comes off the composite oscillator, so a BIAS and a TRENDING bar can carry the same vote count. The panel prints both numbers for that reason.
The Fix:
- Read the regime label and the vote count as two separate readings, not one
- A 4 of 7 count is a thin majority, whatever label sits beside it
- A 6 of 7 or 7 of 7 count is the components at their most aligned, which can accompany any of the three labels
- Note where the two disagree: a TRENDING label on a 4 of 7 count is a composite extreme the components have not caught up with
Remember: The composite level sets the label and the vote count records the agreement. They correlate, but neither is the other.
Mistake #5: Not Using the Status Panel for Context
The Problem: Relying only on the regime label without checking the composite oscillator and vote count. The status panel shows detailed context: valuable for signal strength assessment.
The Fix:
- Enable the status panel view to see vote count, regime, oscillator value, and signal line
- Check vote distribution: 7/7 (TRENDING) vs. 4/7 (BIAS) shows different conviction levels
- Watch composite oscillator crossovers and divergences for early momentum shifts
- Panel helps identify regime changes before they fully develop
Remember: The panel provides transparency into the voting system. Use it to understand signal quality and anticipate changes.
Mistake #6: Using Wrong Timeframe for Analysis Style
The Problem: Harmonic Oscillator on 5-minute charts produces frequent Bull/Bear changes = noise and overreaction. Higher timeframes provide cleaner, more reliable events.
The Fix:
- Intraday analysis: Use 15-minute or 1-hour minimum for cleaner events
- Multi-day analysis: Use 4-hour or Daily, where each component reads longer bars
- Position analysis: Use Daily or Weekly for long-term momentum trends
- Lower timeframes carry more noise per bar. Higher timeframes print fewer events, each computed on steadier inputs
Remember: The seven components use fixed lookbacks, so on a 1-minute chart they read one minute of price per bar. The same lookback on a Daily chart reads a day. Start with 1-hour or Daily to see what the components respond to.
Additional Resources
For more best practices, see Best Practices & Pro Tips. For momentum analysis workflows, see Analysis Workflow Guide.
🌫️ When This Doesn't Work Well
Harmonic Oscillator signals show reduced reliability in certain market conditions. Recognizing these environments helps set appropriate expectations:
Choppy, Sideways, Ranging Markets
The Condition: When price oscillates in a horizontal range with no clear directional trend, the seven components produce conflicting votes as momentum shifts back and forth every few bars.
What Happens: RANGING— regime dominates the chart. When BIAS or TRENDING regimes do appear, they flip quickly (BIAS▲ → RANGING → BIAS▼ → RANGING) within 5-10 bars. Signal frequency increases but reliability decreases. Following these signals leads to whipsaws, entering long on bullish regime, getting stopped out, then seeing bearish regime that also fails.
Context: Components measure momentum and rate of change. In sideways markets, there IS momentum (price moves up and down), but it's non-directional: momentum shifts from bullish to bearish repeatedly without follow-through. This isn't a failure: Harmonic is correctly identifying that momentum keeps shifting. The constant RANGING and rapid flips are the indicator telling you "this market lacks directional conviction, wait for clarity." Combine with the regime bars in Pentarch or the Regime Box in OmniDeck: if those show neutral or gray at the same time, skip trades until trend clarity emerges.
Very Low Timeframes (5-Minute, 1-Minute)
The Condition: Using Harmonic Oscillator on 1m or 5m charts, especially in crypto or highly volatile stocks.
What Happens: Regime changes happen every 2-4 bars. BIAS▲ → BIAS▼ → RANGING → BIAS▲ in a 20-minute span. Components react to microstructure noise (spoofing, HFT activity, bid-ask spreads) rather than meaningful momentum shifts. Impossible to trade effectively: by the time you enter on bullish regime, it's already flipping to RANGING.
Context: Components use various lookback periods for their calculations. On 1m charts, short lookback periods mean any price spike dramatically shifts component votes, causing premature regime changes. On 1H charts, the same lookback produces much more stable readings, less susceptible to single-candle noise. The floors this page uses elsewhere hold here too: 15m or 1H for intraday work, 4H or Daily for multi-day, Daily or Weekly for position work. Lower timeframes run fine technically; they simply produce more events than they produce information.
Regime Transitions & Trend Changes
The Condition: During the actual moment when trends reverse, transitioning from established bull trend to new bear trend (or vice versa).
What Happens: Components whipsaw during the transition. Example: Strong uptrend (Harmonic shows TRENDING▲) → Market tops → Harmonic flips to RANGING → Then BIAS▼ → Then RANGING again → Finally settles on TRENDING▼. During this 10-20 bar transition the regime reading is unstable. A first bearish print can flip back to RANGING on the next bar, then settle bearish several bars later. That is the reading changing while the market is still deciding, and it is visible as it happens rather than only afterwards.
Context: Harmonic Oscillator excels at confirming established trends (TRENDING regimes during clear directional moves). It struggles during the messy, ambiguous transition periods between trends. This is inherent to how the voting system works: components need several bars of new data to "confirm" the new trend. Early regimes during transitions are provisional and frequently reverse. Best practice: Wait for 2-3 consecutive same-direction regimes after a transition before trusting the new direction. Or take the timing of the actual reversal from the TD and IGN signals in Pentarch, then use Harmonic to confirm the trend.
Strong Persistent Trends (Overbought/Oversold Conditions)
The Condition: During parabolic moves or persistent one-directional trends, oscillators reach extreme readings (RSI 80+, Stochastic 90+) and stay there for weeks.
What Happens: Harmonic might flip from TRENDING▲ to just BIAS▲ or even RANGING as component readings max out, despite price continuing to rally. This can create premature "momentum weakening" signals that lead to exiting winning positions too early. Conversely, bearish regimes may appear during strong uptrends when components dip briefly, but price never actually reverses.
Context: Components measuring momentum can hit extreme readings, but "overbought can stay overbought" during extraordinary trends. When components hit extremes, they can't go much higher even if buying pressure continues. Some components will vote neutral or even bearish while price keeps rising. This is why Harmonic uses a voting system: it softens single-component extremes, but even the consensus can weaken during persistent trends. In strong trending markets, an oscillator ranks below the trend-following reads: the Pilot Line in OmniDeck and the regime bars in Pentarch carry more weight here. Use Harmonic for entry timing within the trend (buy dips on bullish regimes during uptrends), not for trend reversal calls.
Sudden Gaps & News-Driven Moves
The Condition: Price gaps 5-10% overnight due to earnings, news, or global events. Or intraday flash moves where price jumps 3-5% in one candle.
What Happens: Components lag behind the move. Example: Price gaps down 8% on earnings miss, immediately oversold. Harmonic might still show BIAS▲ or RANGING from yesterday's data because components use lookback periods that include pre-gap bars. By the time Harmonic flips to BIAS▼ (3-5 bars later), the worst of the move is over and price is already consolidating or bouncing.
Context: All momentum components are lagging indicators: they calculate based on recent history. Gaps and flash moves create discontinuities where yesterday's data becomes instantly obsolete. Harmonic will eventually catch up (usually within 5-10 bars), but initial regimes immediately after major gaps are unreliable because they're based on pre-gap momentum that no longer exists. After significant gaps or flash moves, wait 10-15 bars for components to "digest" the new price level before trusting Harmonic regimes. Or use non-lagging indicators like Janus Atlas levels (which update in real-time) immediately post-gap.
Low Volatility Consolidation Periods
The Condition: Price trades in an extremely tight range (1-2% range over multiple days/weeks) with minimal volatility. Common during summer doldrums, holidays, or post-earnings consolidation.
What Happens: Components become hypersensitive to tiny moves. A 0.5% price increase in a 1% range generates bullish regimes despite the move being statistically insignificant. Harmonic fires regime changes on noise rather than meaningful momentum. Signal frequency might appear high, but no regimes lead to substantial follow-through.
Context: Components measure rate of change and momentum relative to recent price action. In low-volatility environments, even small moves represent large percentage changes from the narrow baseline. A 0.3% move becomes "significant momentum" when the last 10 bars only moved 0.1-0.2% each. These regimes are technically valid but practically useless: they identify relative momentum shifts within a stagnant market. Combine with Volume Oracle: if volume is below average and Harmonic is firing regime changes, you're likely in a low-volatility trap. Wait for volume expansion and price breakout from consolidation before trusting momentum signals.
Recognizing Reduced Reliability Environments
Practical Identification:
- RANGING appearing 40%+ of the time: Market lacks directional momentum: reduce activity
- Regimes flipping every 3-5 bars: Timeframe too low or choppy conditions: use higher timeframe
- BIAS▲ → RANGING → BIAS▼ → RANGING pattern within 10 bars: Market transition: wait for stabilization
- TRENDING regime but price barely moving: Low volatility environment: wait for expansion
- Price continues trending but Harmonic weakens from TRENDING to BIAS: Components at extremes: use trend indicators instead
- Major gap or flash move just occurred: Wait 10+ bars for components to recalibrate
- Regime Box/Pentarch shows neutral while Harmonic shows BIAS/TRENDING: Conflicting indicators: skip trade
Remember: Harmonic Oscillator measures momentum consensus across seven components. It tells you WHAT momentum currently exists, not WHETHER that momentum is sustainable or tradeable. Best results occur during trending markets with clear directional bias, on appropriate timeframes (15m+), after regimes have established. During transitions, ranges, and extremes, components struggle: that's when you confirm the reading against the cycle position in Pentarch, the trend read in OmniDeck, and the structural levels in Janus Atlas before acting on it.
❓ Frequently Asked Questions
Q: Why use seven components instead of one?
A: Multiple components provide consensus view. Single indicator may give false signal while others disagree. Multi-component agreement reduces single-indicator noise and increases reliability.
Q: Can I disable specific components?
A: No. All seven components contribute to the voting system. The system is designed to work as an integrated whole.
Q: What causes the RANGING regime?
A: Components showing divergent readings: some bullish, some bearish, some neutral. No directional consensus present. Occurs during choppy markets, consolidation, or transitional periods.
Q: How does this differ from looking at seven separate indicators?
A: Harmonic Oscillator automates agreement analysis and includes the proprietary composite oscillator. Manual monitoring of seven indicators requires mental calculation of consensus. This indicator performs vote counting automatically, generates regime classification, and provides crossover/divergence detection.
Q: Can signals repaint?
A: No. All signals and regime changes confirm at bar close and do not change retroactively.
Q: What is the composite oscillator?
A: A 0 to 100 line built from three of the seven components, not from the votes. RSI, Stochastic RSI and the MACD histogram are each normalised against their own last 200 bars with outliers clipped, averaged, then smoothed. A second, shorter smoothing of that line is the signal line the crossover alerts use. The other four components still vote and still show in the panel; they just do not enter the line. Overbought sits at 75 and oversold at 25, with the extreme bands at 85 and 15.
Q: What separates TRENDING from BIAS?
A: The threshold on the composite. TRENDING needs the composite past 65 with the 200 EMA rising, or under 35 with it falling. BIAS needs only past 55 or under 45, and does not consult the 200 EMA. So TRENDING is the narrower of the two readings, and it carries a directional filter that BIAS does not.
Q: Can I see the composite oscillator?
A: Yes. The composite line and its signal line are the oscillator panel itself. Turn on Show OB/OS Zone Fills to shade the extreme zones, and Show Consensus Meter to see the vote count as a bar beside them.
Q: What do the vote counts (X/7) mean?
A: The vote count shows how many of the seven components agree on direction. Higher counts (6/7, 7/7) indicate stronger consensus and typically correlate with TRENDING regimes. The actual regime classification is determined by the composite oscillator level, but vote count and regime are strongly correlated. High Consensus alerts use the vote count directly, with thresholds set by your Signal Mode (Conservative: 6+, Balanced: 5+, Aggressive: 4+).
Q: What does Signal Mode actually change?
A: Signal Mode adjusts the threshold for High Consensus alerts. Conservative requires 6/7 votes, Balanced 5/7 (the default) and Aggressive 4/7. Nothing else changes: the threshold gates the two High Consensus alerts only, and no visual on the chart moves with it. Choose based on your analysis approach: Conservative for multi-day analysis, Aggressive for short-term/intraday analysis.
Q: What does the HTF Filter do?
A: When enabled, divergence signals are filtered by the higher timeframe trend. Bullish divergences only appear when that trend is bullish, meaning price is above the EMA50 of the higher timeframe, 4H unless you change it; bearish divergences only appear when it is bearish. This helps you avoid counter-trend signals. Disable it if you want to catch potential trend reversals.
Q: How many regime changes appear on average?
A: Regime frequency varies by asset, timeframe, and market conditions. Volatile periods show more regime changes. Strong trending periods show stable regimes with fewer changes.
✅ Knowledge Check
Question: What decides which regime Harmonic Oscillator prints in the status panel?
📋 Quick Reference Guide
Regime Summary
| Regime | Label | Composite Level | Typical Vote Count |
|---|---|---|---|
| TRENDING▲ | Green | >65 + EMA rising | Usually 6-7 bullish |
| TRENDING▼ | Red | <35 + EMA falling | Usually 6-7 bearish |
| BIAS▲ | Light green | >55 | Usually 4-5 bullish |
| BIAS▼ | Light red | <45 | Usually 4-5 bearish |
| RANGING— | Gray | 45-55 | Usually 0-3 either |
Note: Regime is determined by composite oscillator level, not directly by vote count. The correlation is strong but not absolute.
Component Quick Reference
| Component | Function |
|---|---|
| RSI | Momentum strength measurement |
| Stochastic RSI | Extreme zone detection |
| MACD | Trend-following momentum |
| EMA Trend | Price position relative to trend |
| Momentum | Rate of price change |
| Volume | Participation confirmation |
| Divergence Zone | Price/oscillator misalignment |
Common Regime Patterns
Momentum Building:   BIAS▲ → TRENDING▲
Momentum Fading:     TRENDING▲ → BIAS▲ → RANGING
Direction Emerging:  RANGING → BIAS▲ or BIAS▼
Momentum Reversal:   TRENDING▲ → TRENDING▼
Broad Agreement:     straight to a TRENDING regime
Whipsaw Conditions:  Rapid BIAS▲ ↔ BIAS▼ alternation
📞 Support
Technical Questions: support@signalpilot.io
Deepen your understanding with these articles from the Signal Pilot Blog:
Know when divergence signals are traps
The Confirmation TrapAvoid common mistakes when waiting for confirmation
Moving Averages ExplainedUnderstand the foundation of trend analysis
💬 Need Help?
Have questions about Harmonic Oscillator? Join our Discord community to get help from experienced users, share setups, and discuss approaches!
See Also
Related Pages:
- Janus Atlas v1.0 - Combine momentum signals with key structural levels
- OmniDeck v1.0 - Ten systems on one chart, read alongside Harmonic Oscillator rather than in place of it
- Best Practices & Pro Tips - Advanced strategies for momentum analysis
- How to Set Up Alerts - Get notified on consensus signals
- Analysis Workflow - How momentum fits into complete analysis system
Disclaimer: This indicator combines seven voting components (RSI, Stochastic RSI, MACD, EMA Trend, Momentum, Volume, Divergence Zone) into a consensus-based signal system. All signals represent multi-component agreement detection based on momentum and volume analysis methodologies. Individual interpretation, application, and outcomes vary. Past signal patterns do not guarantee future results. This is not financial advice.