Volume Oracle - Regime Detection
Volume Oracle reads the mood of the market from its volume. One bar on its own is noise; a regime is a mood that lasts. Volume Oracle shows who has been in control (buyers, sellers or nobody), warns you when that control starts to slip, and draws an arrow on the bars where volume, trend and flow line up.
 Watch it explainedOn our YouTube channel: every part shown on real charts, in TradingView Bar Replay.10:27
What you see
| On the pane | What it means |
|---|---|
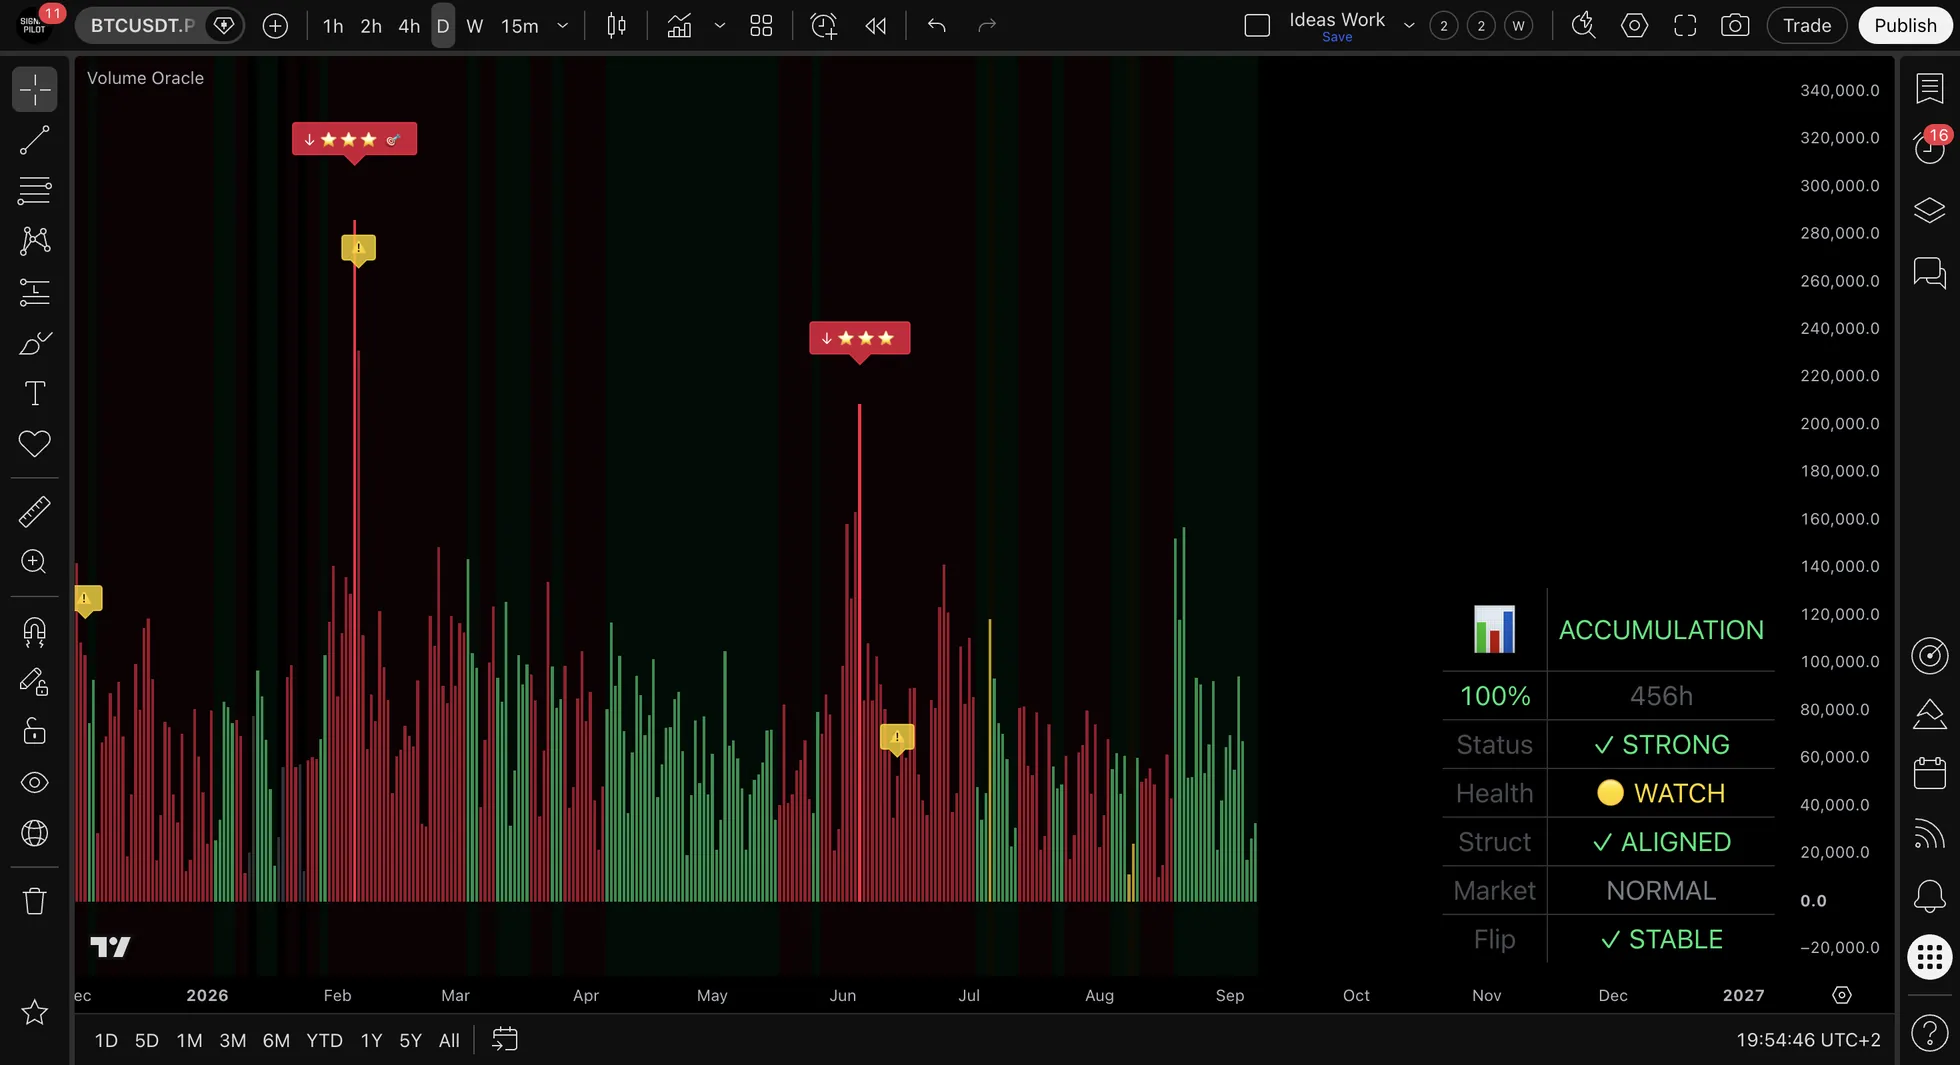
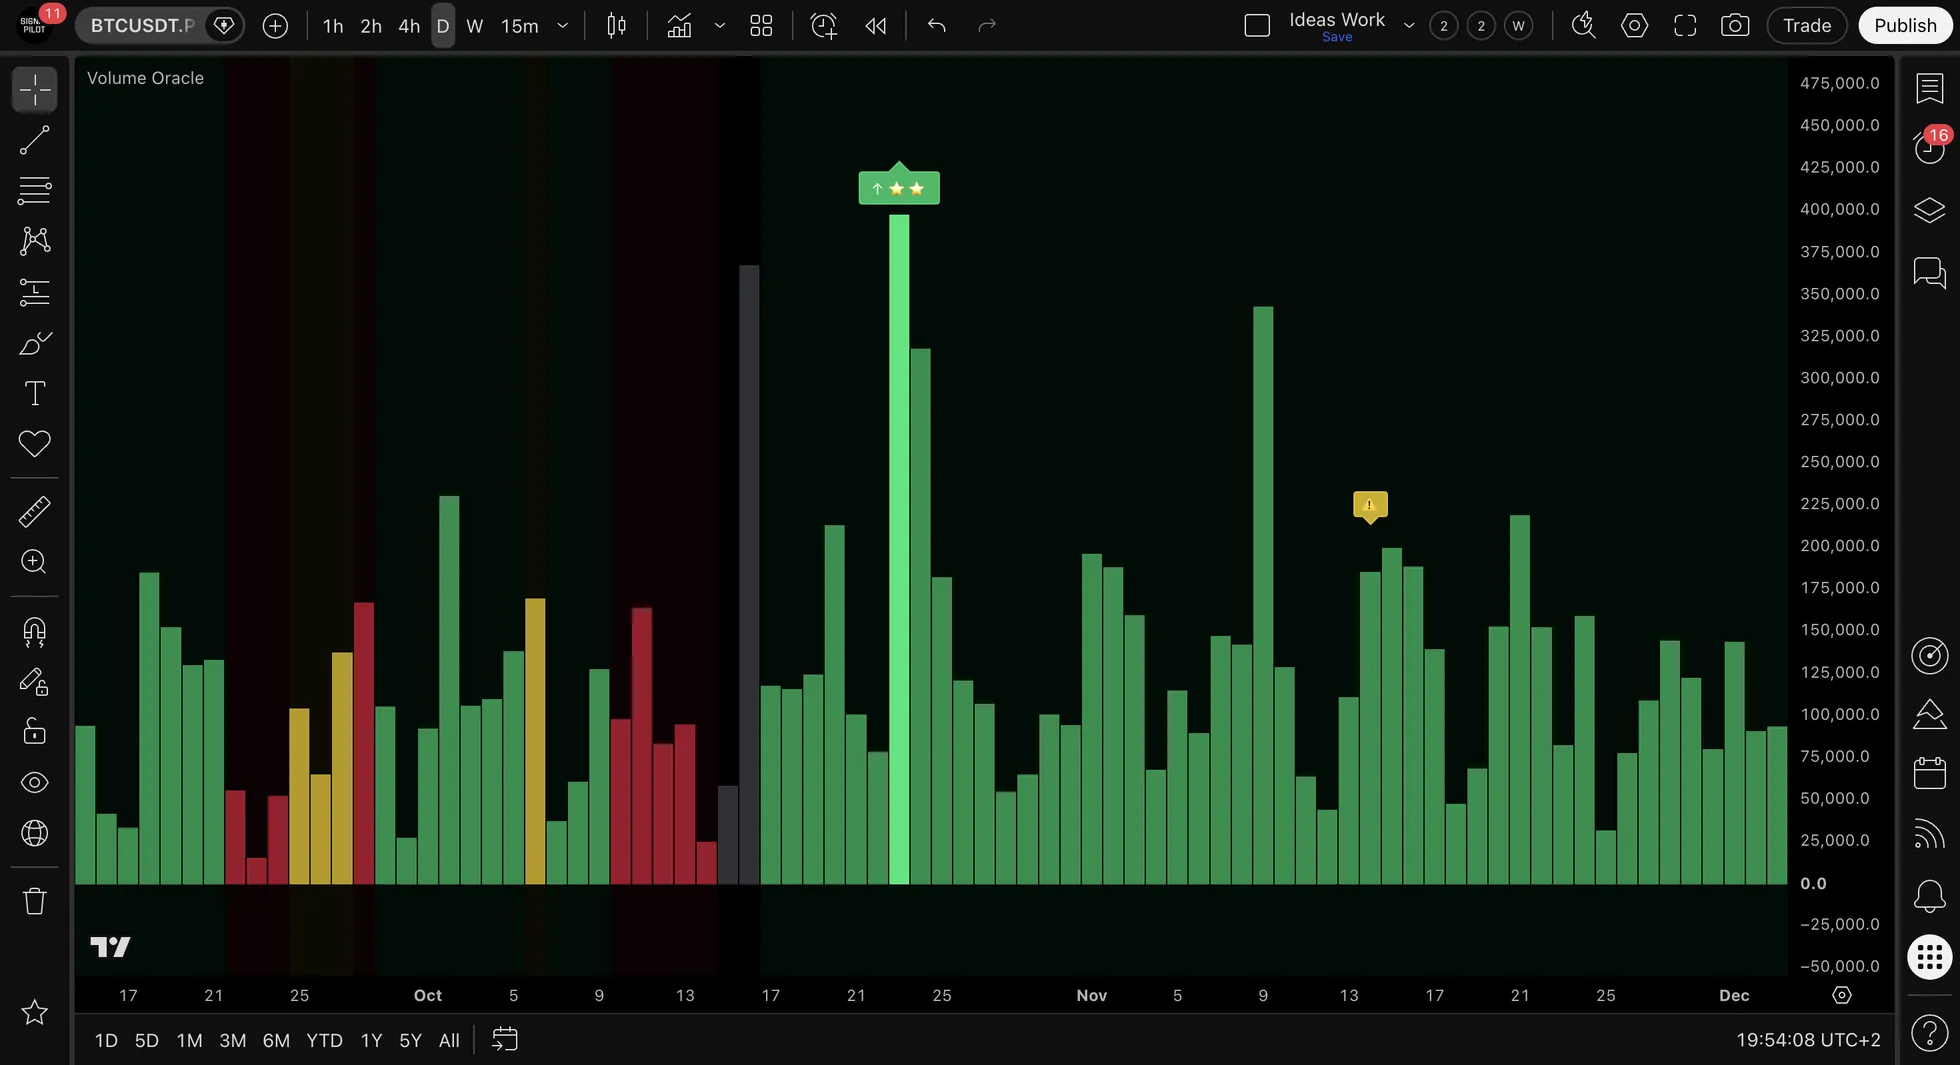
| Green columns and background | Accumulation: buyers have been in control |
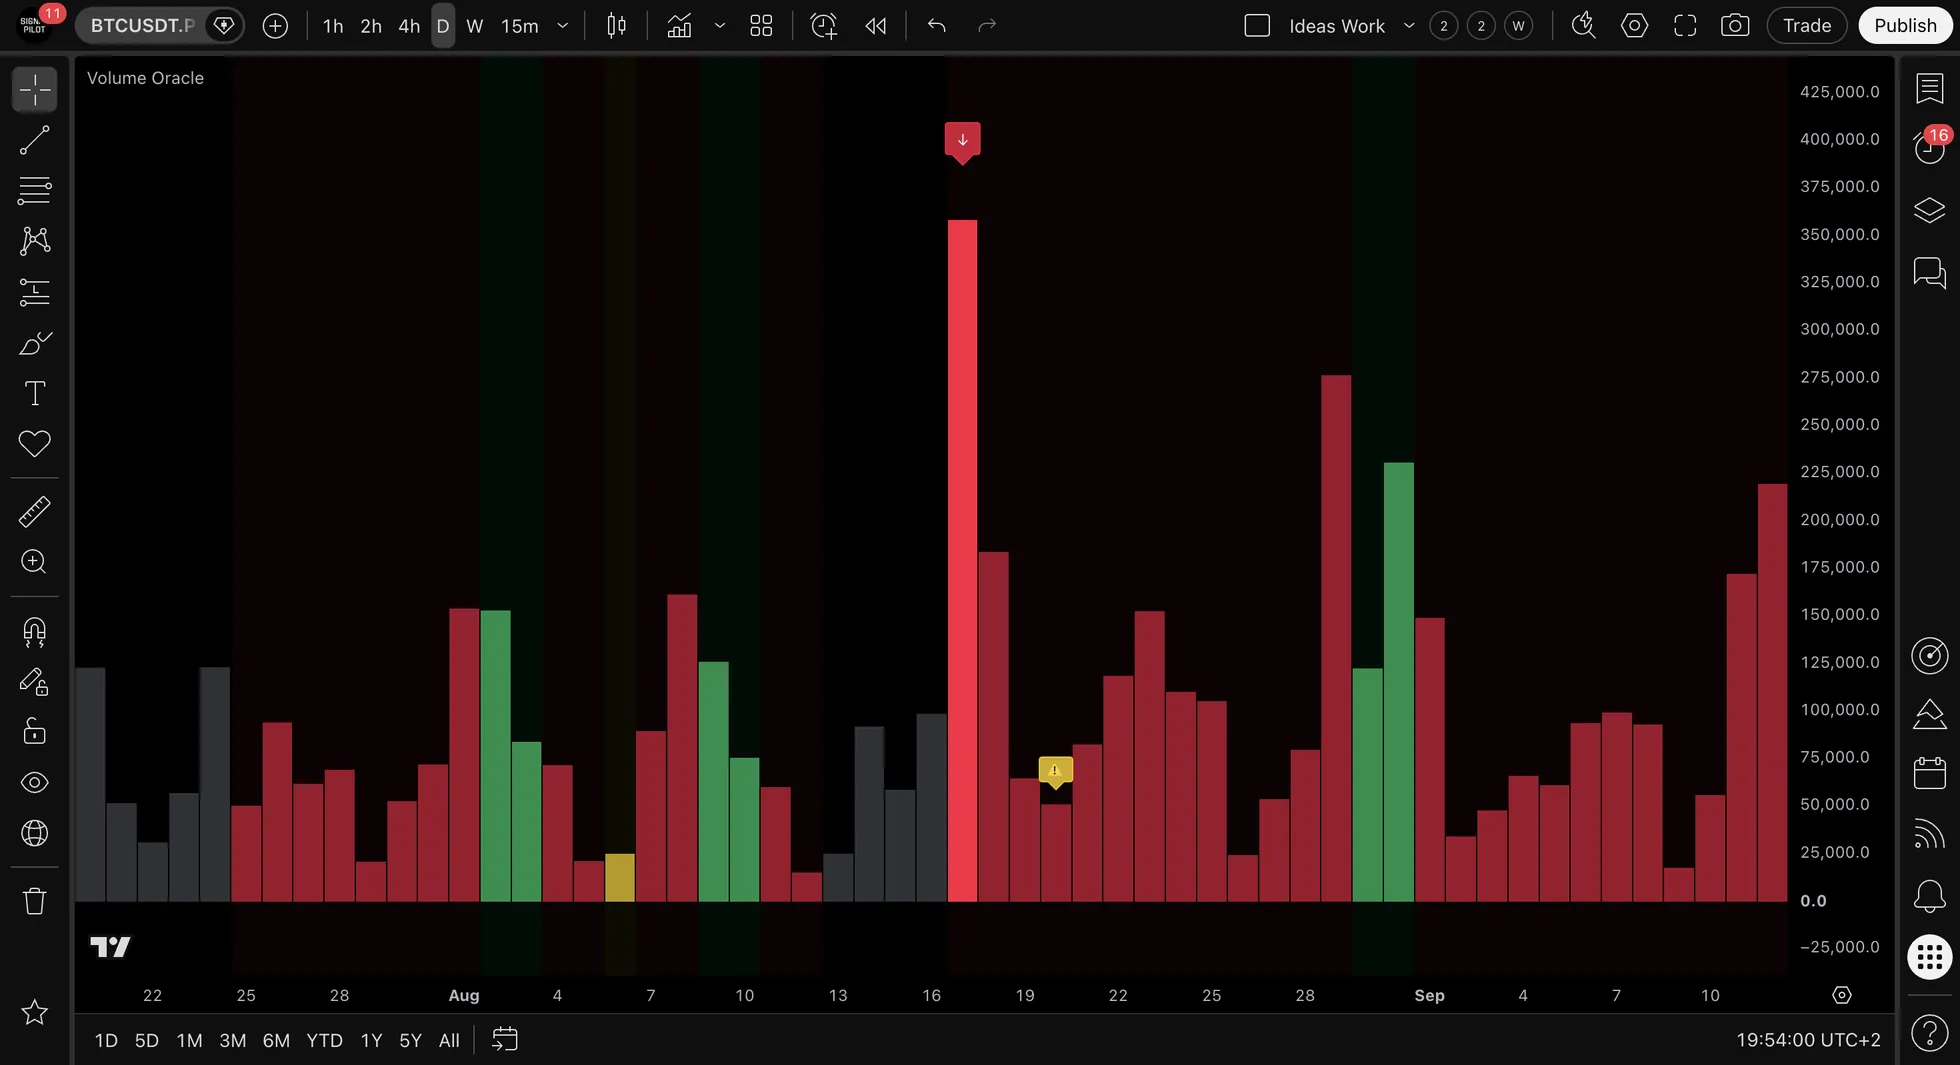
| Red columns and background | Distribution: sellers have been in control |
| Grey columns | Neutral: nobody is in control |
| Yellow columns and background | The regime has been losing its grip for three bars in a row |
| ↑ or ↓ arrow with stars | Volume, trend and flow lined up on this bar (see Arrows) |
| Yellow warning mark | An exit fired for the last arrow's plan |
| The table, bottom right | The regime and its health at a glance |
The three regimes
| Regime | What it means |
|---|---|
| ACCUMULATION | Buying pressure has been in control |
| DISTRIBUTION | Selling pressure has been in control |
| NEUTRAL | Neither side is in control |
Volume Oracle reads price, its averages and volume together, and waits for confirmation before it calls a change: two closed bars past the line, three on charts of five minutes or less. One loud bar can't flip it.
The table
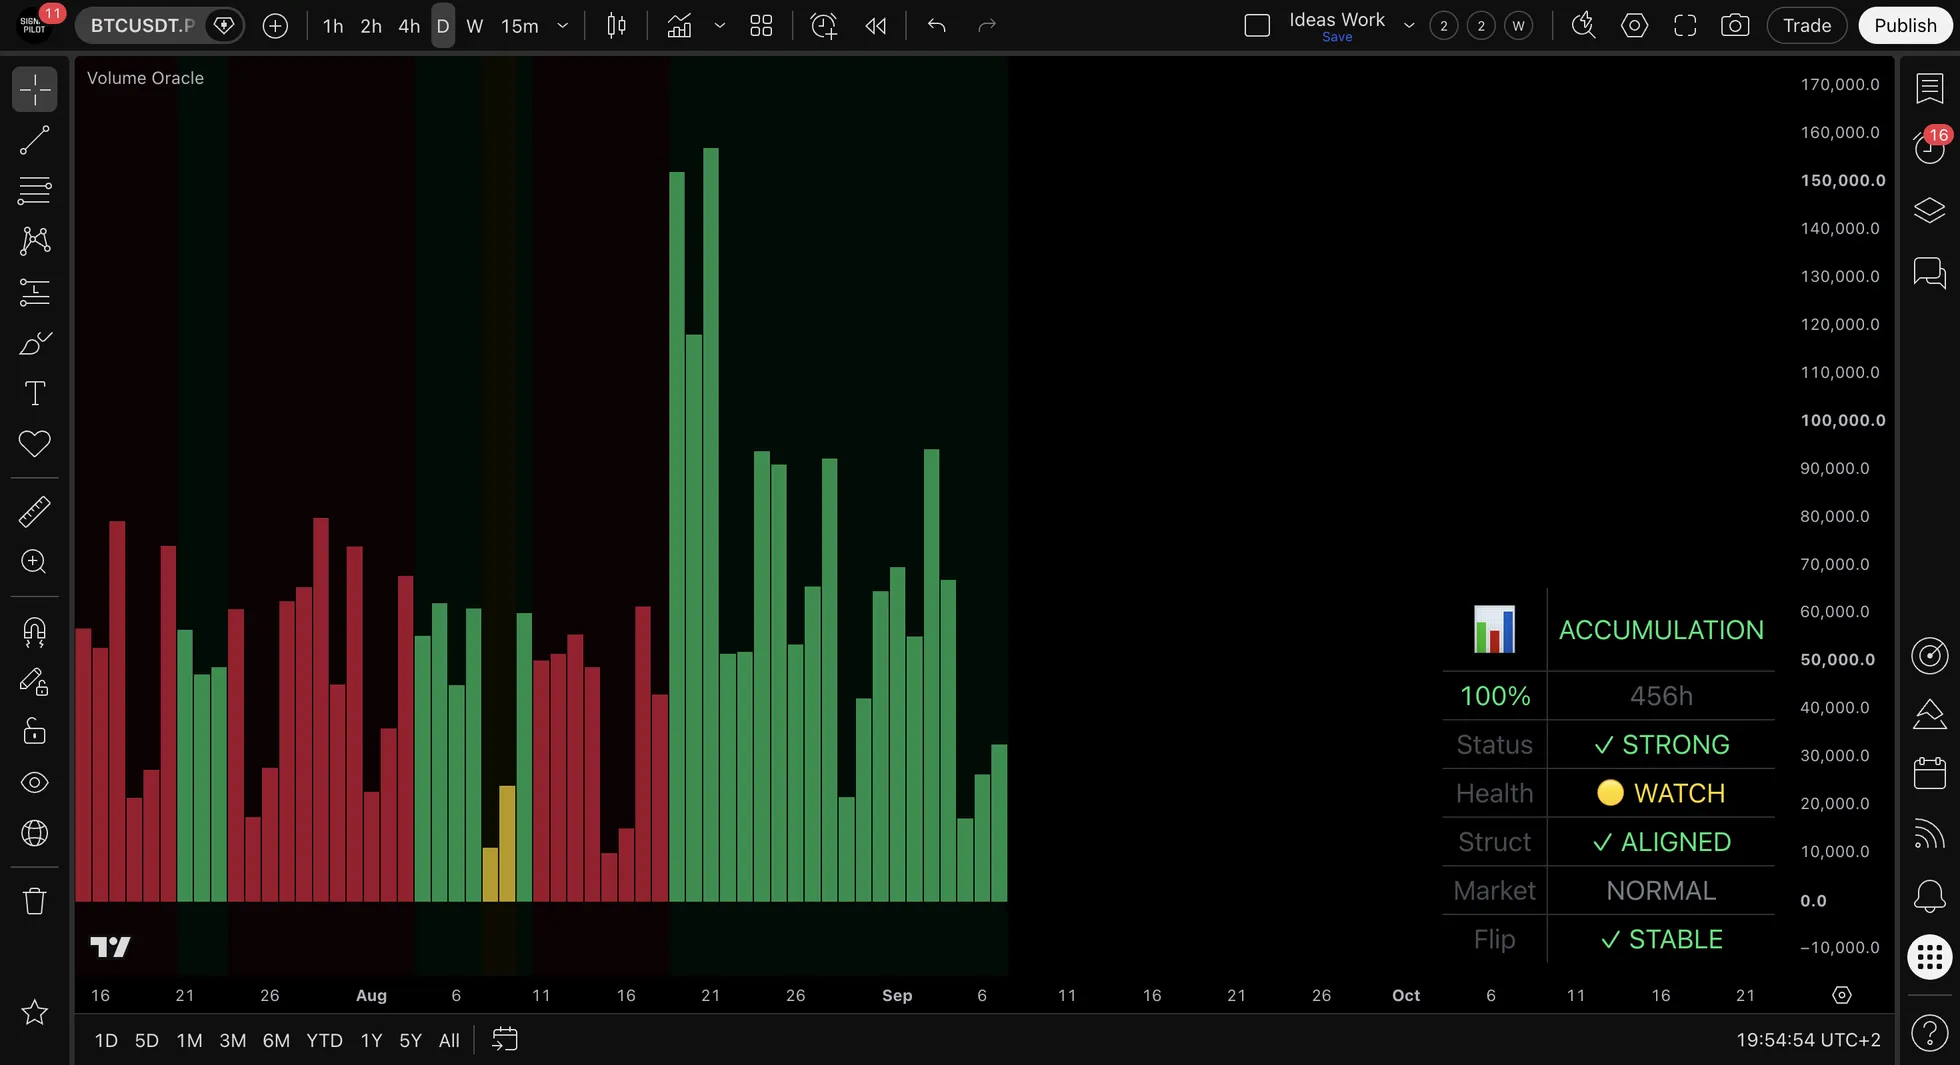
| Row | Example | What it tells you |
|---|---|---|
| Regime | ACCUMULATION | Who is in control |
| Strength and time | 100% · 456h | How strong the regime is, and how many hours it has held |
| Status | ✓ STRONG | How much of the regime's lead is left (see Warnings) |
| Health | 🟡 WATCH | How many of four warnings are on: momentum fading, buyers or sellers slipping, volume drying up, the regime weakening. 🟢 HEALTHY none · 🟡 WATCH one · 🟠 CAUTION two · 🔴 DANGER three or more |
| Struct | ✓ ALIGNED | Whether price's highs and lows agree with the regime. ✗ CONFLICT when they don't |
| Market | NORMAL | How often the regime has changed lately: TRENDING (rarely), NORMAL, CHOPPY (often) |
| Flip | ✓ STABLE | A change building. → ACC 1/2 means one of the two bars needed toward Accumulation |
Warnings come before the change
The Status row steps down as the regime's lead shrinks:
| Status | What it means |
|---|---|
| ✓ STRONG | The regime has a wide lead |
| 📉 FADING | The lead is shrinking: an early warning |
| ⚡ WEAKENING | Shrinking further |
| ⚠️ CRITICAL | Very little lead left |
| ⚠️ FLIPPED | The reading has crossed to the other side, but the regime hasn't changed yet |
| NEUTRAL | There is no regime to weaken |
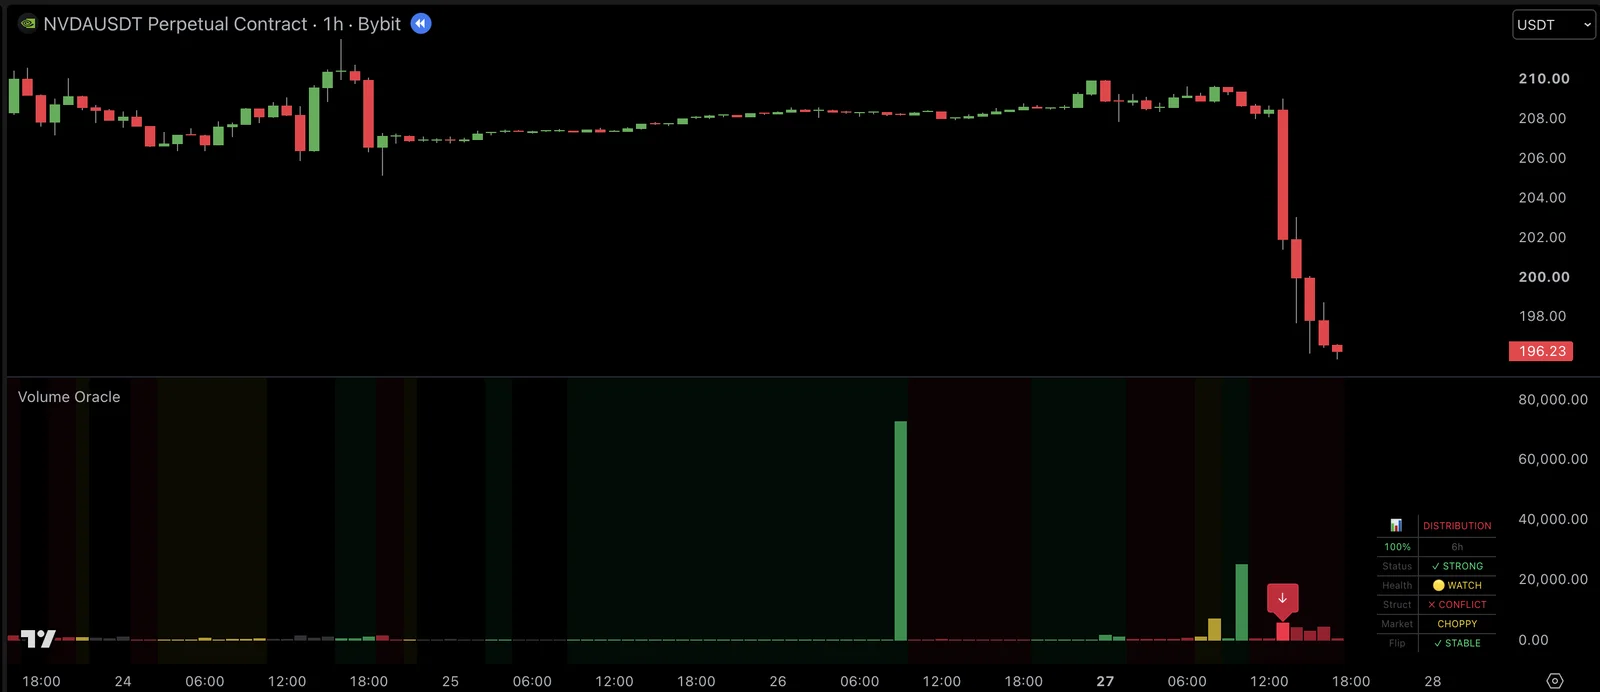
After three warning bars in a row the columns and the background turn yellow. That's a warning, not a change. The regime only changes once the other side holds for the confirmation bars, and the Flip row counts them as they build.
Arrows
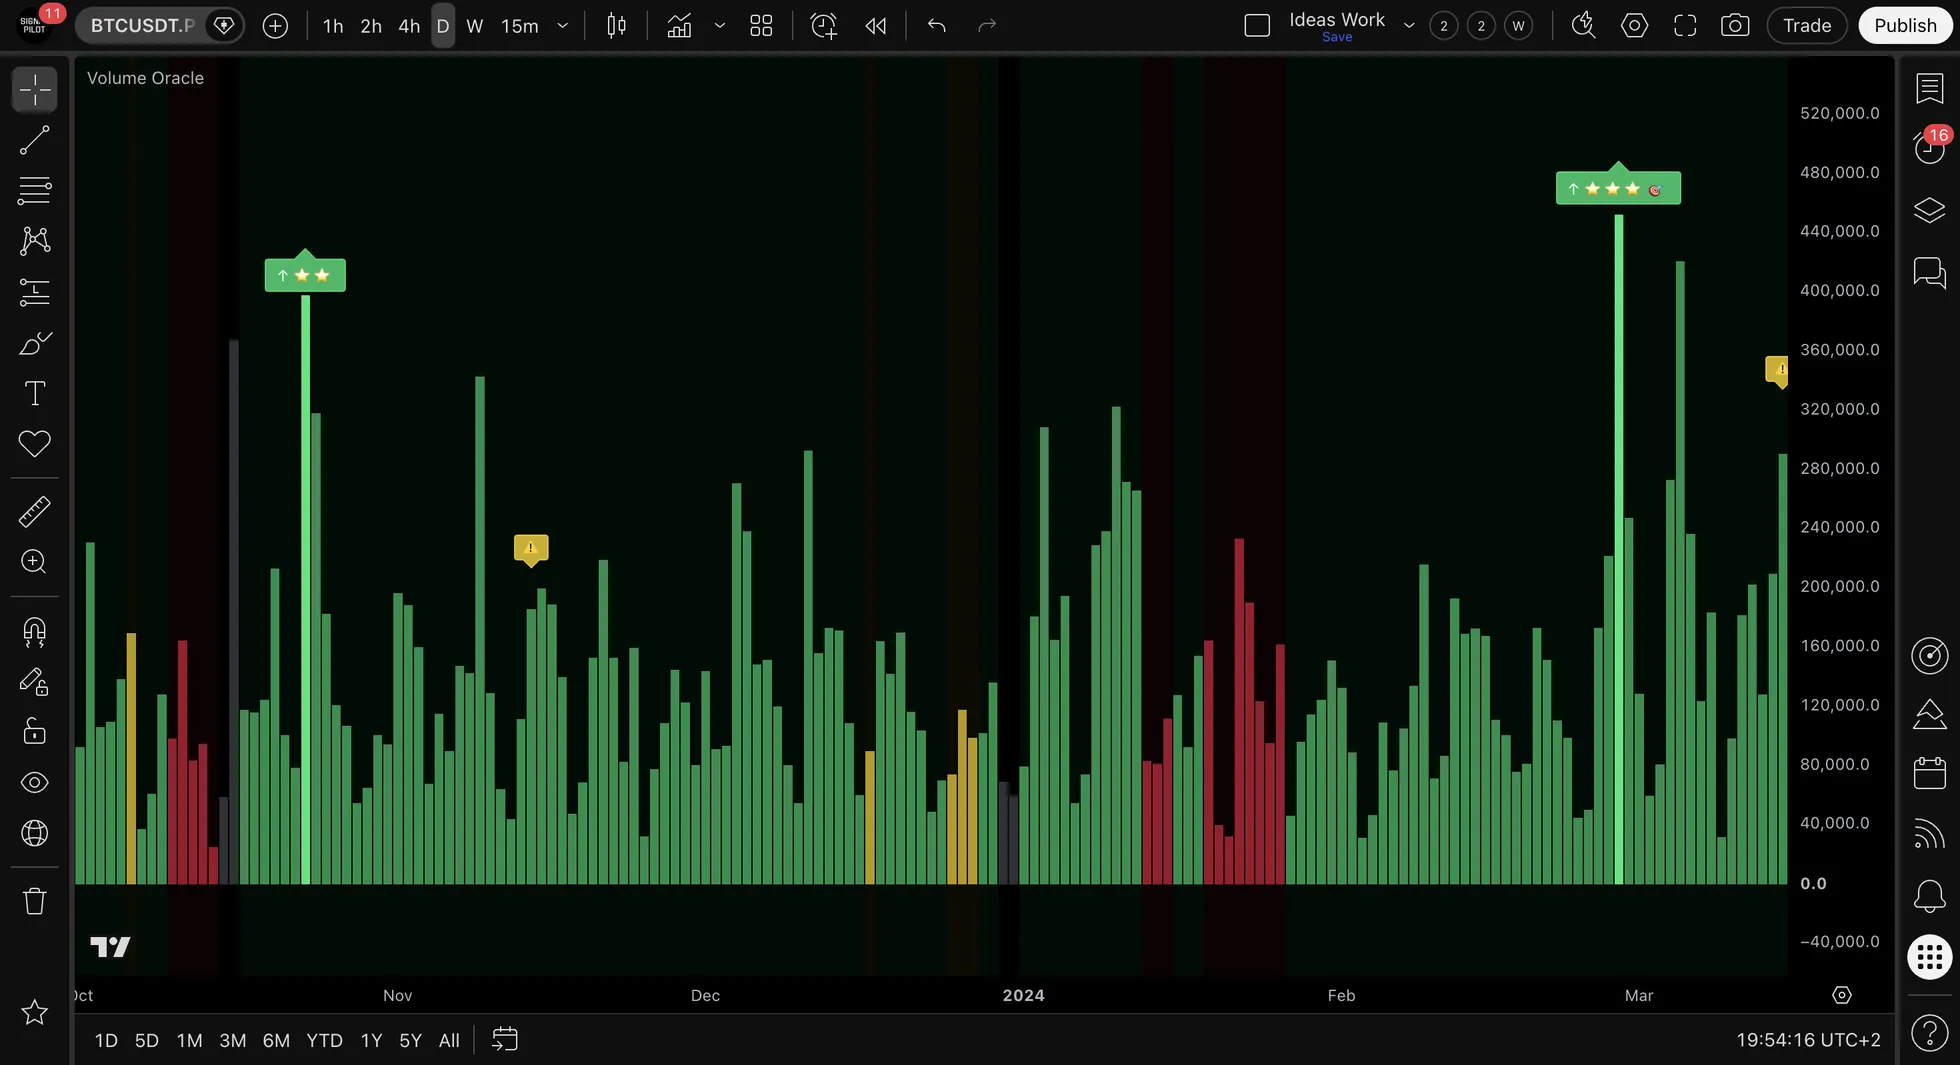
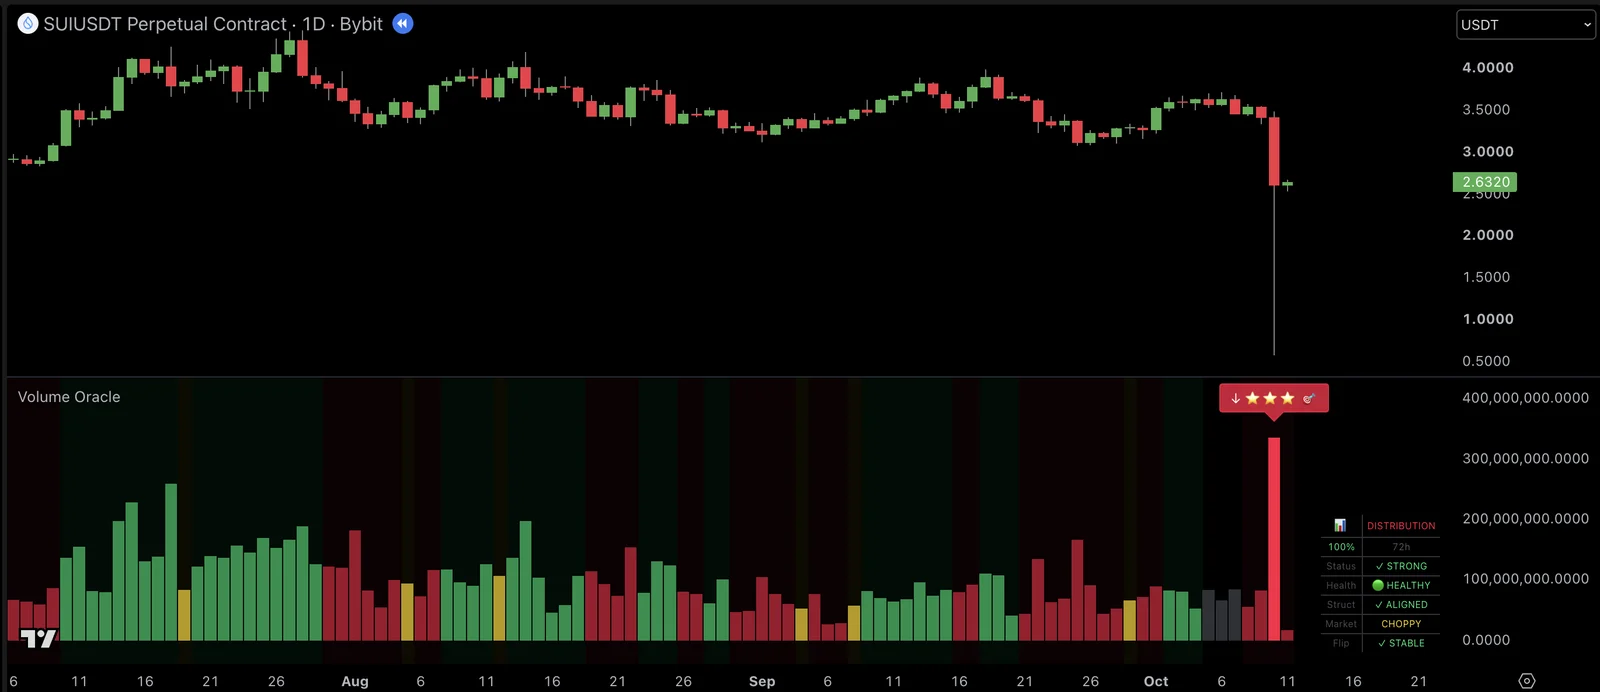
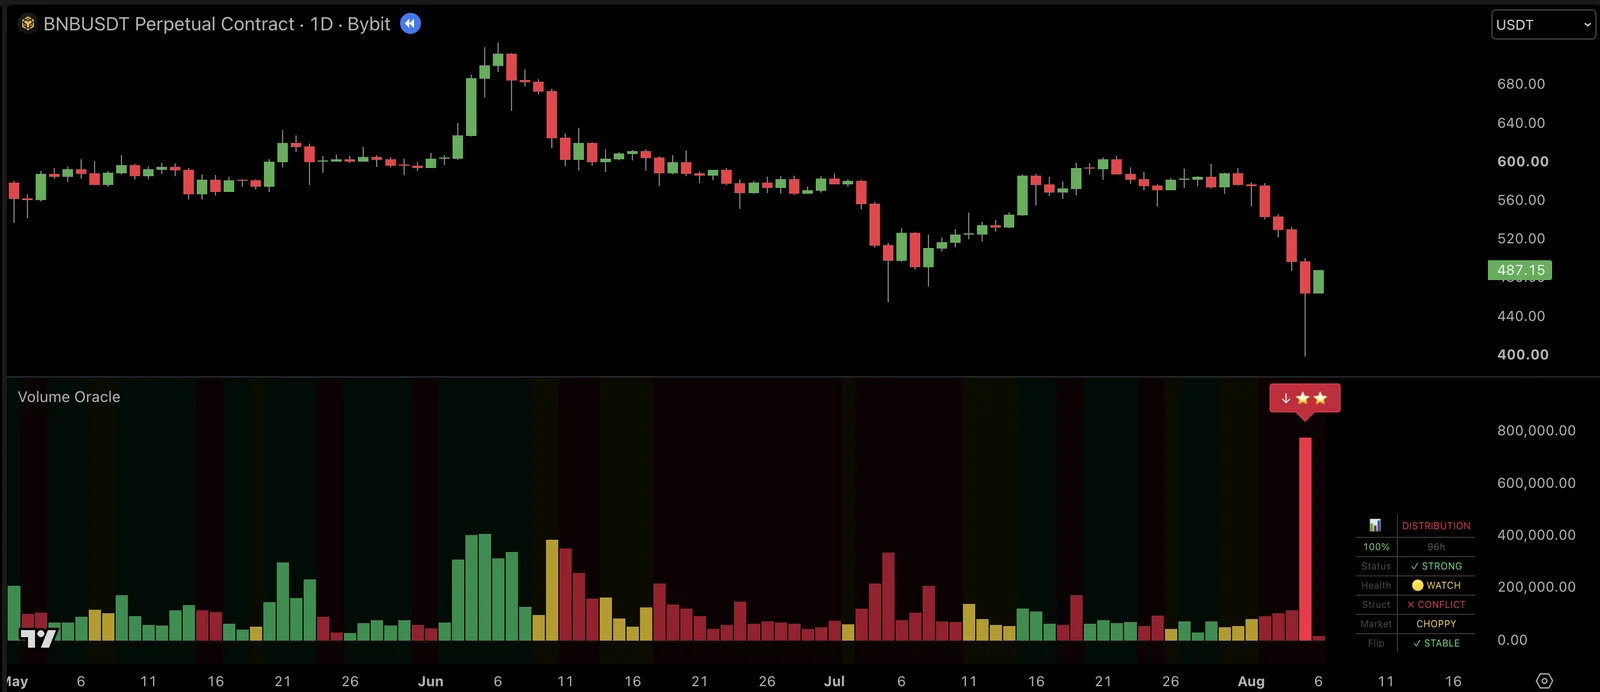
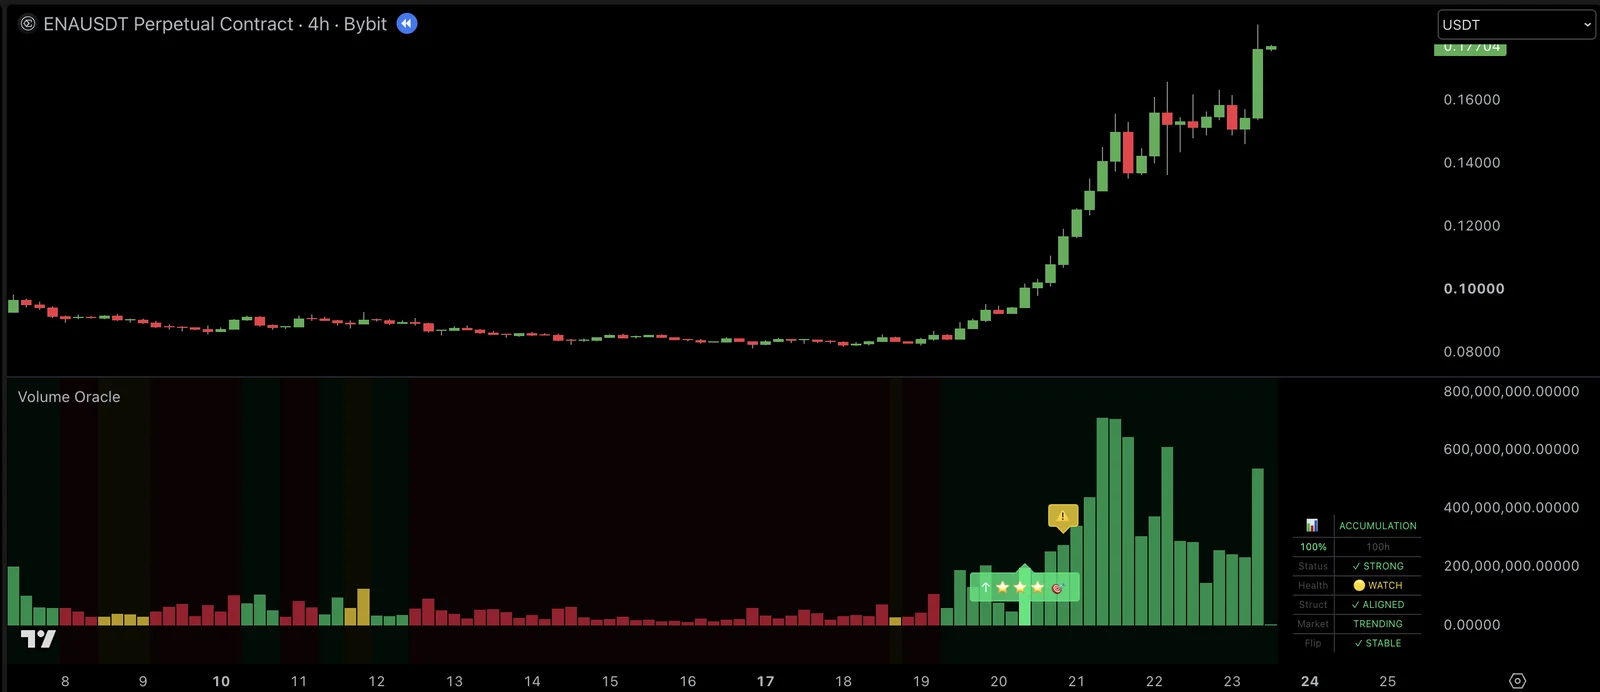
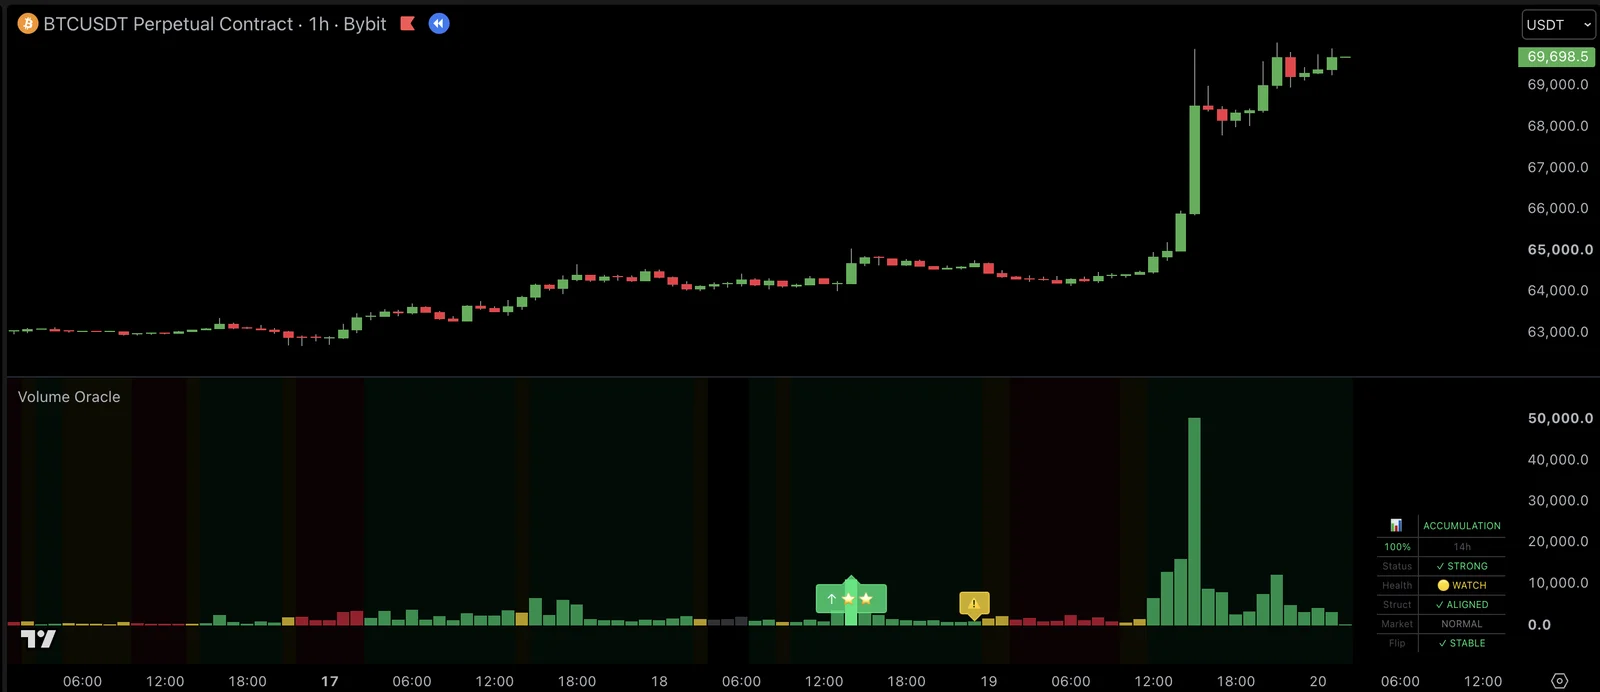
An up arrow is drawn on a closed bar when these line up: a volume spike, a bar that closes up, price trending up, buyers holding most of the recent volume, and an Accumulation regime. A down arrow is the mirror, inside Distribution. After an arrow, Volume Oracle waits 45 bars before it draws the next one.
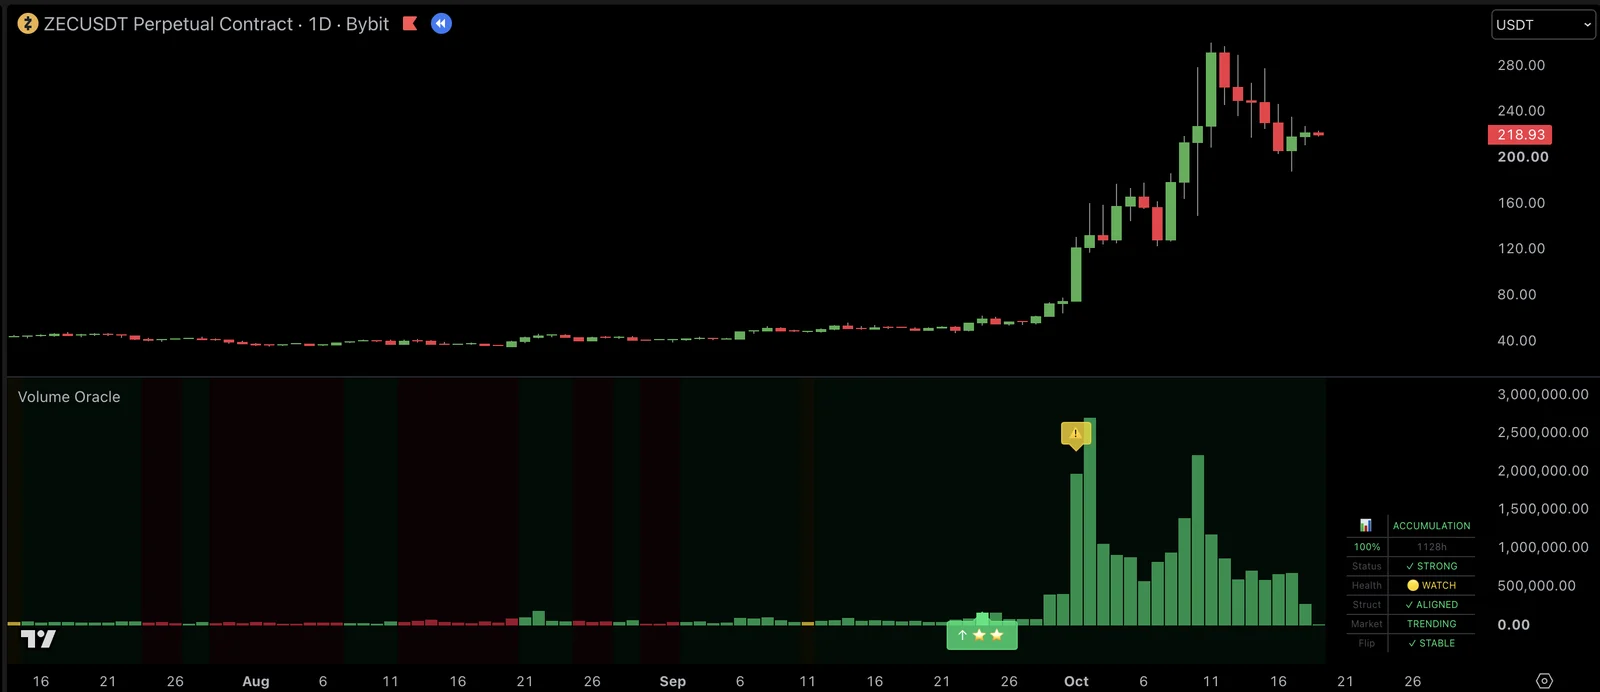
Up to three stars show how much else agrees, such as the price structure, the regime's strength and a trending market. A target mark after the stars means at least five things agree.
Hover an arrow to see its plan: a stop and two targets set from the ATR, and a position size from your account size and risk per trade. While that plan is open, a yellow warning mark sits on the bar where one of its exits fires: the regime flips or turns Critical, the other side takes over the volume, the time limit passes, the stop is hit, or Target 2 is reached. Hover the mark for the reason.
Real examples
Each part at work on a real chart. Every example was picked because it shows one part clearly, and shows what happened that time; plenty of the same readings are followed by nothing much.
Settings that matter
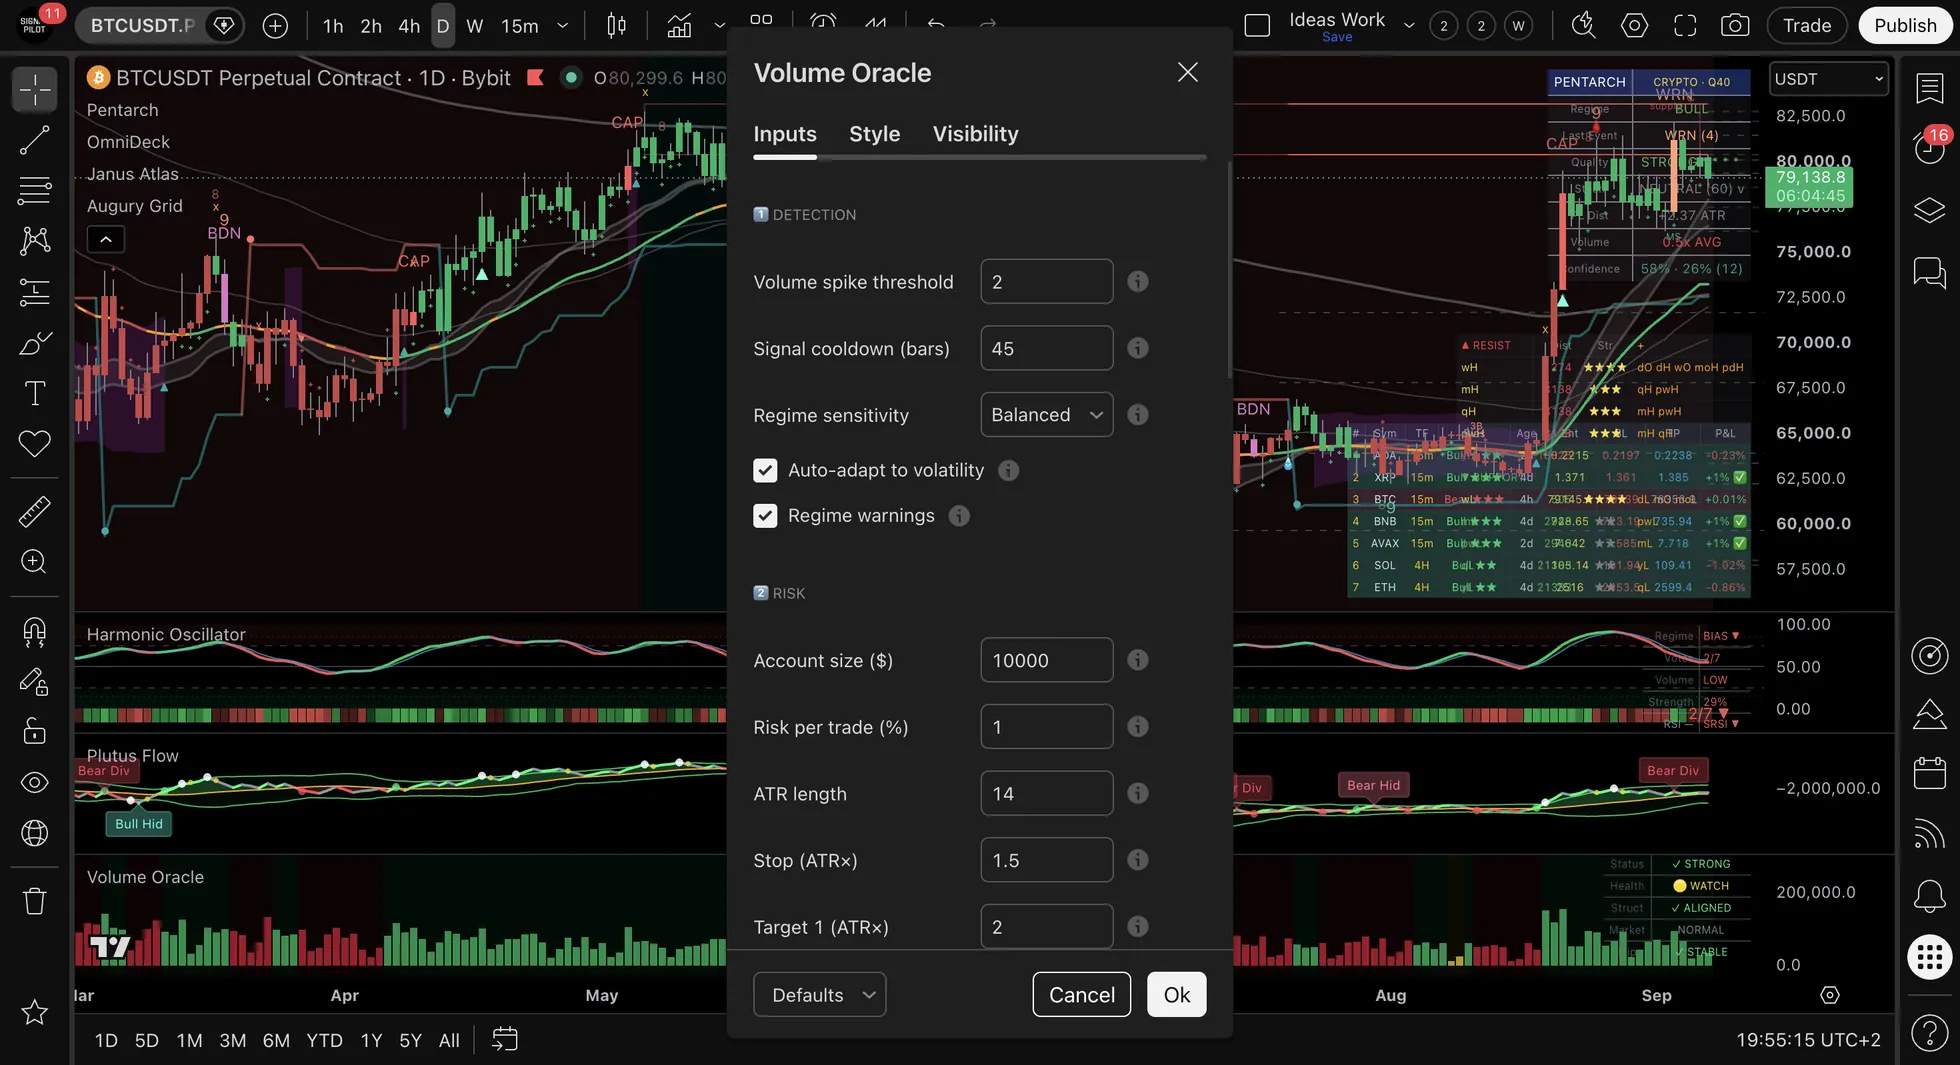
| Setting | Default | What it changes |
|---|---|---|
| Volume spike threshold | 2.0 | How big a spike must be. Higher means fewer, bigger spikes |
| Signal cooldown (bars) | 45 | The bars between two arrows |
| Regime sensitivity | Balanced | Conservative changes regime less often, Aggressive more often |
| Auto-adapt to volatility | On | Fits the regime lines to how volatile the market is |
| Regime warnings | On | The yellow warnings. Off leaves only the regime changes |
| Account size ($) · Risk per trade (%) | 10,000 · 1 | The position size in each arrow's tooltip |
| Stop · Target 1 · Target 2 (ATR×) | 1.5 · 2.0 · 3.5 | The plan's levels, in multiples of the ATR (length 14) |
| Enable HTF filter | Off | Checks a higher timeframe (1 hour by default) for the same regime. With Strict mode on, arrows need it to agree |
| Mode | Trend Following | Mean Reversion draws arrows (marked MR) where price has stretched far against the regime. Hybrid adds those to the trend arrows when Mean reversion signals is on |
| Layout · Position · Text size | Vertical · Bottom Right · Tiny | Where the table sits and how big it is |
Alerts
Volume Oracle has 25 alerts. Pick them by name in TradingView's alert window.
| Group | Alerts |
|---|---|
| Arrows | 🟢 BULL Signal · 🔴 BEAR Signal · ⚡ ANY Signal · 🎯 High Confluence Signal |
| The plan | 🎯 Target 1 Hit · 🔒 Breakeven · ⚠️ Exit Warning |
| Regime | 📈 Regime → Accumulation · 📉 Regime → Distribution · ⚖️ Regime → Neutral · 🔄 Any Regime Change · ⚡ Regime Weakening |
| Warnings | 📉 Momentum Fading · 📉 Flow Deteriorating · 📉 Volume Drying Up · 🟠 Multiple Warnings (two or more at once) |
| Structure and footprints | 📊 Structure Bullish · 📊 Structure Bearish · ⚠️ Structure Conflict · 🔥 Momentum Footprint (big volume, wide body) · 🛡️ Absorption Footprint (big volume, small body, long wicks) |
| Market and higher timeframe | 📈 Market Trending · 📉 Market Choppy · ✅ HTF Aligned · ❌ HTF Broke (these two need the HTF filter on) |
Good to know
- It doesn't repaint. Arrows and exit marks appear only once the bar has closed. The table updates live on the bar that is still forming.
- It needs real volume. Thin sessions, and markets with little or unreliable volume, give weak readings.
- It describes, it doesn't forecast. A regime shows who has been in control, not what comes next.
- Read it with the others. Pentarch shows where the cycle stands, Janus Atlas the levels price is near.
📞 Support
Technical Questions: support@signalpilot.io
Deepen your understanding with these articles from the Signal Pilot Blog:
Learn to identify accumulation and distribution phases
Volume Profile BasicsMaster the fundamentals of volume-at-price analysis
Volume Flow AnalysisFollow volume footprints through the market
💬 Need Help?
Have questions about Volume Oracle? Join our Discord community to get help from experienced users, share setups, and discuss approaches!
See Also
Related Pages:
- OmniDeck - Ten systems on one chart, read alongside Volume Oracle
- Plutus Flow - The flow of volume over time, built on OBV
- Volume Oracle Quick Reference - One-page cheat sheet
- How to Set Up Alerts - Get a message when an alert fires
- Analysis Workflow - Where volume fits with the other six
Disclaimer: Volume Oracle describes past volume and price; it does not predict. Its risk levels are calculated automatically and leave out fees, commissions and slippage. Results vary. Past performance does not guarantee future results. This is not financial advice.