OmniDeck - Unified Chart Overlay
All-in-one analysis system. Combines 10 professional analysis tools into single optimized indicator.
New to Technical Analysis? Start Here
In Plain English: OmniDeck is like having 10 analytical systems looking at your chart at once. Instead of adding 10 separate indicators (which makes charts messy and confusing), OmniDeck combines all 10 into ONE clean display.
Don't Panic About "10 Systems"! You don't need to understand or use all 10 at once. Think of it like a Swiss Army knife: it has many tools, but you start by learning the basics.
Beginner Starting Point (Your First 2 Weeks):
Turn on ONLY these 4 systems at first:
- Exhaustion Counter : Shows counting numbers (1-9) marking possible exhaustion
- Squeeze Detector : Dots while volatility compresses, an arrow when it breaks out
- Moving Averages (EMA Trio) : Shows price direction (up or down trend)
- Regime Box : Background color shows market mood (green = bullish, red = bearish)
Everything else? Turn it OFF for now. You can add more features as you learn.
What You'll See on Your Chart:
- Numbers (1-9) counting toward possible reversals (Exhaustion Counter)
- Dots and arrows marking compression and breakout (Squeeze Detector)
- Colored lines showing the trend direction (EMA Trio)
- Background color showing market mood (Regime Box)
Start with the 4 systems above. Add more gradually as you learn what you need.
🎓 What are the 10 systems? (Advanced Info)
OmniDeck includes these 10 analysis systems:
- Exhaustion Counter : Counts price exhaustion (like Pentarch)
- Squeeze Detector : Spots when volatility is about to explode
- Liquidity Sweeps : Detects stop-hunt patterns
- EMA Trio : Three moving averages showing trend direction
- SuperTrend : Adaptive trend-following ribbon
- BMSB : Support band analysis
- Regime Box : Classifies market mood (bullish/bearish/neutral)
- Supply/Demand Zones : Key price zones where orders cluster
- Candlestick Patterns : 16 pattern types automatically detected
- Meta Tools : Coordinates all systems and prevents conflicts
But remember: You don't need to master all 10 to benefit from OmniDeck. Start simple, add complexity gradually.
💡 Pro Tip: OmniDeck is designed for intermediate-to-advanced users, but beginners can use it successfully by starting with the four systems above. Don't let "10 systems" intimidate you: use what you understand, ignore the rest until you're ready!
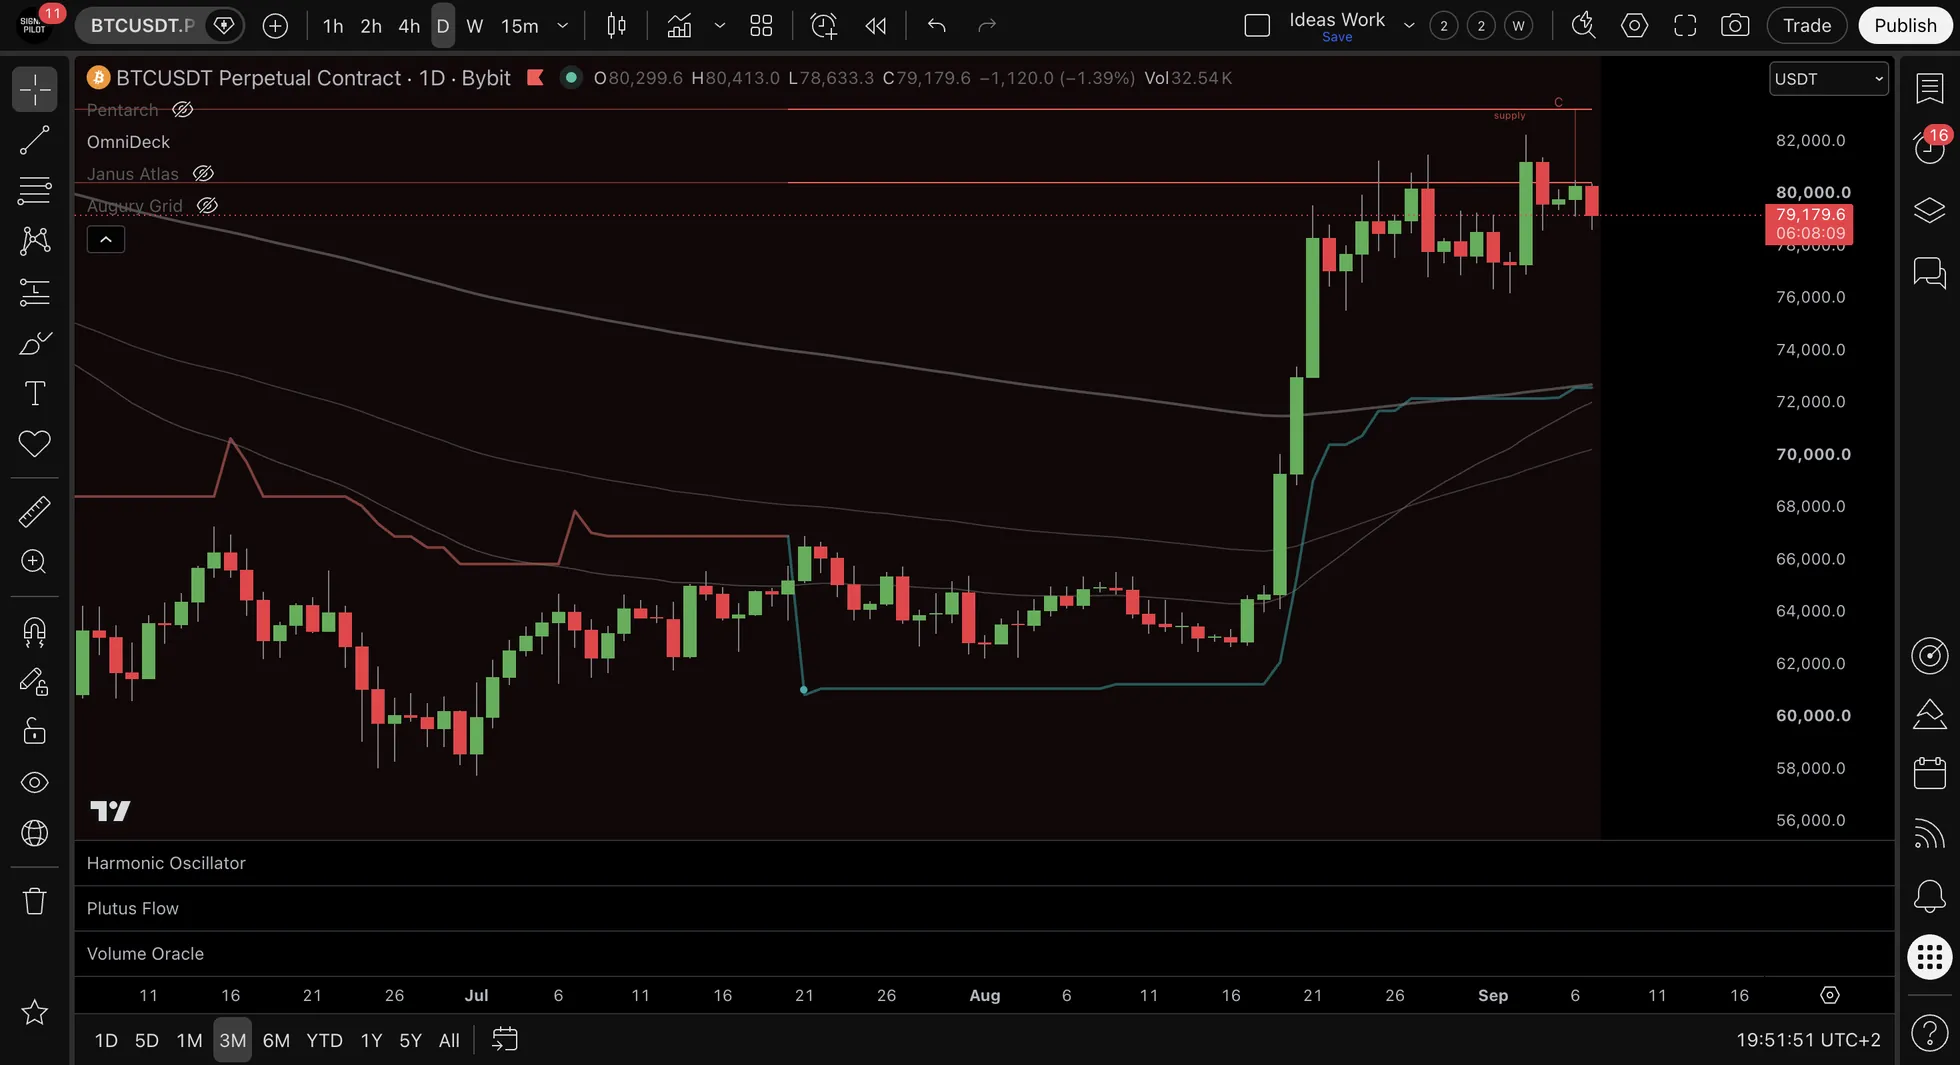
🎯 Core Functionality Beginner Friendly
10 Systems in 4 Layers
OmniDeck integrates multiple detection systems into a unified framework:
| L1: Trend | EMA Trio · SuperTrend · BMSB |
| L2: Patterns | Exhaustion Counter · Squeeze · Candlesticks |
| L3: Zones | Regime Box · Supply/Demand · Liquidity |
| L4: Meta | Confluence Panel · Alert Coordination |
The 10 Systems
1. Exhaustion Counter → 2. Squeeze → 3. Liquidity → 4. EMA Trio → 5. SuperTrend →
6. BMSB → 7. Regime Box → 8. Supply/Demand → 9. Candlesticks → 10. Meta Tools
Timeframe Compatibility: Works on all timeframes. All enabled systems appear on single chart.
Remember: Just because you CAN enable all 10 systems doesn't mean you SHOULD. Chart overload leads to analysis paralysis: too many signals create confusion, not clarity. Most effective users run 3-5 systems maximum, choosing ones that complement their specific approach rather than enabling everything.
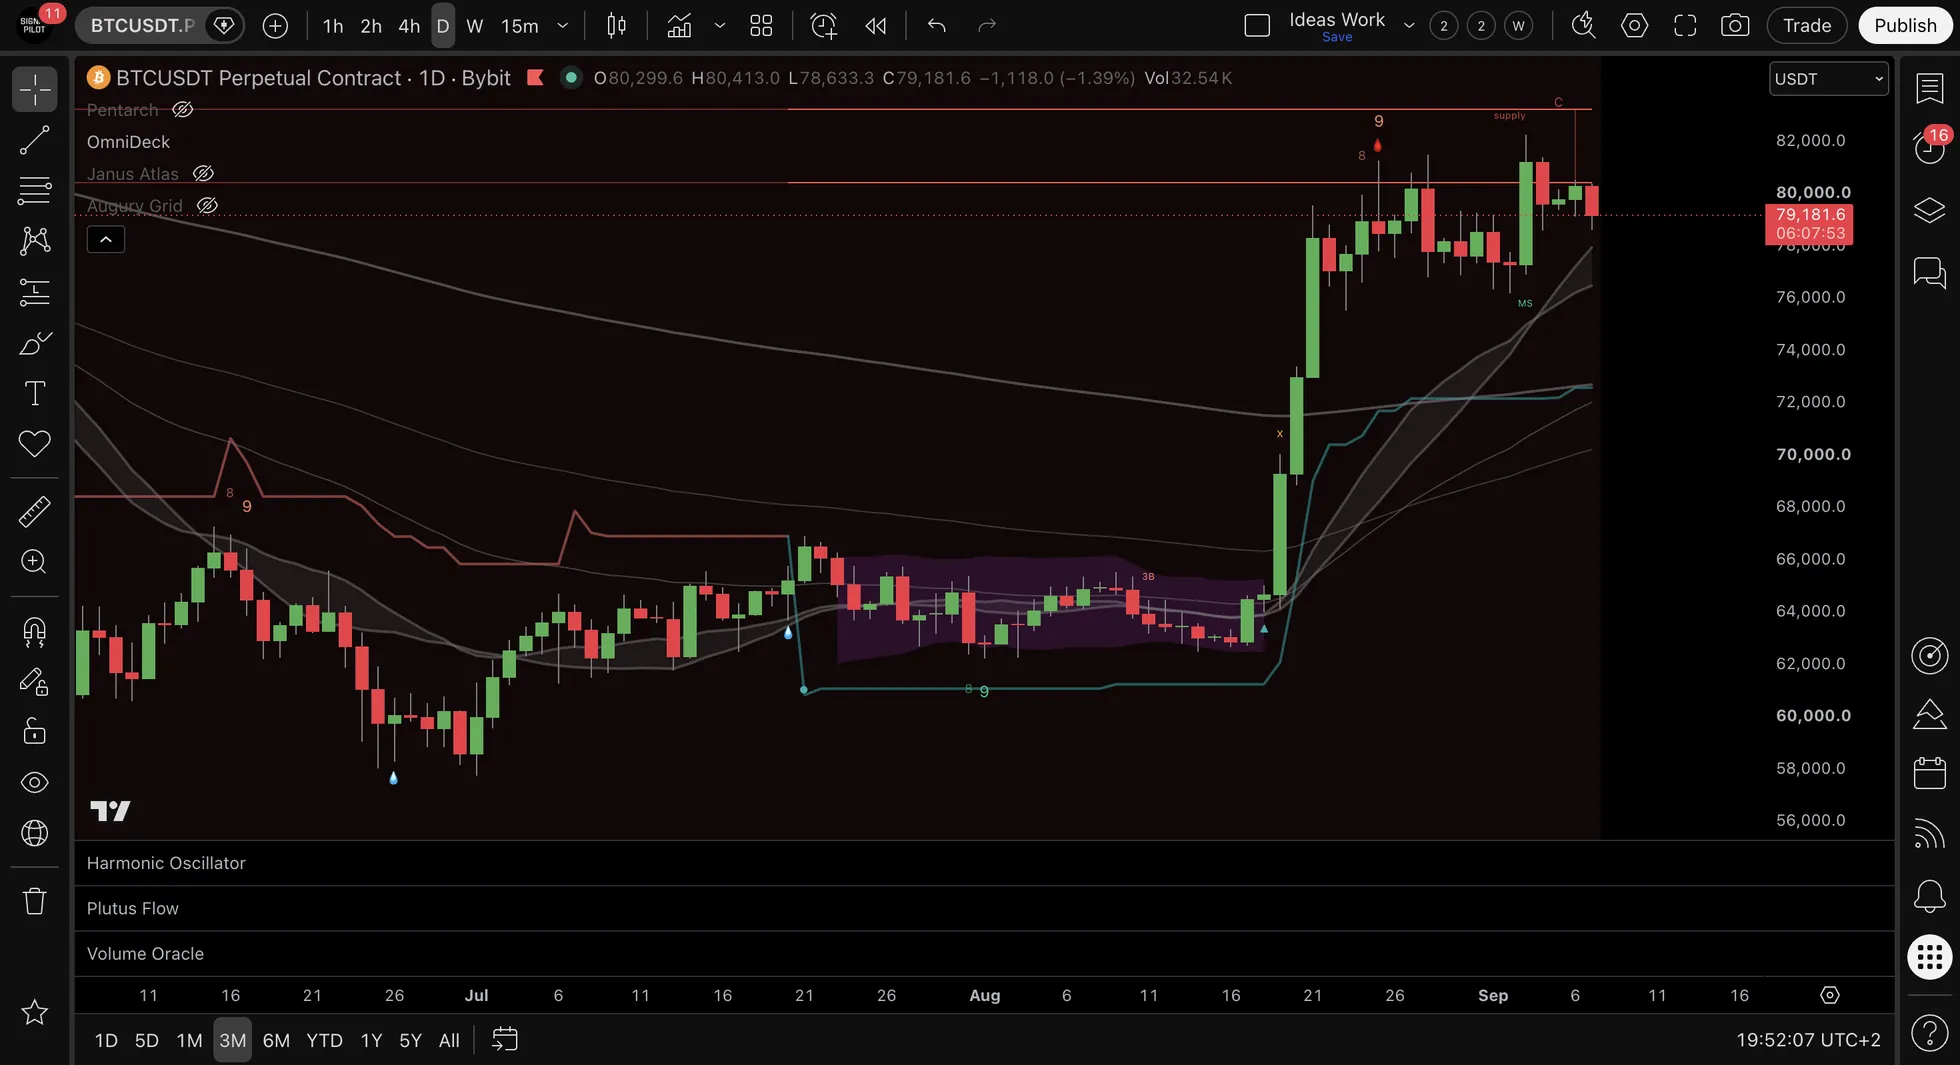
⚙️ Settings Beginner Friendly
Example Starting Configuration
Example System Selection (educational starting point - 4 of 10):
Enable these systems first:
- ✓ Exhaustion Counter (exhaustion signals)
- ✓ Squeeze Detector (breakout arrows)
- ✓ EMA Trio (trend context)
- ✓ Regime Box (bias filter)
Additional systems can be enabled progressively.
Progressive Learning Path
Week 1-2: Foundation (4 systems)
- Master Exhaustion Counter signal interpretation
- Understand Squeeze breakout mechanics
- Learn EMA trend identification
- Use Regime Box for directional context
Week 3-4: Enhancement (add 2-3 systems)
- Add BMSB (support band)
- Add SuperTrend (trend confirmation)
- Add Liquidity Sweeps (stop hunt detection)
Month 2+: Customization (selective addition)
- Add Supply/Demand Zones if zone-based approach used
- Add Candlestick Patterns if pattern recognition valued
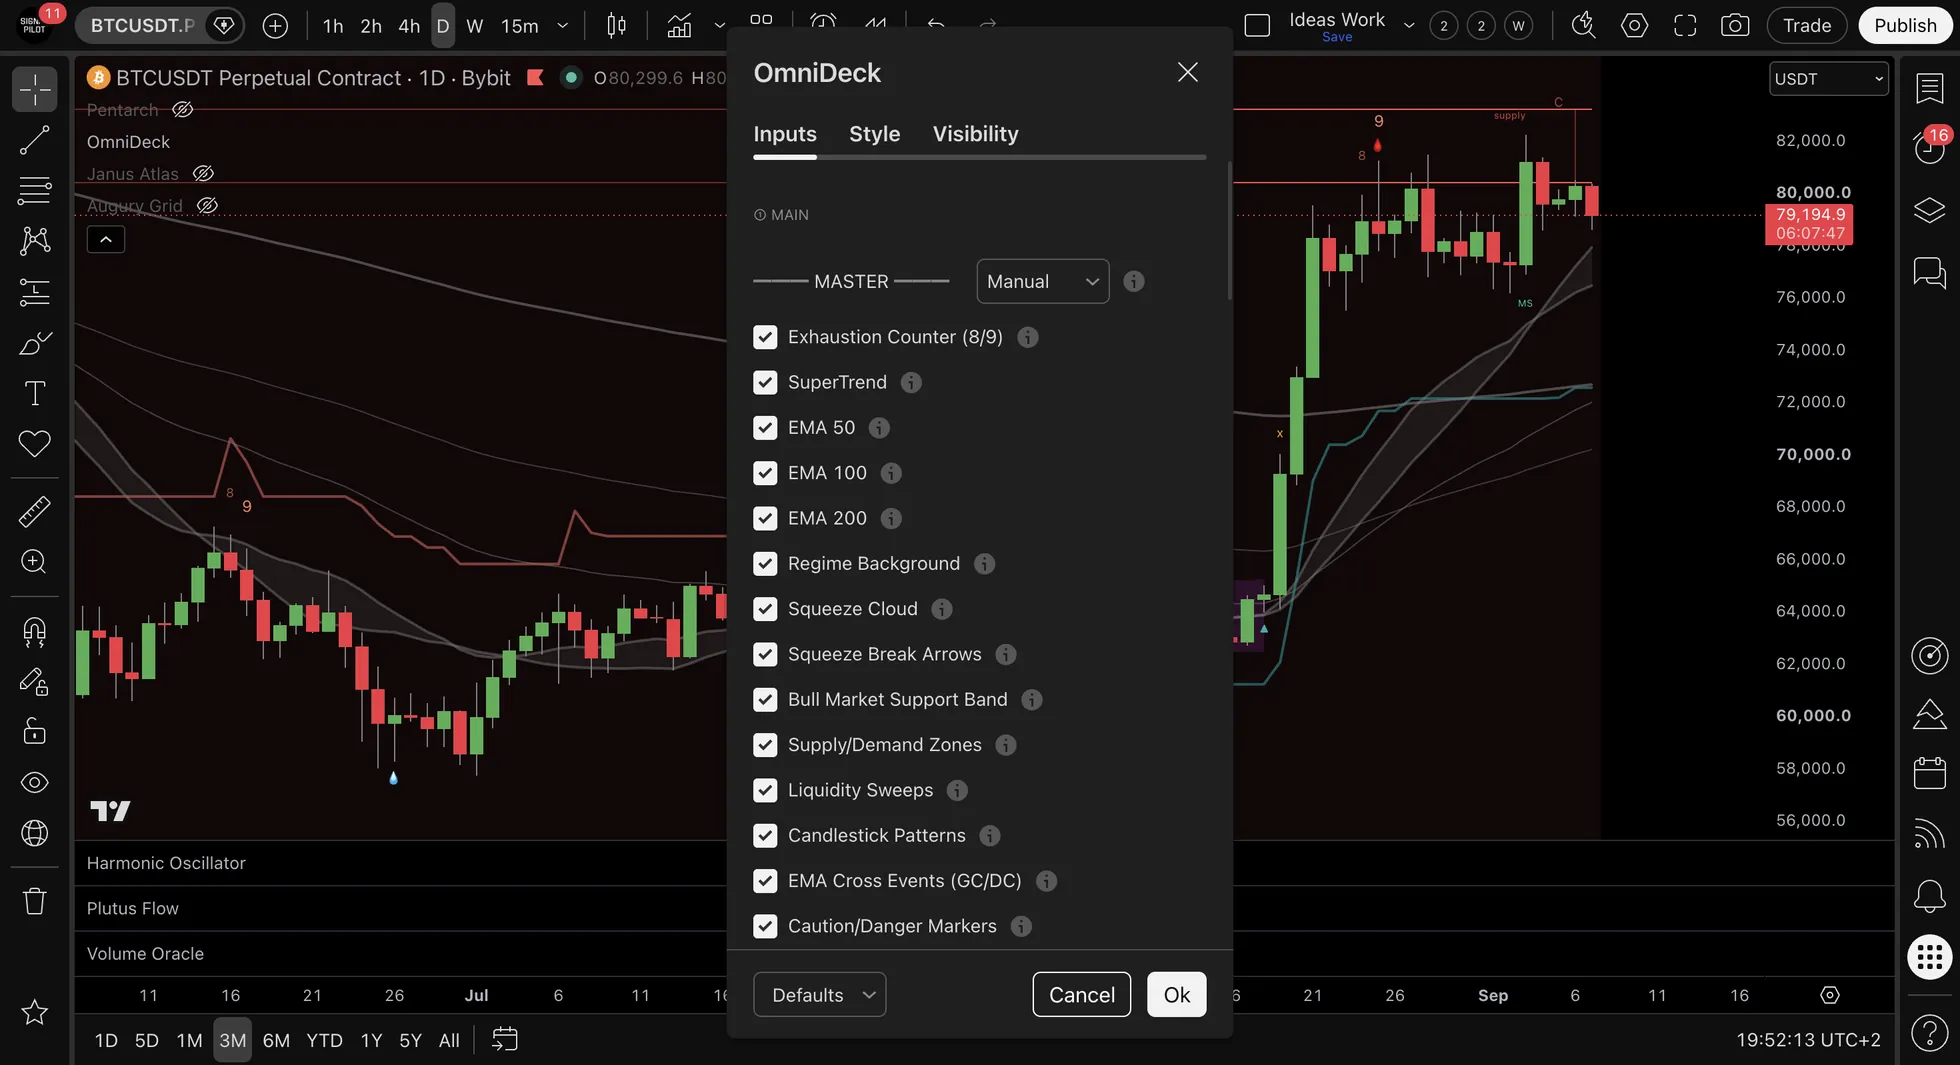
The Master Setting (Chart Overlays)
The first control in the Main settings group is a three-way choice, not a switch. It decides whether the fourteen individual toggles below it are read at all.
| Setting | Behaviour |
|---|---|
| All On | Draws every chart overlay, whatever the individual toggles say. |
| All Off | Hides every chart overlay: the counts, SuperTrend, the EMAs, zones, sweeps, patterns and the regime background. |
| Manual | The default. Each of the fourteen toggles below decides for itself. |
The Confluence Panel has its own separate toggle in the Confluence Panel settings group, so the master setting does not reach it. Setting the master to All Off while leaving that panel on gives you the score and nothing drawn on the chart.
System Toggle Options
| System | On/Off Toggle | Alert Available |
|---|---|---|
| Exhaustion Counter | ✓ | ✓ |
| Squeeze | ✓ | ✓ |
| Liquidity Sweeps | ✓ | ✓ |
| EMA Trio | ✓ | Cross alerts |
| SuperTrend | ✓ | Flip alerts |
| BMSB | ✓ | Touch alerts |
| Regime Box | ✓ | Change alerts |
| S/D Zones | ✓ | Break alerts |
| Candlestick Patterns | ✓ | ✓ |
| Meta Tools | Always on | - |
Default Settings
The Main group holds fourteen toggles. Six start on.
ON by default (6):
| Toggle | Description |
|---|---|
| Exhaustion Counter (8/9) | The sequential counts |
| SuperTrend | Adaptive trend ribbon |
| EMA 50 | One of the three moving averages, each with its own toggle |
| EMA 100 | The second of the three |
| EMA 200 | The third of the three |
| Regime Background | The tinted chart background |
OFF by default (8):
| Toggle | Description |
|---|---|
| Squeeze Cloud | The cloud drawn while compression holds |
| Squeeze Break Arrows | The arrow on release |
| Bull Market Support Band | The 20 SMA with the 21 EMA |
| Supply/Demand Zones | Key price zones |
| Liquidity Sweeps | Stop hunt detection |
| Candlestick Patterns | The sixteen-pattern RCS library |
| EMA Cross Events (GC/DC) | Golden and death cross markers |
| Caution/Danger Markers | The warning markers |
The Confluence Panel sits in its own settings group and is on by default. The squeeze is the one system whose two halves are separate toggles, so turning the cloud on does not turn the arrows on.
Each toggle is independent, so the set can be widened one system at a time.
Color Settings (Grouped by Function)
OmniDeck uses 9 color inputs grouped by analytical function, making it easier to recognize related signals at a glance:
| Group | Inputs | Systems Using It | Rationale |
|---|---|---|---|
| 📈📉 Trend | Bull / Bear | SuperTrend, Regime Background | The two systems that paint the chart with the direction they read |
| 🔄 Exhaustion | Bull / Bear | Exhaustion Counter, Candlestick Patterns, Liquidity Sweeps | Exhaustion/reversal systems that identify potential turning points |
| 🟥🟩 Structure | Supply / Demand | S/D Zones | Structure systems: Supply = potential resistance, Demand = potential support |
| 🔮 Squeeze | Single color | Squeeze Detection cloud | Volatility system: BB compression inside KC |
| ⚠️ Warning | Single color | Caution/Danger markers | Warning markers for momentum exhaustion |
| ⚪ Neutral | Single color | EMA lines (50/100/200), BMSB band, panel backgrounds | Non-directional structural elements that show price structure and reference levels |
Why Colors Are Grouped
OmniDeck groups colors by analytical function, not just bull/bear:
- Trend systems (SuperTrend, Regime Box) share the bull and bear colors: they paint the direction they read
- Exhaustion systems (EC, Patterns, Sweeps) share colors: they all detect potential turning points
- Structure systems (S/D Zones) have their own colors: red resistance, green support is intuitive
- The EMA lines and the BMSB band take the neutral color: they are reference lines, not a verdict on direction
When multiple signals appear in the same color family, you instantly know they're related. A teal Count 9 + teal Hammer + teal 💧 sweep = three exhaustion signals agreeing.
📊 A Worked Example: Four Systems Lining Up
(An illustration with round numbers, not a record of any real period. Educational only. Not financial advice.)
Systems switched on:
- Exhaustion Counter, Squeeze Detector, EMA Trio, Regime Box, Supply/Demand Zones
What happens, bar by bar:
| Bar | Price | What the systems show | How to read it |
|---|---|---|---|
| Bar 1 | $60,000 | Regime Box red | The background says bearish, so the bias is down |
| Bar 6 | $58,000 | Exhaustion Counter prints a green 9 | Nine bars of decline; the fall may be running out |
| Bar 8 | $57,500 | Price reaches an A-grade demand zone | The count lands on structure rather than in open space |
| Bar 12 | $58,500 | Squeeze Detector fires a teal ▲ | Compression breaks upward |
| Bar 16 | $60,000 | Regime Box flips green | The background agrees with the move |
| Bar 24 | $62,000 | The move continues | $4,500 above the low at bar 8 |
What made this a confluence:
- A green 9 marks exhaustion, the demand zone gives it a place to happen, and the squeeze arrow gives it timing
- The regime flip comes after the move, not before it: it confirms rather than predicts
- Four of the five switched-on systems pointed the same way at the same level
The arithmetic: from $57,500 at bar 8 to $62,000 at bar 24 is $4,500, or 7.8% of the low.
This shows what agreement between systems looks like. It is not a claim about how often that agreement is followed by a move.
🔢 The 10 Systems Explained Intermediate
System 1: Exhaustion Counter
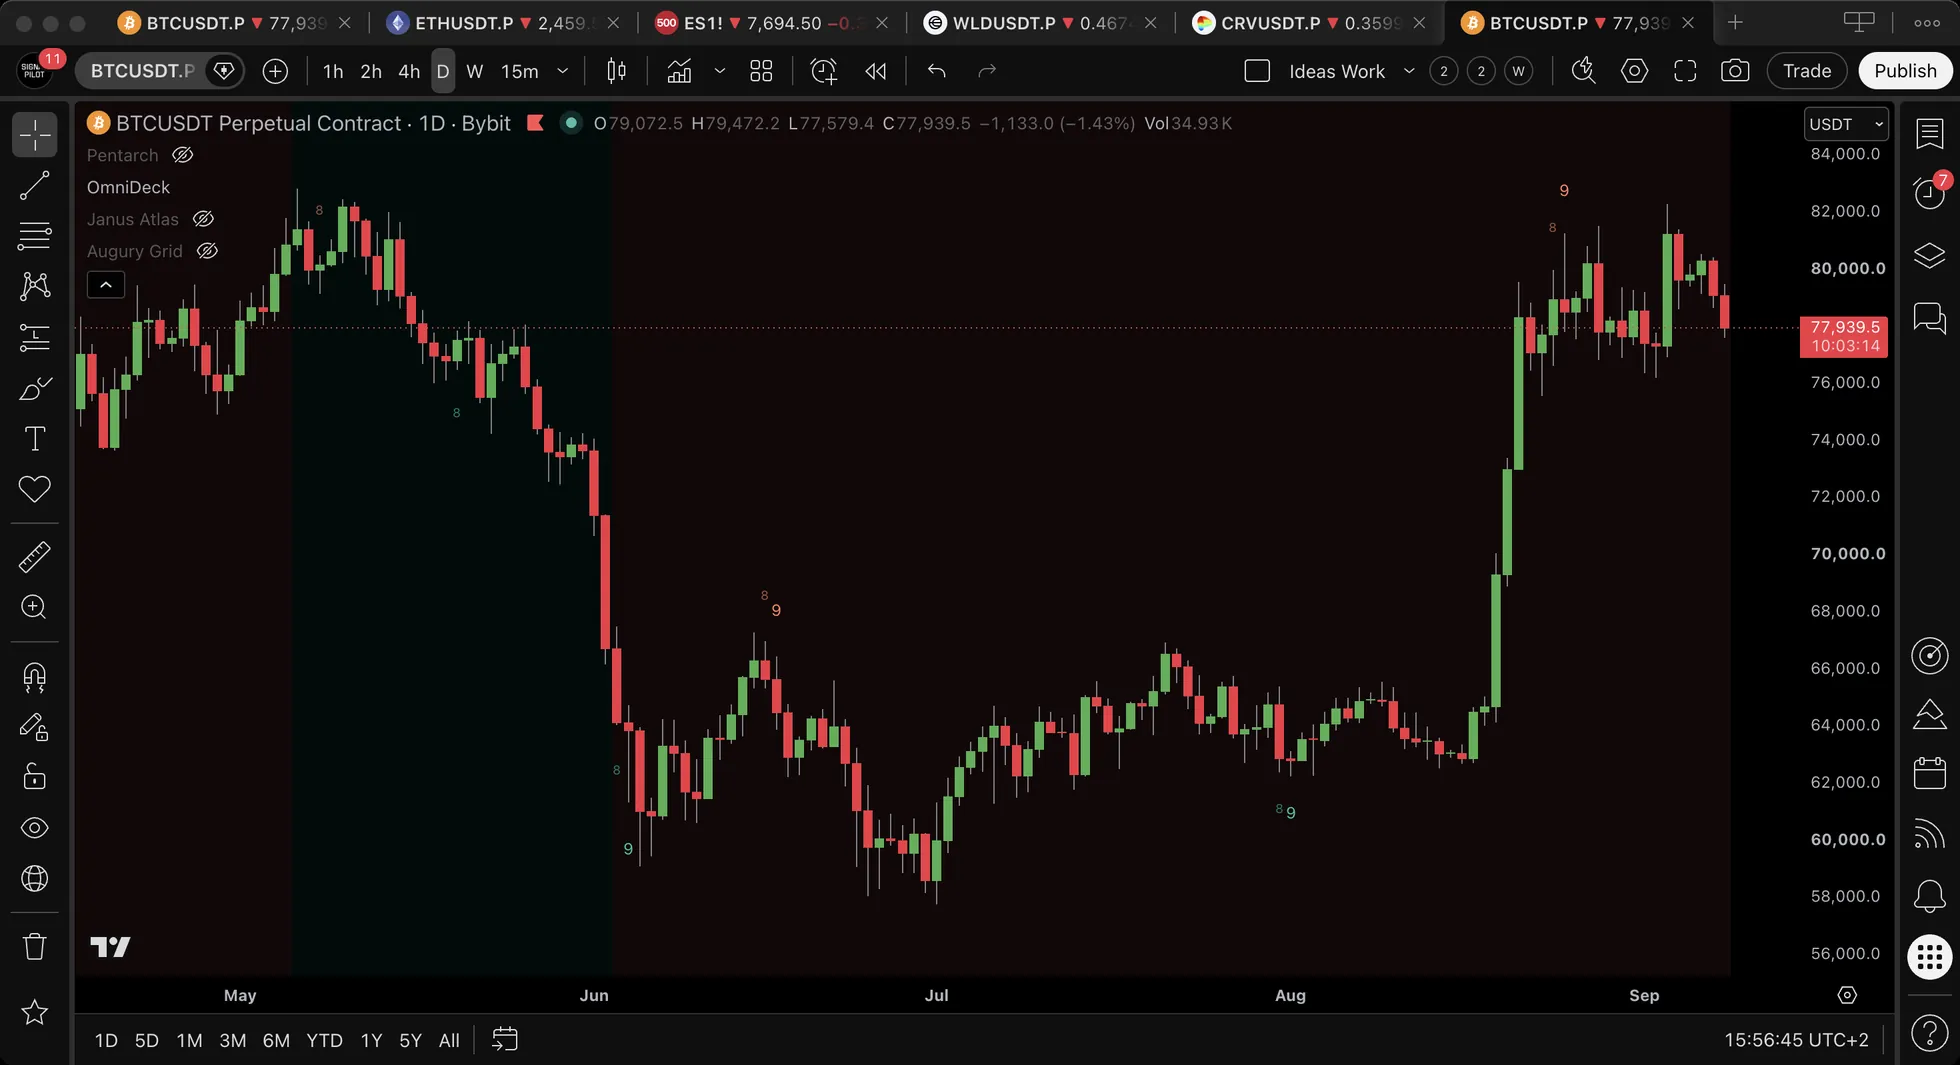
Visual Display:
- Green numbers 1-9 below bars (downtrend exhaustion)
- Red numbers 1-9 above bars (uptrend exhaustion)
How It Works:
- Counts consecutive closes in one direction
- At count 9, exhaustion conditions indicated
- Counter resets when direction changes
Signal Interpretation:
- Green 9 = Extended decline, potential reversal up
- Red 9 = Extended advance, potential reversal down
Example: Price falling for 9 bars, Green 9 appears at $100 → Oversold exhaustion detected.
System 2: Squeeze: Breakout Detector
Visual Display:
- Red dots on candles = Volatility compression
- Teal ▲ arrow = Bullish breakout
- Red ▼ arrow = Bearish breakdown
How It Works:
- Monitors Bollinger Bands vs Keltner Channels
- Red dots = Bands inside Channels (squeeze forming)
- Arrow fires when bands expand (breakout)
Signal Interpretation:
- Multiple red dots (3-5+) = Larger move potential
- Teal ▲ arrow = Bullish breakout direction
- Red ▼ arrow = Bearish breakdown direction
Example: 5 red dots accumulate, teal ▲ arrow fires at $102 → Bullish breakout detected.
System 3: Liquidity Sweeps: Stop Hunt Detection
Visual Display:
- 💧 Water droplet (below candle) = Bull Sweep - liquidity grabbed below, reversal up expected
- 🩸 Blood drop (above candle) = Bear Sweep - liquidity grabbed above, reversal down expected
Clean visual design - just the emoji marker with small ATR-based offset (no overlapping with candles).
How It Works:
- Scans 12-bar lookback for recent highs/lows
- Triggers when price breaks the level then closes back inside
- Requires rejection wick ≥55% of candle range (filters out weak signals)
- Non-repainting (confirmed bars only)
Interpretation:
- 💧 Bull Sweep → Bullish reversal indication (stop hunt completed below)
- 🩸 Bear Sweep → Bearish reversal indication (fake breakout above)
Example: Price drops to $98 (💧 appears), immediately bounces to $102 → Stop hunt pattern detected.
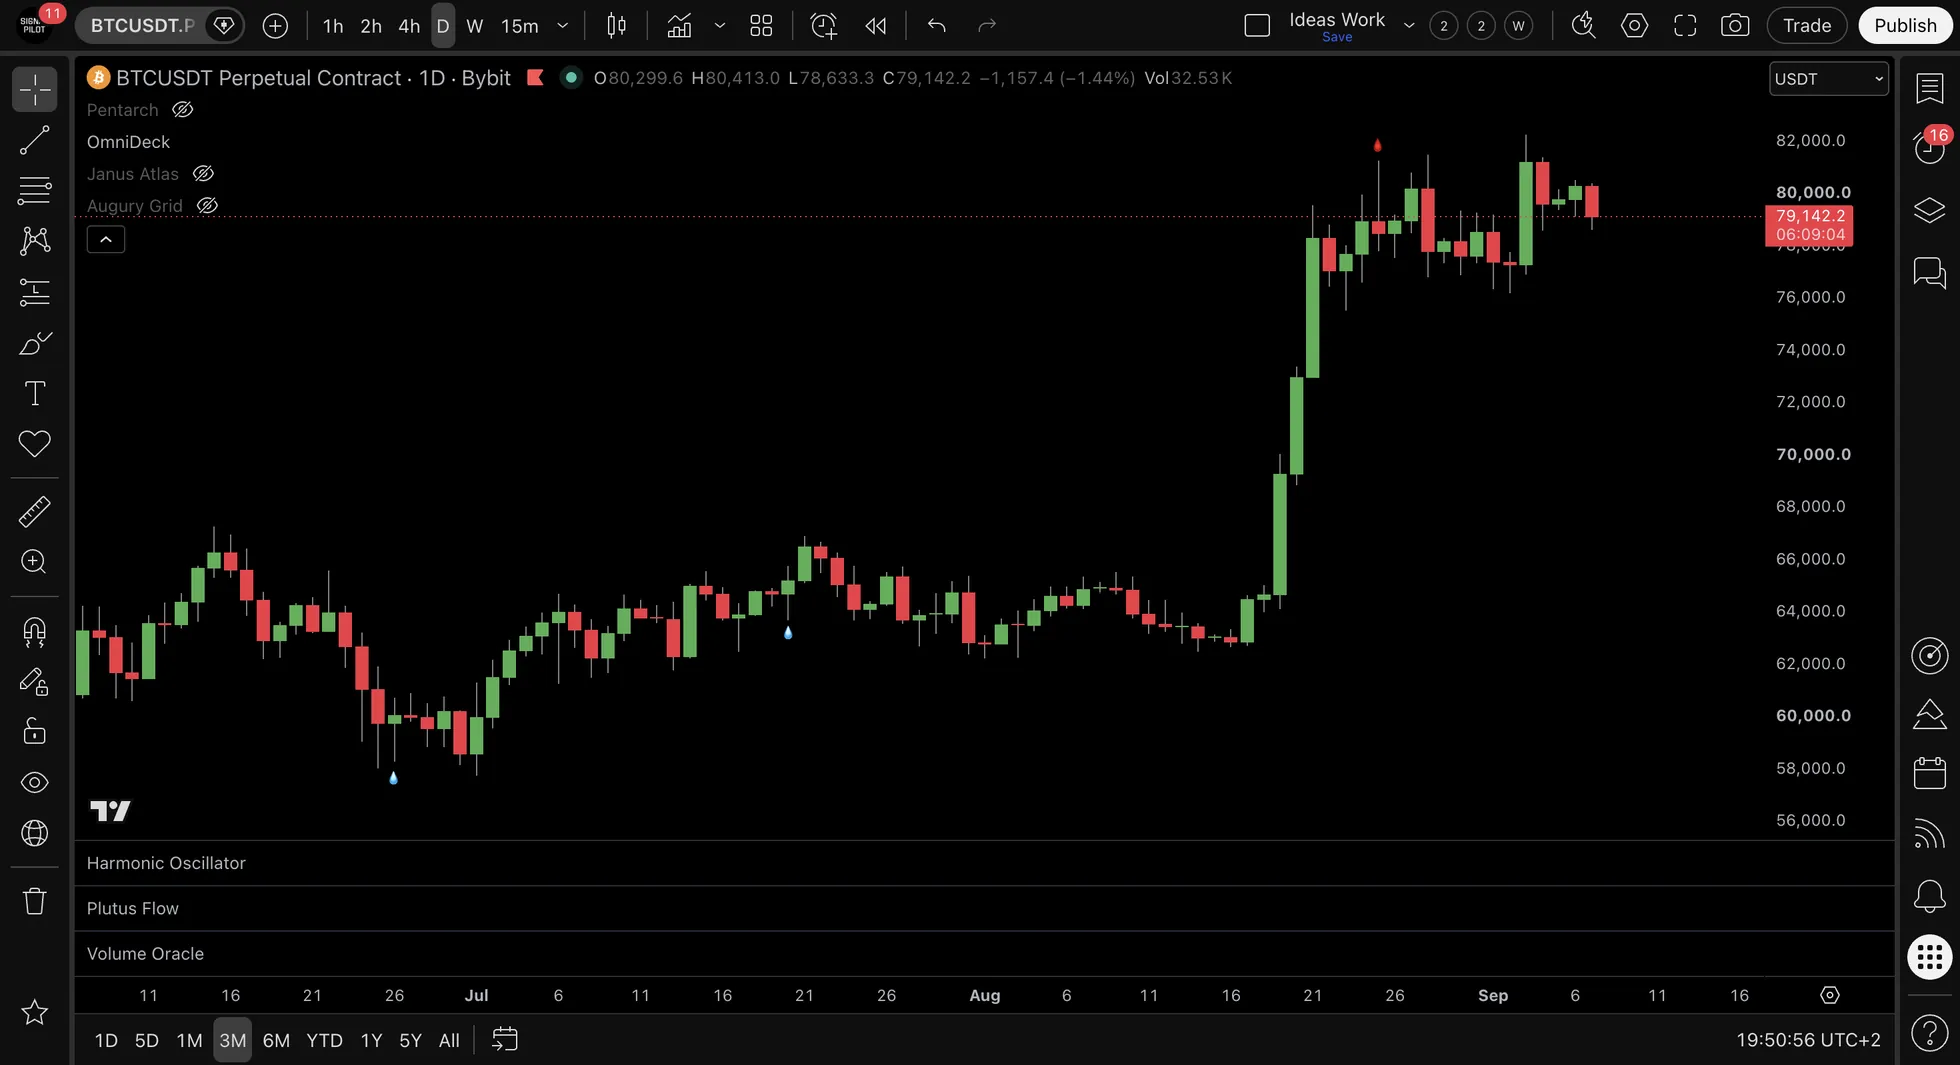
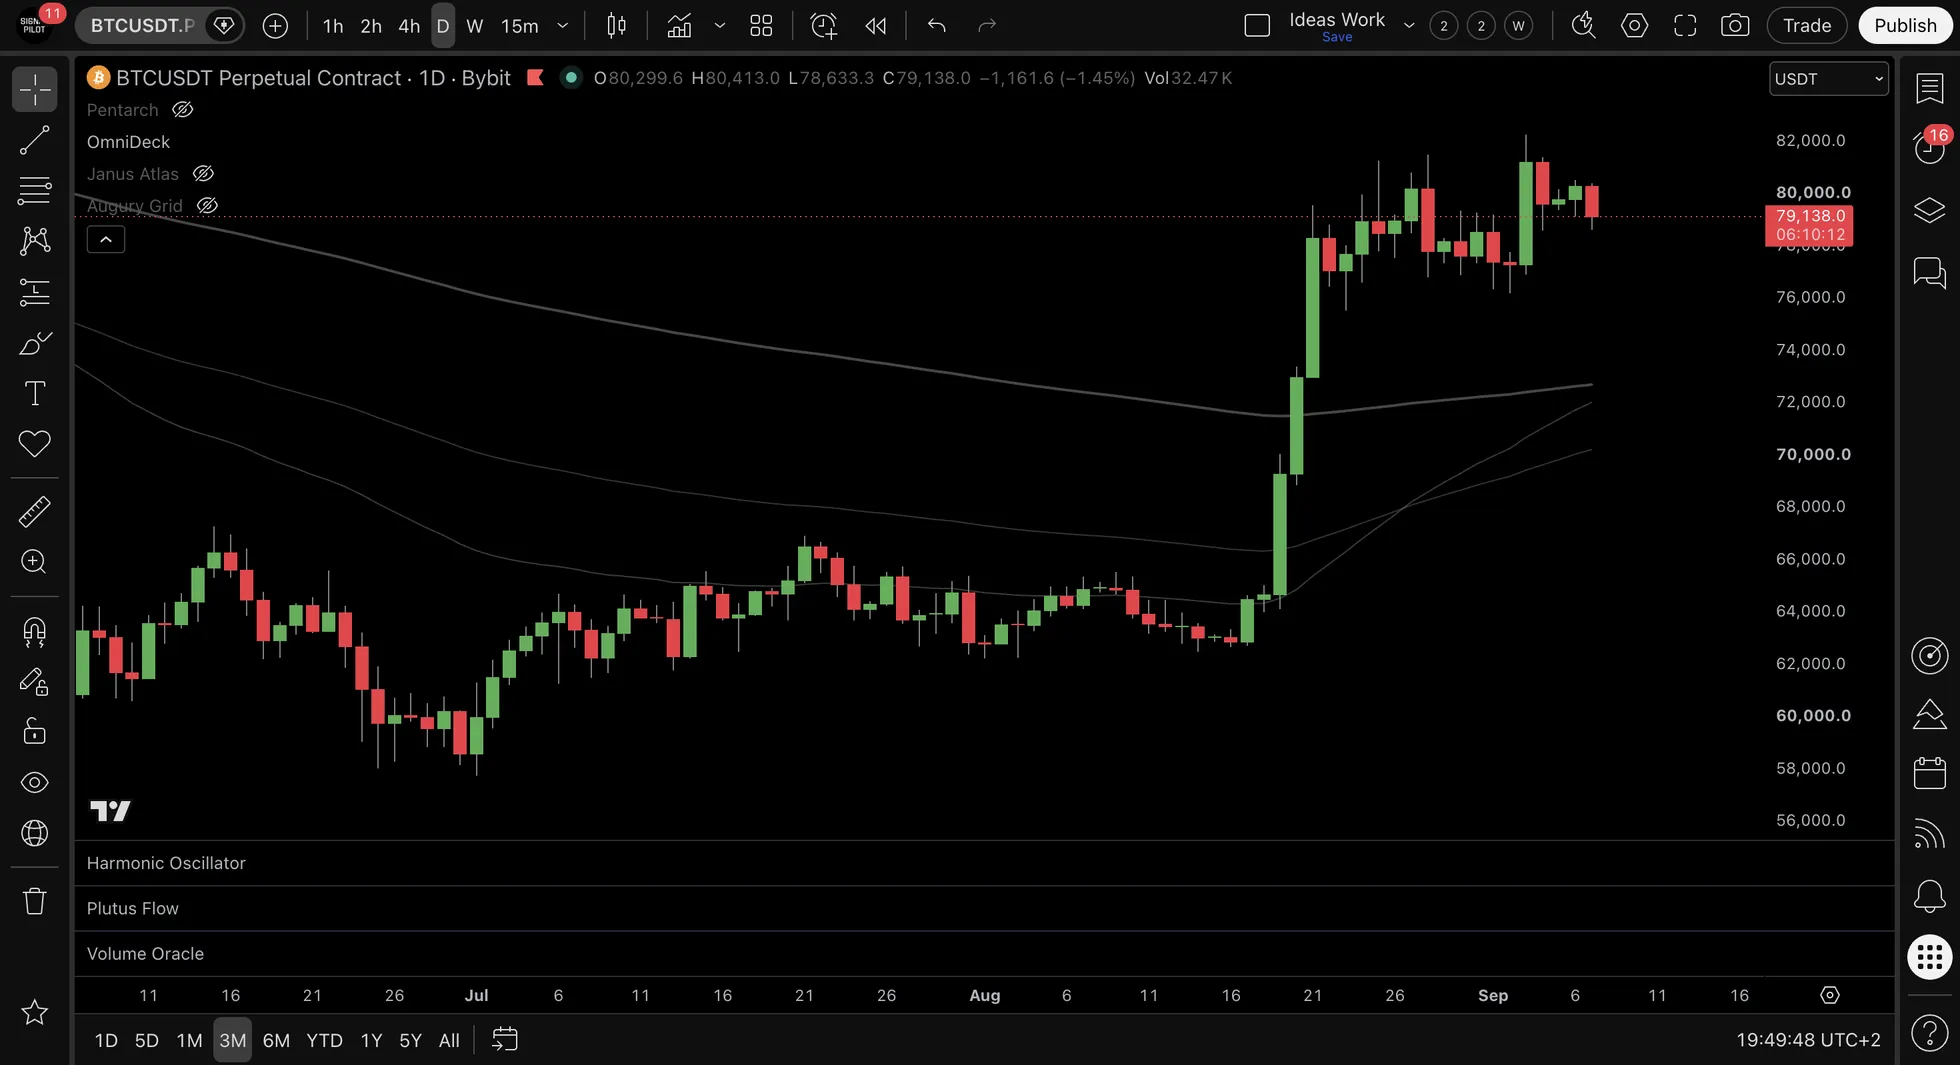
System 4: EMA Trio: Moving Averages
Visual Display:
- Three lines: EMA 50 (fast), EMA 100 (medium), EMA 200 (slow)
Signals Generated:
- GC (Golden Cross) = Fast crosses above slow (bullish)
- DC (Death Cross) = Fast crosses below slow (bearish)
- PB (Pullback) = Price touches EMA then bounces
Signal Interpretation:
- Price above all EMAs = Uptrend structure
- Price below all EMAs = Downtrend structure
- EMA alignment (50>100>200) = Strong trend
Example: Price above all 3 EMAs with 50>100>200 → Bullish trend structure.
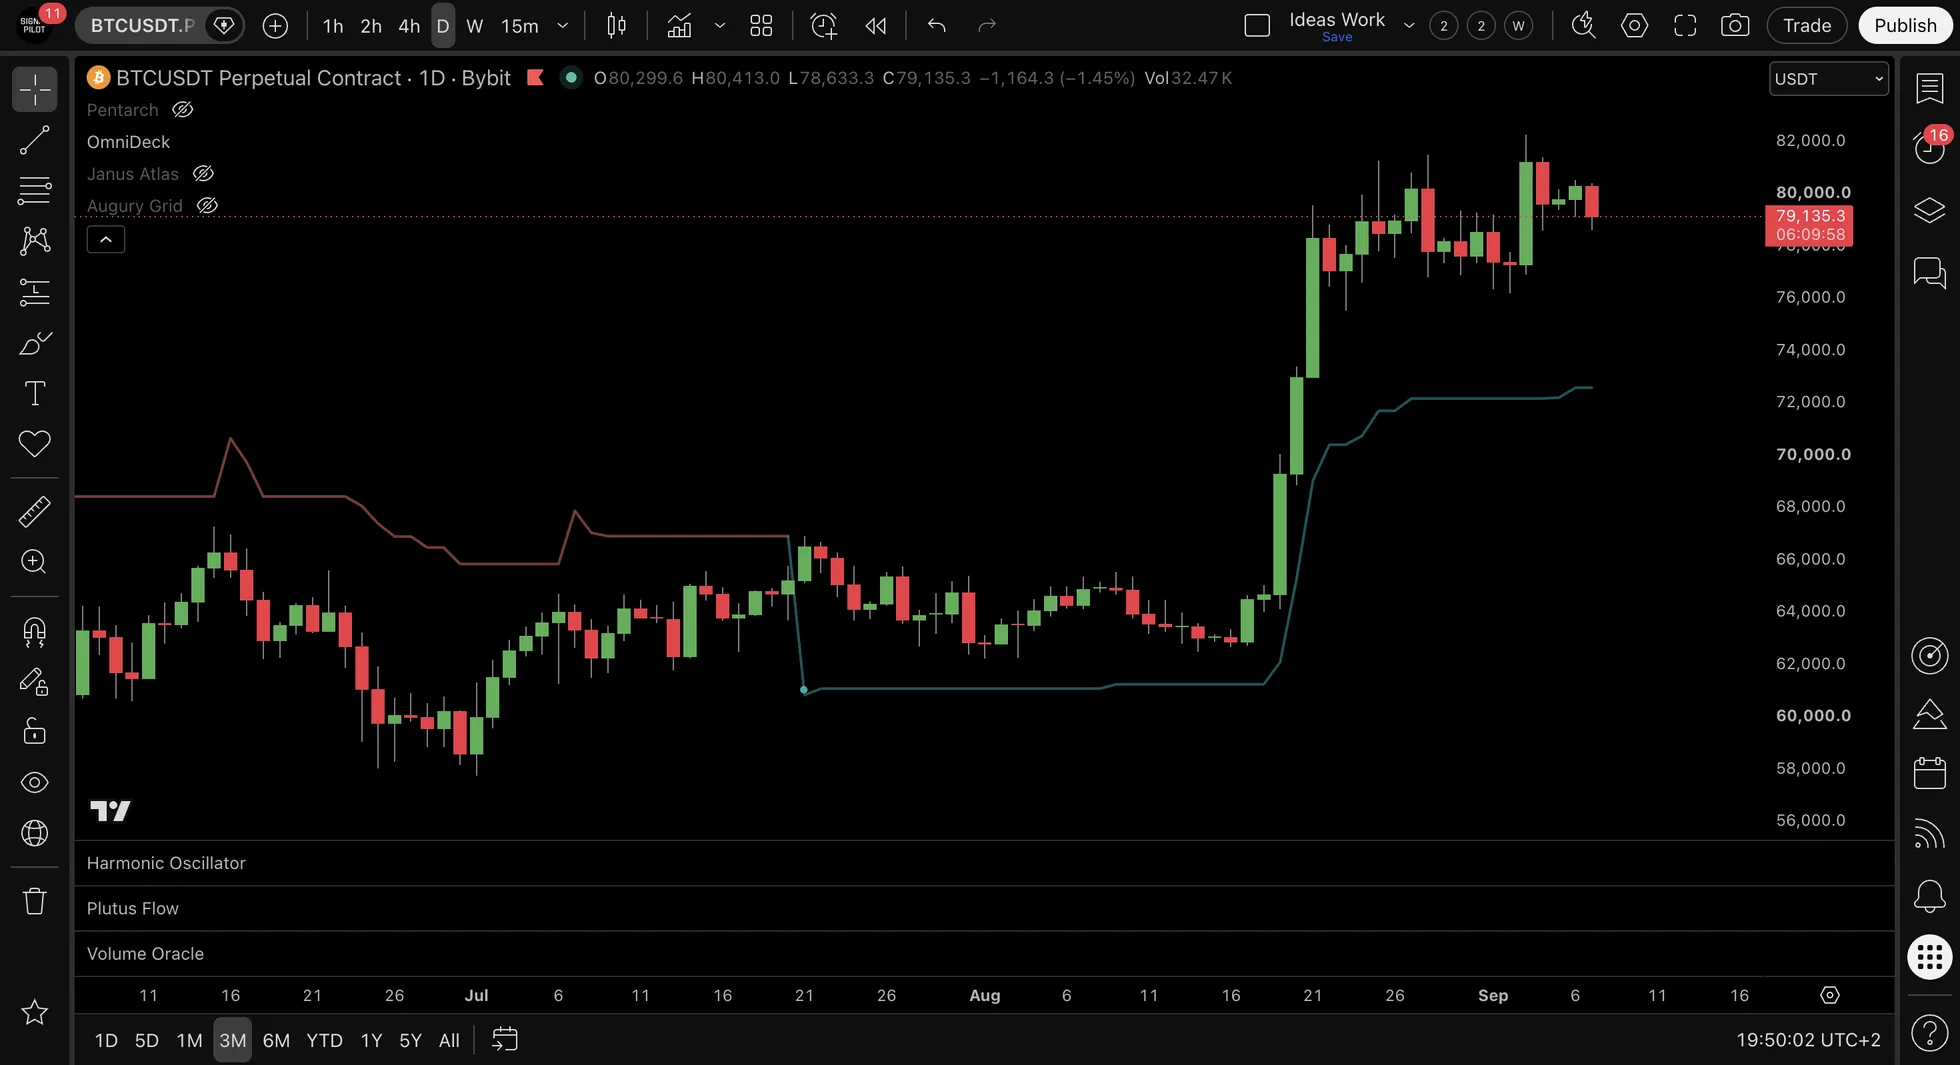
System 5: SuperTrend: Trend Ribbon
Visual Display:
- Green ribbon = Bullish trend identified
- Red ribbon = Bearish trend identified
How It Works:
- ATR-based trend following system
- Ribbon color indicates current trend direction
Signal Interpretation:
- Green ribbon = Bullish trend conditions
- Red ribbon = Bearish trend conditions
- Ribbon flips = Trend change indication
Example: Green ribbon + Count 9 green = Oversold in uptrend (potential support confluence).
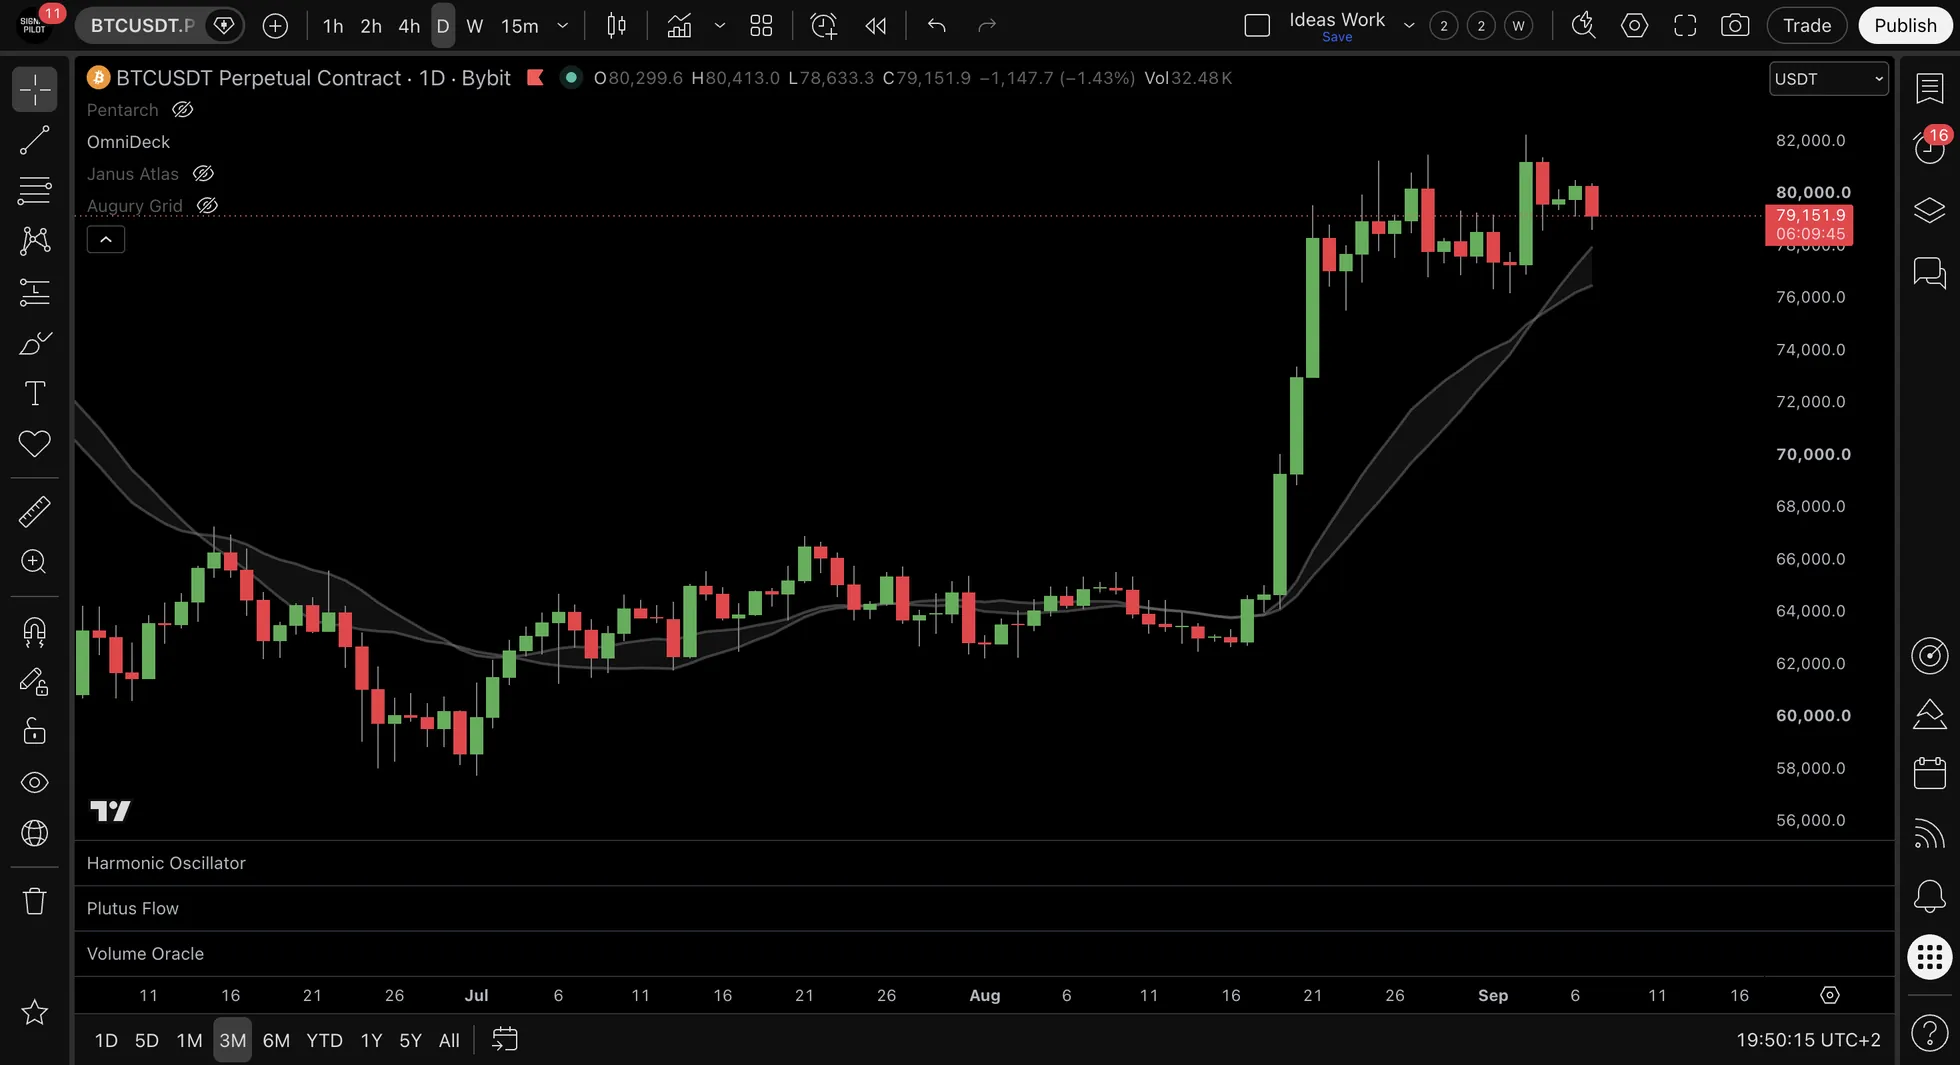
System 6: BMSB: Bull Market Support Band
Visual Display:
- Two close lines: 20 SMA + 21 EMA
How It Works:
- Acts as dynamic support zone in uptrends
- Combination of SMA and EMA creates "band"
Signal Interpretation:
- Uptrend + price touches BMSB = Potential bounce zone
- Price breaks below BMSB = Trend weakening indication
Example: Stock in uptrend pulls back to BMSB at $105, bounces → Support band held.
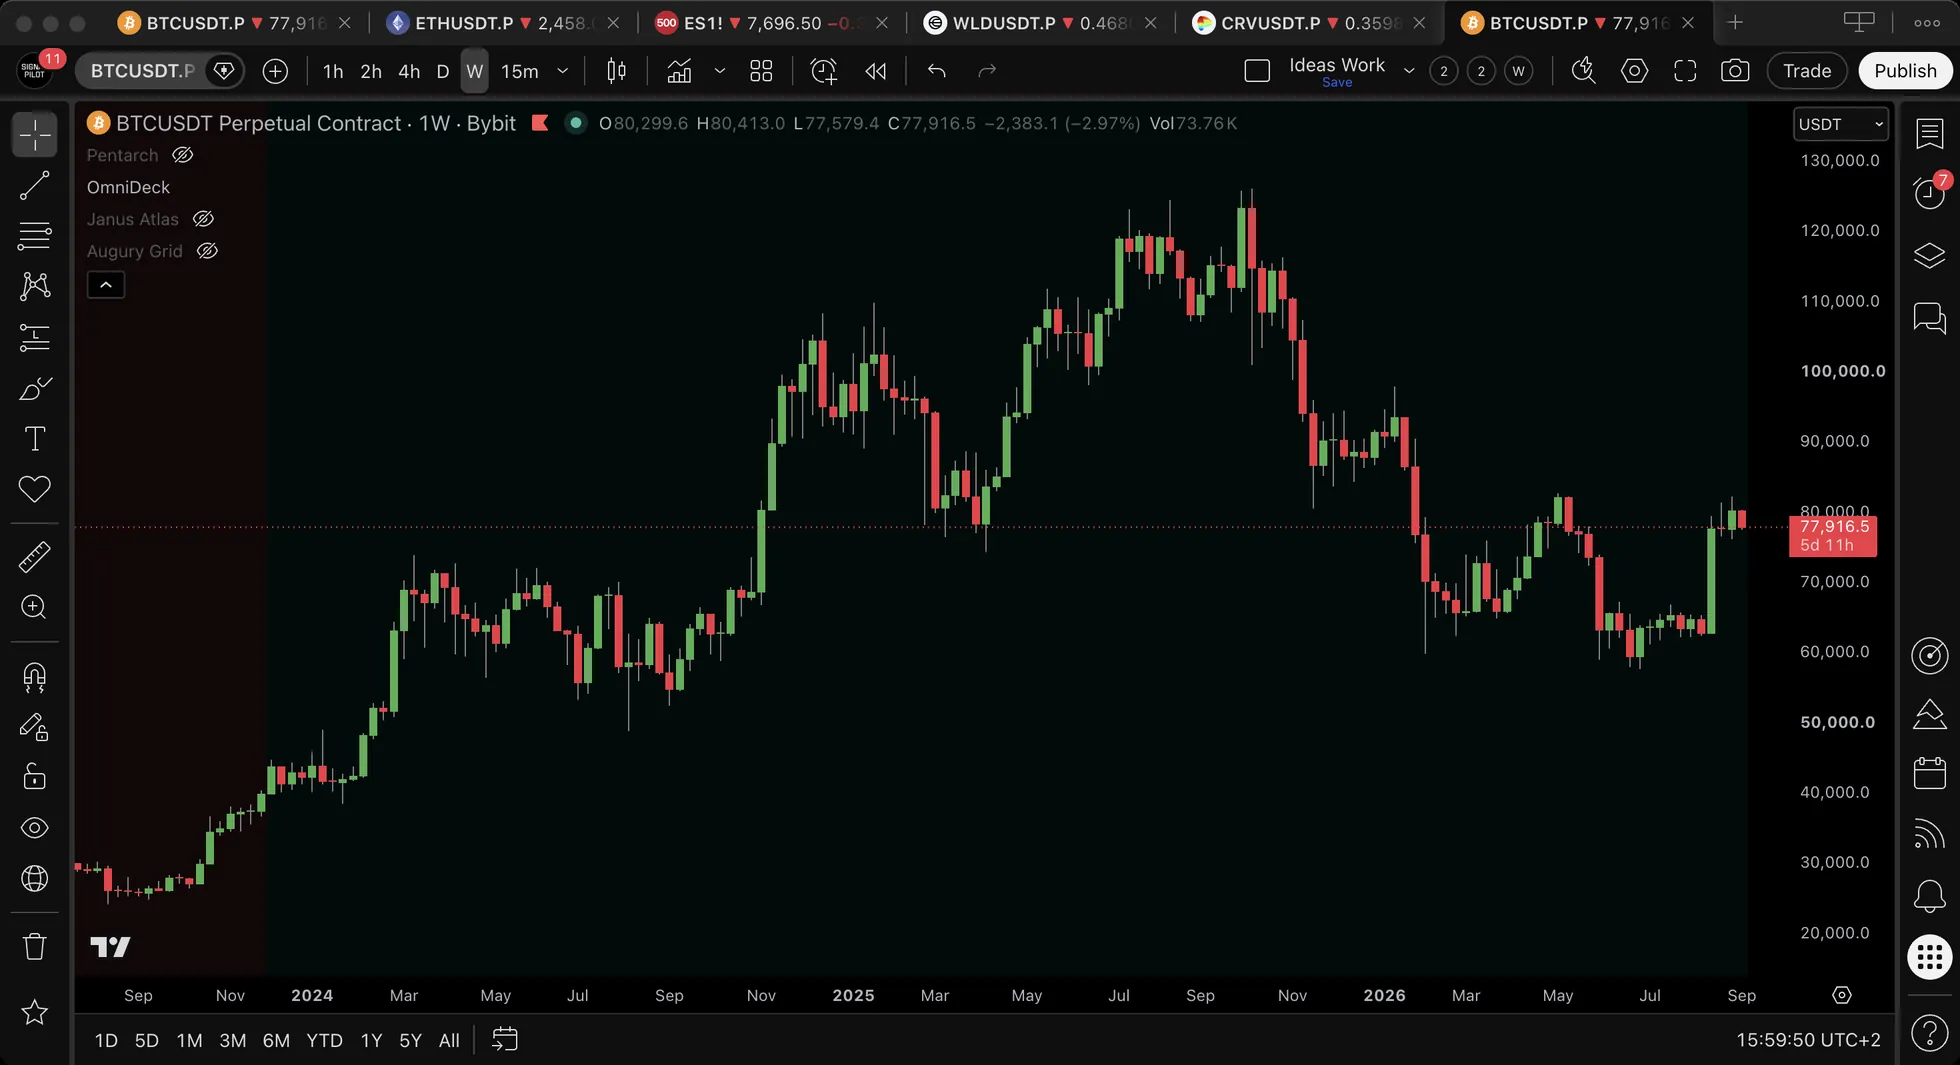
System 7: Regime Box: Market Mood Background
Visual Display:
- Green background = Bullish regime detected
- Red background = Bearish regime detected
- Gray background = Neutral/choppy conditions
How It Works:
- Analyzes multiple factors to determine market regime
- Background color provides bias filter
Signal Interpretation:
- Green background = Bullish regime conditions
- Red background = Bearish regime conditions
- Gray background = Selective approach conditions
Example: Regime green + Squeeze arrow up = Maximum conviction setup characteristics.
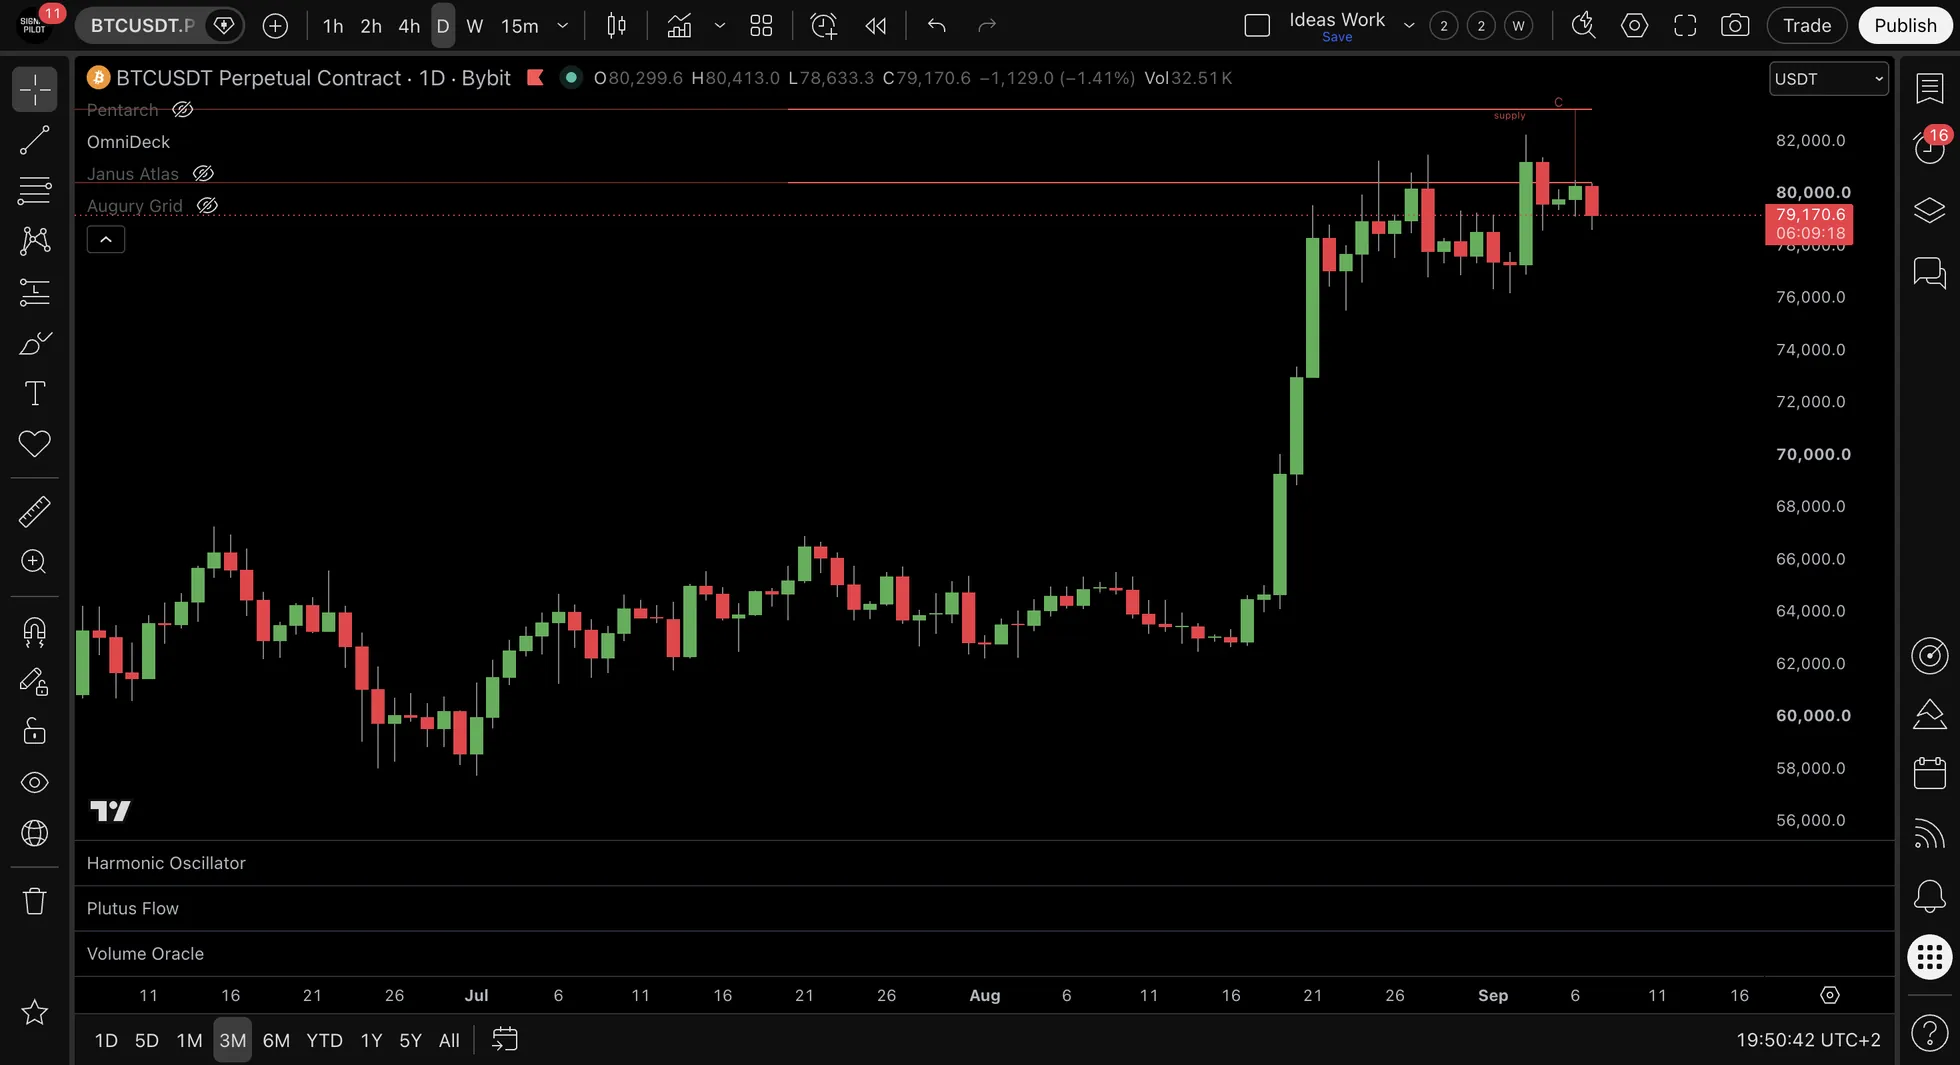
System 8: Supply/Demand Zones: Key Levels
Visual Display:
- Green boxes = Demand zones (potential support)
- Red boxes = Supply zones (potential resistance)
- A badge on each box carries the zone score. By default it is a letter grade, A, B or C; the Badge Style setting can switch it to a number from 0 to 10
How It Works:
- Identifies areas where significant accumulation/distribution occurred
- The score counts volume, momentum and how long the zone has stood
Signal Interpretation:
- An A grade is the top band of that score; C is the bottom
- Price at zone = Reaction point observation
- Zone break = Level invalidation
Example: Price drops into an A-grade demand zone at $100 and the bar closes as a hammer. Two readings on one bar: the zone grade and the candle shape.
System 9: Candlestick Patterns: 16 Classic Patterns (RCS Pattern Library)
Visual Display:
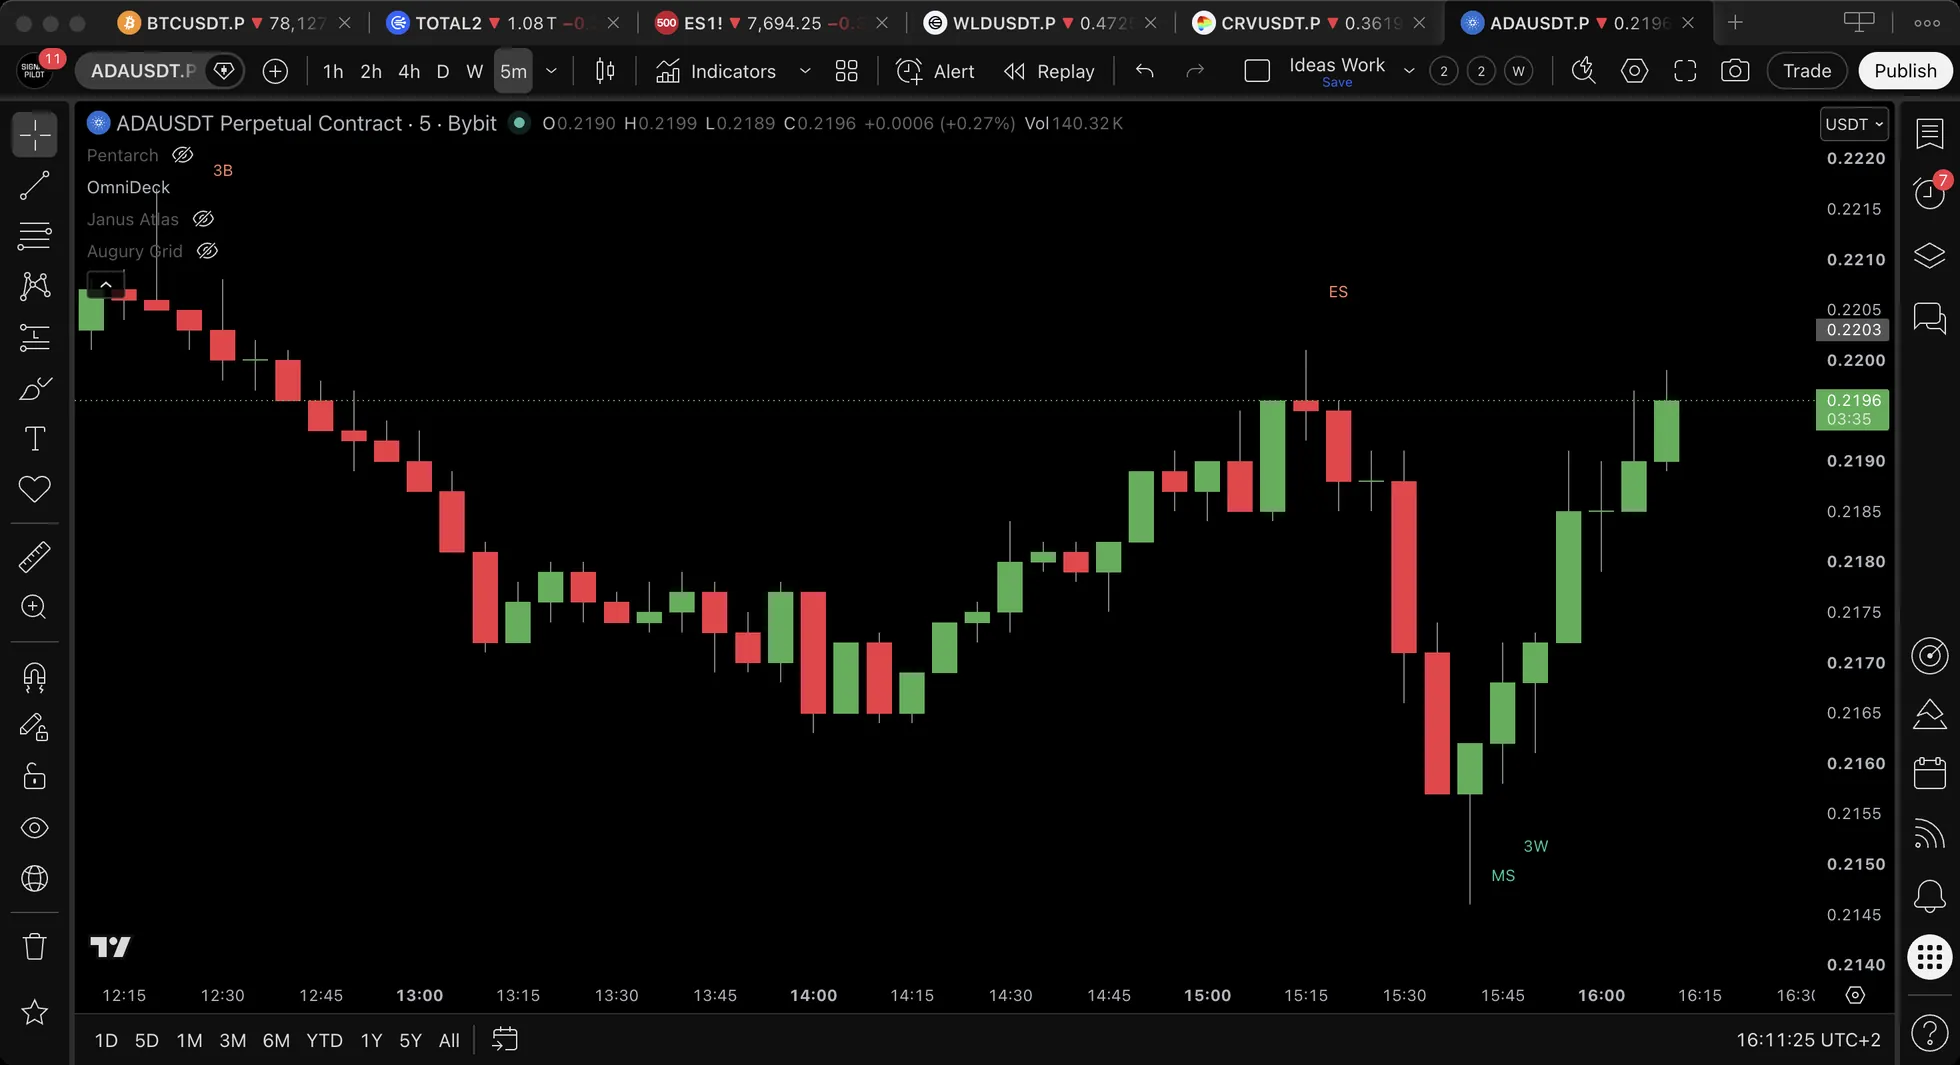
- Labels like "HAM" (Hammer), "BUE" (Bull Engulfing), "SS" (Shooting Star)
RCS Pattern Library:
16 classic reversal patterns identified automatically with on-chart labels:
Complete RCS Pattern Reference
| Pattern | Label | Type | Description |
|---|---|---|---|
| Hammer | HAM | 🟢 Bullish | Long lower wick, small body at top |
| Inverted Hammer | IH | 🟢 Bullish | Long upper wick, small body at bottom (bullish context) |
| Bull Engulfing | BUE | 🟢 Bullish | Green candle fully engulfs prior red |
| Bull Harami | BUH | 🟢 Bullish | Small green inside prior large red |
| Rising Three Methods | R3M | 🟢 Bullish | Continuation: 3 small reds inside large green range |
| Three White Soldiers | 3WS | 🟢 Bullish | Three consecutive rising green candles |
| Morning Star | MS | 🟢 Bullish | Red → small body gap down → green closes above midpoint |
| Tweezer Bottom | TWB | 🟢 Bullish | Two candles with matching lows at support |
| Hanging Man | HGM | 🔴 Bearish | Long lower wick, small body at top (bearish context) |
| Shooting Star | SS | 🔴 Bearish | Long upper wick, small body at bottom |
| Bear Engulfing | BEE | 🔴 Bearish | Red candle fully engulfs prior green |
| Bear Harami | BEH | 🔴 Bearish | Small red inside prior large green |
| Falling Three Methods | F3M | 🔴 Bearish | Continuation: 3 small greens inside large red range |
| Three Black Crows | 3BC | 🔴 Bearish | Three consecutive falling red candles |
| Evening Star | ES | 🔴 Bearish | Green → small body gap up → red closes below midpoint |
| Tweezer Top | TWT | 🔴 Bearish | Two candles with matching highs at resistance |
The Pattern Lookback
What it does: The pattern lookback is set from the chart timeframe rather than by a setting. There is no input for it. The window is widest on the fastest charts and narrowest above Daily, but it is not a straight line: it dips at 1 hour and widens again at 4 hours.
| Timeframe | Lookback bars |
|---|---|
| ≤5 min | 50 |
| ≤15 min | 40 |
| ≤1 hour | 30 |
| ≤4 hour | 40 |
| ≤Daily | 30 |
| Above Daily | 20 |
Signal Interpretation:
- Pattern at zone + other confirmations = Enhanced setup
- Pattern alone = Lower confidence
- Pattern + confluence = Higher confidence
Example: Shooting Star at supply zone + Count 9 red = Multiple bearish indications.
System 10: Meta Tools: Integration Layer
What It Does:
- Behind-the-scenes system coordination
- Keeps overlapping labels and zones from drawing on top of each other
- Optimizes performance with multiple systems active
Functionality:
- Prevents visual collisions between systems, not disagreements between them
- Manages display priorities
- Coordinates alert timing
Example: When all systems align (Regime + EC + Squeeze + Zone + Pattern) = Elite confluence characteristics.
Remember: More systems agreeing doesn't always mean better: sometimes 3 strong confirmations outweigh 7 weak ones. Prioritize quality alignment (momentum + structure + timing) over quantity of active systems.
✅ Knowledge Check
Question: How many distinct analysis systems does OmniDeck integrate into one indicator?
📚 Analysis Framework Advanced
Hierarchical Analysis Approach
Common Evaluation Order:
Step 1: Regime Box (Directional Bias)
- Check background color
- Green = Bullish context
- Red = Bearish context
- Gray = Selective conditions
Step 2: Trend Structure (EMA Trio / BMSB / SuperTrend)
- Identify trend direction
- Check EMA alignment
- Verify BMSB/SuperTrend confirmation
Step 3: Entry Timing (EC / Squeeze / Sweeps)
- Look for exhaustion (Count 9)
- Check for breakout (Squeeze arrow)
- Monitor liquidity sweeps (💧/🩸 emojis)
Step 4: Zone Confirmation (Supply/Demand + Patterns)
- Check whether the signal sits inside a zone, and what grade the badge carries
- Look for candlestick pattern confluence
- Higher confluence at A-grade zones
Example Analysis Sequence
1. Regime = Green (bullish bias)
2. Price above BMSB (uptrend confirmed)
3. Count 9 green (oversold)
4. Squeeze arrow fires up (breakout)
5. At an A-grade demand zone (the top band of the zone score)
= High confluence setup characteristics
Analysis framework provides structure. Individual application varies.
✅ Knowledge Check
Question: What is the recommended number of OmniDeck systems to start with during the first 1-2 weeks?
🔔 Alert Configuration Beginner Friendly
Available Alerts:
| System | Alerts | Names as TradingView lists them |
|---|---|---|
| Exhaustion Counter | 4 | EC8B, EC9B, EC8S, EC9S |
| Squeeze | 3 | SQZ_ACTIVE, SQZ_BREAK_UP, SQZ_BREAK_DN |
| SuperTrend | 2 | ST_BULL, ST_BEAR |
| Meta Tools | 2 | CAUTION, DANGER |
| Liquidity Sweeps | 2 | SWEEP_BULL, SWEEP_BEAR |
| EMA Trio | 2 | GOLDEN_CROSS, DEATH_CROSS |
| S/D Zones | 2 | SDZ_SUPPLY_BROKEN, SDZ_DEMAND_BROKEN |
| BMSB | 2 | BMSB_CROSS_UP, BMSB_CROSS_DN |
| RCS Patterns | 16 | RCS_HAMMER … RCS_TWEEZER_TOP |
| RCS, either direction | 2 | RCS_ANY_BULL, RCS_ANY_BEAR |
| Confluence | 1 | HIGH_CONFLUENCE |
38 alerts in total. Most of that count is the pattern library: the sixteen RCS patterns each get their own alert, plus one for any bullish pattern and one for any bearish. The Regime Box is the one system with no alert of its own; its state reaches you through the Confluence score instead.
Alert Setup:
- Each system has independent alert toggles
- Multiple alerts can be enabled simultaneously
- Alerts fire once per signal occurrence
📊 Confluence Score Panel
The Confluence Score Panel gives you, at a glance, how much weight is behind one direction. It is not a headcount: each system carries its own weight, and the nine that count can put 11.0 on a side.
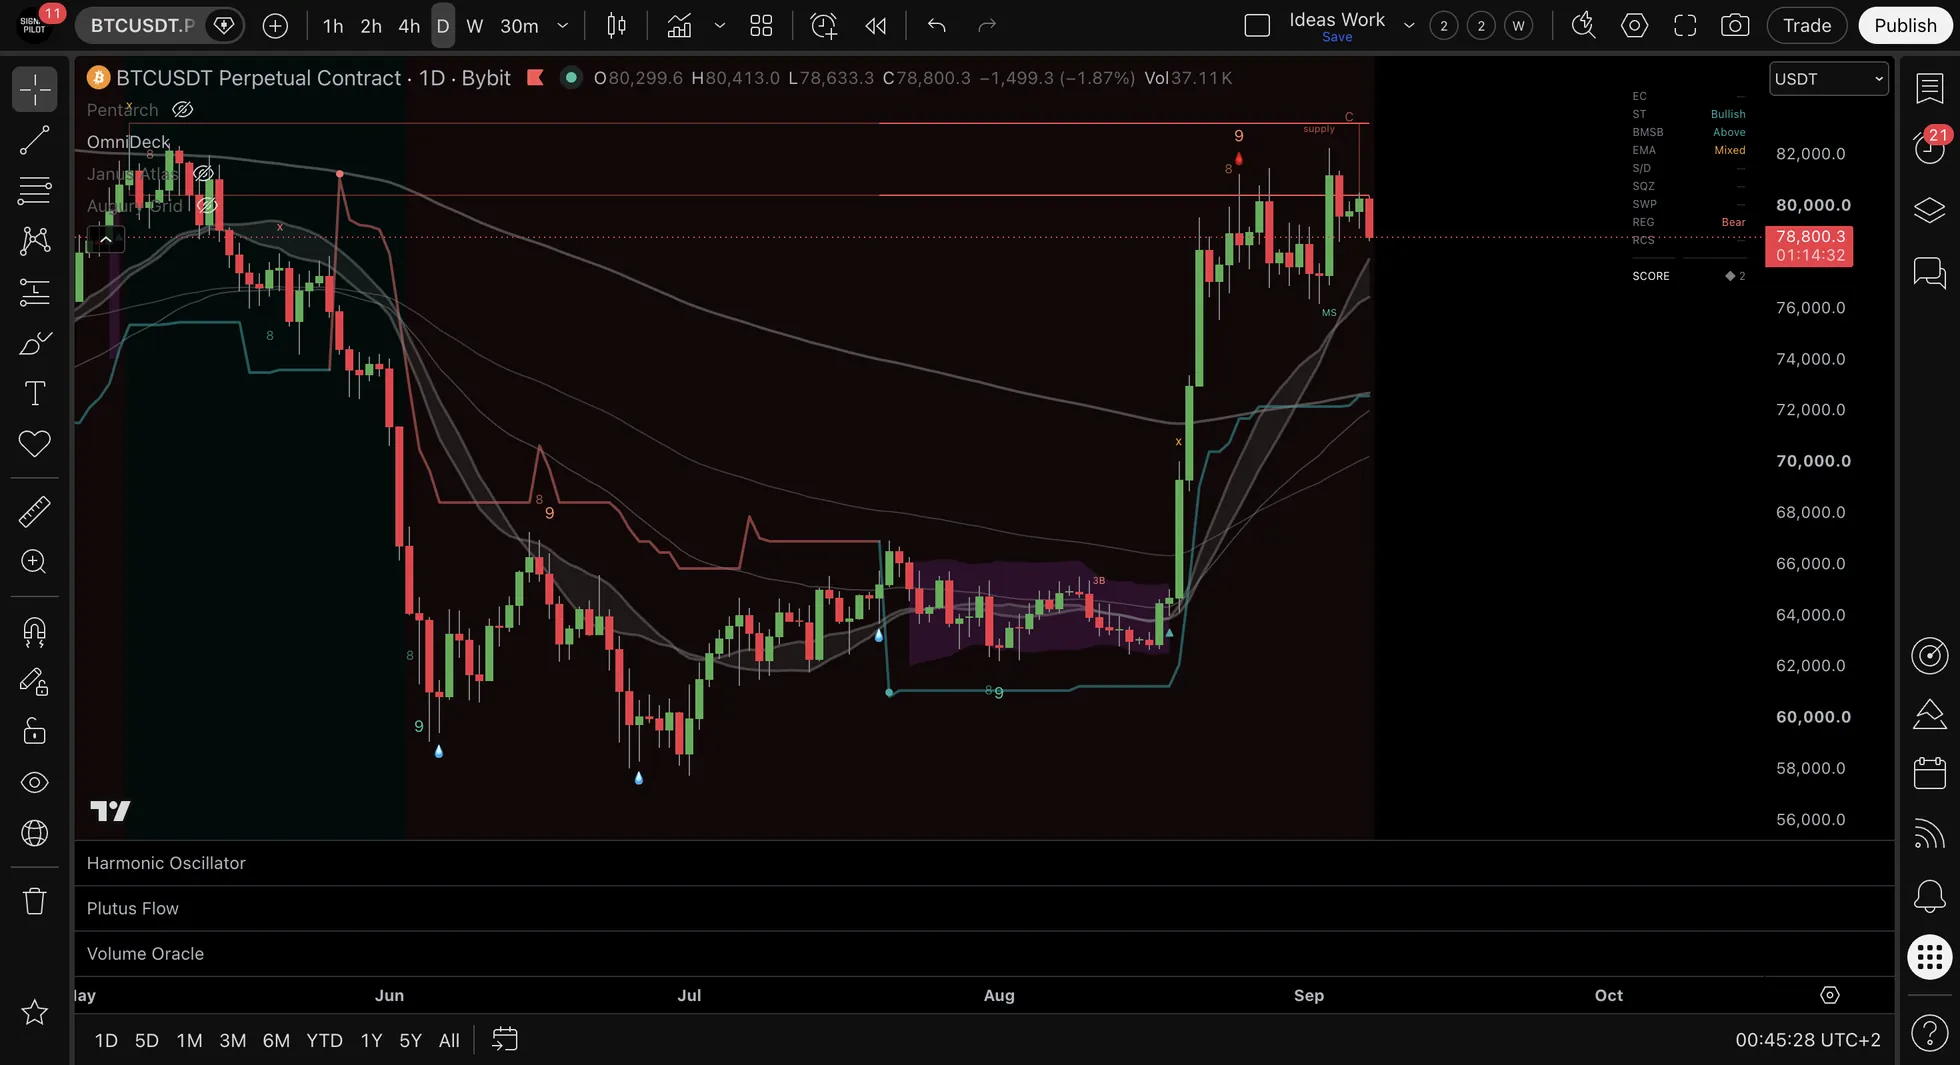
Display Modes
| Mode | Display | Best For |
|---|---|---|
| Badge | An arrow and the score on its own, for example "▲ 7.5" | Clean charts, a glance |
| Table | One row per system with its state, then the score. The default | Seeing which systems are behind the number |
| Horizontal | The same nine systems laid out across two or three wide rows | Wide monitors, and charts with little vertical room |
Weighted Scoring System
Nine systems carry a weight. Meta Tools does not, because it coordinates the rest rather than reading the market. The weights are fixed in the indicator, not settings you can change. Bullish and bearish weights are tallied separately, so each side can reach 11.0, and the score shown is whichever side is larger. The High Confluence alert fires when either side reaches 6.0.
| System | Weight | What earns it |
|---|---|---|
| Liquidity Sweeps | 2.0 | A swept level that price rejected |
| Exhaustion Counter | 2.0 / 1.5 / 1.0 | A perfected 9, a plain 9, or an 8 |
| Squeeze | 1.5 | The direction a squeeze released in |
| S/D Zones | 1.5 | Price sitting inside a supply or demand zone |
| SuperTrend | 1.0 | Which way the two-of-three ATR consensus points |
| EMA Trio | 1.0 | Whether 50, 100 and 200 are stacked in order |
| Patterns | 1.0 | A candlestick pattern from the sixteen |
| BMSB | 0.5 | Price above or below the support band |
| Regime Box | 0.5 | The four-vote regime classification |
Confluence Panel Settings
Note: The Confluence Panel has its own toggle in the Confluence settings group, and the master setting does not reach it. That is what lets you show just the score panel with nothing drawn on the chart.
| Setting | Options | Default | Description |
|---|---|---|---|
| Show Panel | On/Off | On | Toggle confluence panel visibility. The master setting does not reach it |
| Mode | Badge / Table / Horizontal | Table | Compact badge, the full breakdown, or a single row |
| Horizontal Rows | 1 or more | 2 | How many rows the Horizontal mode uses |
| Position | Top Right / Top Left / Bottom Right / Bottom Left | Top Right | Where the panel sits on the chart |
| Size | Tiny, Small, Normal, Large | Tiny | Panel text size |
| Transparent Background | On/Off | On | Whether the panel draws its own background |
Interpretation:
- Score 6.0 and above: The level that fires the High Confluence alert. That figure is fixed in the script rather than a setting, and there is no matching low-confluence alert. Several systems are pulling the same way.
- Score 3.0 to 6.0: A lean rather than an agreement. Read the rows to see which systems are carrying it.
- Score under 3.0: The systems disagree, or the ones that agree are the light ones.
🔗 Integration with Other Indicators
While OmniDeck provides comprehensive multi-system analysis on its own, combining it with other Signal Pilot indicators creates even more powerful confluence setups. Here are proven integration workflows:
OmniDeck + Janus Atlas (Regime + Levels)
Workflow:
- Check OmniDeck Regime Box → Identify current trend direction (bullish, bearish, or neutral regime)
- Enable Janus Atlas levels → Focus on Daily/Weekly levels, POC, VWAP for structural zones
- Look for regime + level confluence → Bullish regime + price at Daily Low support = accumulation phase confluence zone
- Expected outcome: Regime context + structural levels = analysis aligned with both trend and structure
Example: OmniDeck shows bullish regime box → Price pulls back to Weekly Low + Daily VWAP confluence → Accumulation phase confluence in aligned trend
OmniDeck + Pentarch (Multi-System + Timing)
Workflow:
- OmniDeck shows bullish alignment → Multiple systems confirming uptrend (Regime Box, EMA Trio, SuperTrend)
- Wait for an event from Pentarch → a TD or IGN fires during a pullback in the bullish regime
- Regime alignment + timing event = confluence detected → Trend-aligned reversal event with multi-system confirmation
- Expected outcome: Pentarch provides precise timing within OmniDeck's broader trend context
Example: OmniDeck bullish regime + price above all three EMAs + SuperTrend green → an IGN fires in Pentarch = trend-aligned confluence detected
OmniDeck + Volume Oracle (Exhaustion Counter + Regime)
Workflow:
- The OmniDeck Exhaustion Counter completes a count → the number 9 appears, marking possible exhaustion
- Read the regime in Volume Oracle → Is the regime aligned with the Exhaustion Counter direction?
- EC signal + aligned regime = validated exhaustion → Accumulation regime at a green 9 = volume accumulation confirms the reversal
- Expected outcome: Volume Oracle tells you, through its regime, which Exhaustion Counter signals have volume behind them
Example: OmniDeck Exhaustion Counter reaches a green 9 → Volume Oracle shows Accumulation regime (green, 72%) = confirmed bullish reversal with accumulation flow
OmniDeck + Harmonic Oscillator (Regime + Momentum)
Workflow:
- OmniDeck Regime Box shows trend → Identify bullish, bearish, or ranging regime
- Check Harmonic Oscillator alignment → the status panel should confirm the regime: TRENDING▲ in a bullish regime, TRENDING▼ in a bearish one
- Regime and momentum agreeing = two sources, not one → Both trend and momentum pointing same direction
- Conflicting readings = caution → a bullish regime with TRENDING▼ on the oscillator is the two instruments disagreeing, which is itself a reading
Example: OmniDeck bullish regime → Harmonic Oscillator shows TRENDING▲ with a high vote count → everything points one way. OmniDeck bullish with Harmonic on TRENDING▼ is an early warning of trend weakness
Pro Tip: The Multi-System Workflow
To read three systems on one bar, use OmniDeck Regime Box (trend) + Exhaustion Counter (timing) + Janus Atlas (levels) + Volume Oracle (regime confirmation). Check OmniDeck regime first, wait for Exhaustion Counter signal at key level, then confirm with aligned Volume Oracle regime. This multi-layer approach filters for only the strongest, most aligned opportunities.
See also: Analysis Workflow Guide for detailed multi-indicator approaches.
⚠️ Common Mistakes to Avoid
These mistakes are frequently made by new OmniDeck users. Avoid them to improve your results:
Mistake #1: Enabling All 10 Systems Immediately
The Problem: Turning on all 10 systems at once creates chart overload. Too many lines, signals, and zones = visual clutter and analysis paralysis.
The Fix:
- Start with the four the settings section starts you on: Exhaustion Counter, Squeeze Detector, EMA Trio and Regime Box
- Master each system individually before adding more
- Gradually add systems as you understand how they interact
- Most users settle on 3-5 systems they truly understand rather than all 10 half-understood
Remember: Less is more. Four systems you deeply understand beat ten you are confused by.
Mistake #2: Analysis Paralysis from Conflicting Signals
The Problem: Different systems sometimes give conflicting signals (a green 9 on the Exhaustion Counter while SuperTrend is red). Beginners freeze, not knowing which signal to follow.
The Fix:
- Use a hierarchical approach: Regime Box (trend context) > Exhaustion Counter (timing) > Individual systems (confirmation)
- If Regime Box is bullish, prioritize bullish signals from other systems
- Conflicting signals describe indecision, which is a state of the market rather than a fault in the deck
- Wait for multi-system alignment (3+ systems agreeing) before acting
Remember: Conflicting signals aren't a problem: they're information. They tell you the market is uncertain. Trade only when systems align.
Mistake #3: Not Understanding Individual Systems First
The Problem: Jumping into OmniDeck without understanding what Exhaustion Counter, SuperTrend, or EMA Trio actually do leads to misinterpreting signals and poor decisions.
The Fix:
- Study each system independently: Research Exhaustion Counter mechanics, SuperTrend logic, Supply/Demand zone formation
- Enable one system at a time and trade it solo for 10-20 trades to learn its behavior
- Understand what each system measures: trend (Regime Box, SuperTrend, EMA Trio, BMSB), volatility (Squeeze), exhaustion (Exhaustion Counter, Candlestick Patterns, Liquidity Sweeps), structure (Supply/Demand Zones)
- Only combine systems after you understand each individually
Remember: You can't successfully combine systems you don't understand individually. Master 4 systems first.
Mistake #4: Ignoring the Regime Box (Trend Context)
The Problem: Acting on counter-trend events (expecting a green 9 to turn the market in a bearish regime) reduces accuracy. The Regime Box shows overall trend, so ignoring it reduces reliability.
The Fix:
- Bullish Regime: Focus on long setups, buy dips, avoid shorts unless extreme reversal signals
- Bearish Regime: Focus on short setups, sell rallies, avoid longs unless extreme reversal signals
- Neutral Regime: Range-bound, trade both directions but with tighter stops and smaller size
- Always check Regime Box first before analyzing other systems
Remember: Regime Box is your trend filter. Trade WITH the regime, not against it.
Mistake #5: Over-Relying on Exhaustion Counter Alone
The Problem: Exhaustion Counter is powerful but not infallible. Acting on every count of 9 without confirmation from other systems or price action leads to whipsaws.
The Fix:
- Exhaustion Counter signals exhaustion, not guaranteed reversal
- Wait for price confirmation: reversal candle pattern, volume spike, or support/resistance level
- Combine with the Regime Box: a green 9 in a bullish regime carries more weight than the same green 9 in a bearish one
- Use Exhaustion Counter as timing tool, not standalone strategy
Remember: Exhaustion Counter is best used for timing entries WITHIN the broader trend shown by the Regime Box and SuperTrend.
Mistake #6: Treating All 10 Systems as Equally Important
The Problem: Not all systems serve the same purpose. Beginners weight all signals equally, causing confusion when systems conflict.
The Fix:
- Trend systems (primary): Regime Box, SuperTrend, BMSB → Establish directional bias
- Timing Systems (secondary): Exhaustion Counter, Liquidity Sweeps → Identify entry/exit points within trend
- Confirmation systems: EMA Trio, Squeeze, Candlestick Patterns → Confirm the strength of a move
- Use the trend systems to set the bias, the timing systems to find the entry, the confirmation systems to check the move has weight behind it
Remember: Trend context comes first; timing and confirmation refine the entry. Reading them in that order is what keeps a disagreement from looking like a contradiction.
Additional Resources
For more best practices, see Best Practices & Pro Tips. For multi-system workflow examples, see Analysis Workflow Guide.
🌫️ When This Doesn't Work Well
OmniDeck systems show reduced reliability or increased complexity in certain market conditions. Recognizing these environments helps set appropriate expectations:
Choppy, Range-Bound Markets
The Condition: When price oscillates sideways in a narrow range with no clear trend, multiple OmniDeck systems generate conflicting signals simultaneously.
What Happens: Regime Box shows neutral (gray), the EMAs flatten and tangle, Exhaustion Counter fires frequently in both directions, SuperTrend flips repeatedly. Signal clarity decreases dramatically as different systems disagree.
Context: This isn't a flaw: it's OmniDeck accurately reflecting market ambiguity. When the market has no clear direction, technical systems designed to follow trends naturally produce conflicting outputs. The conflict itself is the reading: the systems do not agree, and that is what the deck is there to tell you.
Too Many Systems Enabled Simultaneously
The Condition: User enables all 10 systems at once on a single chart, especially on lower timeframes (5m, 15m).
What Happens: Visual overload makes it difficult to identify which signals matter. Too much information becomes noise rather than clarity. Analysis paralysis sets in, with so many data points that decision-making becomes impossible.
Context: OmniDeck provides 10 systems because different users need different tools, not because everyone should use all 10 simultaneously. Most effective users run 3-5 systems they deeply understand. More systems ≠ better analysis beyond a certain point.
Exhaustion Counter in Strong Parabolic Trends
The Condition: During vertical price moves (especially in crypto, momentum stocks, or panic selling), Exhaustion Counter counts complete but price continues without reversal.
What Happens: Green and red 9s keep firing, suggesting exhaustion, but price momentum is so extreme that "exhaustion" lasts weeks or months. Multiple failed reversals occur before actual top/bottom forms.
Context: Exhaustion Counter measures typical exhaustion patterns, but extraordinary trends (driven by narratives, short squeezes, or panic) can remain "exhausted" far longer than technical patterns suggest. Combine EC signals with Regime Box strength and Volume Oracle climax patterns for confirmation.
Major News & Fundamental Events
The Condition: During earnings, Federal Reserve decisions, geopolitical crises, or regulatory announcements, price becomes driven by news rather than technical patterns.
What Happens: All OmniDeck systems analyze price action, but they don't "know" about external catalysts. Price can gap through support/resistance levels shown by Supply/Demand Zones, ignore SuperTrend signals, or reverse violently despite all systems showing trend continuation.
Context: Technical analysis works best when price is driven by supply/demand dynamics and participant psychology. When fundamental news dominates, technical patterns temporarily lose predictive power. This affects all technical systems, not just OmniDeck. Calendar awareness helps identify these periods.
Very Low Timeframes (1-Minute, 5-Minute) with Multiple Systems
The Condition: Using OmniDeck on 1m or 5m charts with 5+ systems enabled, especially in low-volume environments.
What Happens: Systems fire constantly due to market microstructure noise (bid-ask spreads, algorithmic activity, small retail orders). Signal frequency increases but quality decreases. Stop losses get hit frequently before "legitimate" moves develop.
Context: Lower timeframes amplify noise exponentially. Systems like Exhaustion Counter and SuperTrend work on any timeframe, but their signal-to-noise ratio degrades significantly below 15m. If you must trade lower timeframes, reduce number of systems enabled and confirm signals with higher timeframe context (1H, 4H).
Individual System Inherent Limitations
The Condition: Each of the 10 systems has specific market conditions where it underperforms:
- Exhaustion Counter: Weak in strong trending markets (premature exhaustion signals)
- EMA Trio: Lags during sudden reversals, as any moving average does
- Squeeze: Less effective in trending markets (designed for volatility expansion from consolidation)
- SuperTrend: Whipsaws in choppy markets (trend-following system in non-trending environment)
- Supply/Demand Zones: Lose significance during strong momentum moves (support/resistance breaks)
- BMSB: Can give late signals at extremes (mean reversion indicator in trending market)
What Happens: Relying on a single system during its weak condition produces poor results. For example, expecting every Exhaustion Counter exhaustion event to reverse during a parabolic bull run leads to multiple false expectations.
Context: This is why OmniDeck provides 10 systems: no single system works in all conditions. The goal is to use systems that match current market structure (trend systems during trends, mean reversion systems during ranges, exhaustion systems at cycle turning points). System selection based on market context is as important as signal interpretation.
Recognizing Reduced Reliability Environments
Practical Identification:
- Regime Box neutral (gray) for extended periods: Market lacks directional conviction: reduce activity
- 3+ systems giving conflicting signals: Wait for alignment before acting
- Exhaustion Counter counts completing rapidly in both directions: Sign of choppy conditions
- SuperTrend flipping color multiple times within 10 bars: Indicates whipsaw environment
- Chart feels cluttered/overwhelming: Too many systems enabled: disable 3-4 and focus on core systems
- Economic calendar shows major events: Expect technical patterns to be overridden by news
Remember: OmniDeck's multi-system approach is most powerful when systems confirm each other. When systems conflict significantly, that conflict is a signal to step aside, not to pick which system to trust. Three or more systems describing the same condition is the most agreement the deck can show.
❓ Frequently Asked Questions
Q: Should I enable all 10 systems?
A: Starting with 3-4 systems recommended to learn each properly. Systems can be added progressively based on individual approach.
Q: Does it slow down my charts?
A: No. OmniDeck optimized to run all systems efficiently. Minimal performance impact even with all 10 enabled.
Q: Can I customize each system?
A: Yes. Each system has individual settings available. Colors, sensitivity, display options all customizable.
Q: What timeframes work?
A: All timeframes supported. System relevance varies by timeframe (e.g., Exhaustion Counter works on all, but characteristics differ).
Q: How do systems interact?
A: The Meta Tools layer keeps the systems from drawing over each other and coordinates their alerts. It does not make them agree. Systems built on different logic will read the same chart differently, and that disagreement is itself worth reading. See Mistake #2 below.
Q: Can I use just one system?
A: Yes. Any system can be used standalone. Multi-system confluence provides additional context.
Q: What's the difference between SuperTrend and Regime Box?
A: SuperTrend = ATR-based trend following. Regime Box = Multi-factor regime analysis. Both provide directional bias but use different methodologies.
Q: Do zones repaint?
A: No. Supply/Demand zones drawn once conditions met, do not change retroactively.
Q: Why do settings open when I double-click S/D zones?
A: Double-clicking on S/D zone boxes opens indicator settings: this is standard TradingView behavior for all indicator-drawn objects, not a bug.
Q: Can I export system signals?
A: Alerts provide signal notification compatible with TradingView alert system and webhooks.
Q: Works with other Signal Pilot indicators?
A: Yes. Designed for compatibility with entire suite. It can be read alongside the other indicators in the suite, among them Pentarch and Janus Atlas.
Q: What is the Confluence Score Panel?
A: An at-a-glance display of how much weight is behind one direction. Nine systems carry a weight, and one side can reach 11.0, so Liquidity Sweeps at 2.0 counts for four times what the Regime Box does at 0.5. Available in Badge (compact) or Table (detailed) mode.
Q: What are the 16 RCS patterns?
A: Classic candlestick reversal patterns automatically detected. Bullish (8): Hammer, Inverted Hammer, Bull Engulfing, Rising Three Methods, Three White Soldiers, Morning Star, Bull Harami, Tweezer Bottom. Bearish (8): Hanging Man, Shooting Star, Bear Engulfing, Falling Three Methods, Three Black Crows, Evening Star, Bear Harami, Tweezer Top. Each pattern has its own individual alert.
Q: What sets the pattern lookback?
A: The pattern lookback comes from the chart timeframe, not from a setting. It is 50 bars at 5 minutes and below, 40 at 15 minutes, 30 at 1 hour, 40 at 4 hours, 30 at Daily and 20 above that.
Q: How many alerts does OmniDeck have?
A: 38 alerts total across all systems, including individual alerts for each of the 16 RCS patterns, RCS_ANY_BULL (any bullish pattern), RCS_ANY_BEAR (any bearish pattern), BMSB cross alerts, Regime flip alerts, and Confluence score threshold alerts.
📋 Quick Reference Guide
System Quick Reference
| System | Visual | Bullish Signal | Bearish Signal |
|---|---|---|---|
| Exhaustion Counter | Numbers | Green 9 | Red 9 |
| Squeeze | Dots/Arrows | Red dots → Teal ▲ arrow | Red dots → Red ▼ arrow |
| Liquidity Sweeps | Emojis | 💧 Water droplet | 🩸 Blood drop |
| EMA Trio | Lines | Above all EMAs, GC | Below all EMAs, DC |
| SuperTrend | Ribbon | Green ribbon | Red ribbon |
| BMSB | Band | Touch + bounce | Break below |
| Regime Box | Background | Green | Red |
| S/D Zones | Boxes | At demand zone | At supply zone |
| Patterns | Labels | HAM, BUE, etc | SS, BEE, etc |
Common System Combinations (Examples)
| Analysis Style | Example Systems (4-5 total - educational) |
|---|---|
| Multi-Day Analysis | EC + EMA + Regime + Zones + Patterns |
| Intraday Analysis | Squeeze + SuperTrend + BMSB + Regime + Sweeps |
| Scalping | EC + Squeeze + Regime + Sweeps + Patterns |
| Trend Following | EMA + SuperTrend + BMSB + Regime |
| Mean Reversion | EC + Zones + Regime + Patterns |
Confluence Levels
| Low confluence: | score 1-4: the systems disagree |
| Moderate confluence: | score 5-7: reasonable alignment, read the context |
| High confluence: | score 6.0 or more, the level that fires the alert |
This is the weighted score the Confluence Panel prints, not a count of systems. A liquidity sweep alone carries 2.0 of the 11 points a side can reach, while the Regime Box carries 0.5. More weight behind a direction is not a guarantee of outcome.
📞 Support
Technical Questions: support@signalpilot.io
Deepen your understanding with these articles from the Signal Pilot Blog:
Explore the methodology behind our indicator suite
Free Indicators vs Professional ToolsUnderstand what separates basic from advanced analysis
💬 Need Help?
Have questions about OmniDeck? Join our Discord community to get help from experienced users, share setups, and discuss approaches!
See Also
Related Pages:
- Pentarch v1.0 - A separate indicator for cycle phases, read alongside OmniDeck rather than inside it
- Janus Atlas v1.0 - A separate indicator that draws the levels OmniDeck does not
- Harmonic Oscillator v1.0 - A separate momentum indicator with its own panel
- Volume Oracle v1.0 - A separate indicator that reads volume as regime
- All Indicators At A Glance - Quick reference for all systems
Disclaimer: This indicator combines multiple technical analysis systems. All signals represent historical pattern detection based on various methodologies (exhaustion counting, volatility analysis, moving averages, volume zones, candlestick patterns). Individual interpretation, application, and outcomes vary. Past signal patterns do not guarantee future results. This is not financial advice.