Plutus Flow - Statistical OBV Analysis
Price tells you where a market went. Plutus Flow shows the volume behind it: a running total that adds a bar's volume when it closes higher and takes it away when it closes lower. When price and that flow disagree, Plutus marks it. It's a second opinion on every move.
 Watch it explainedOn our YouTube channel: every part shown on real charts, in TradingView Bar Replay.9:53
What you see
| In the pane | What it means |
|---|---|
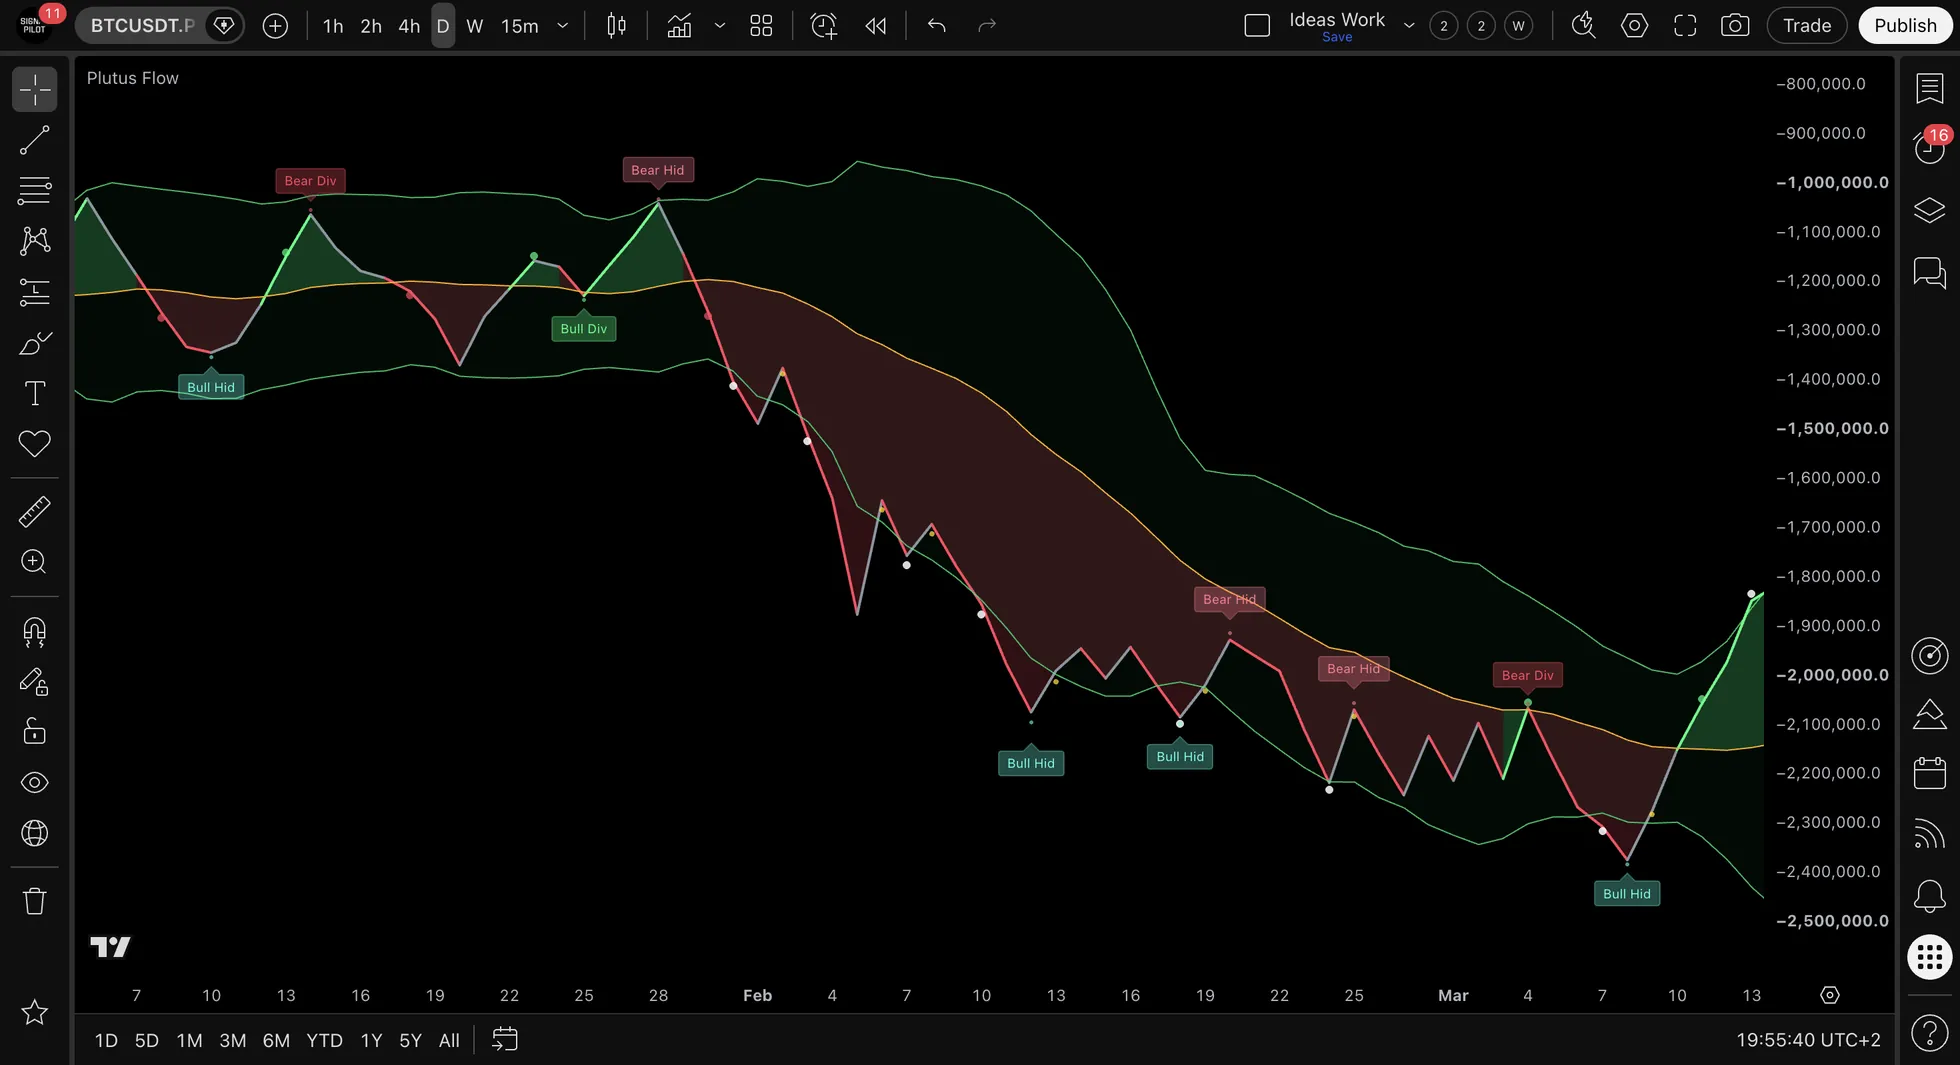
| The thick line | The flow: the running total of volume. Green when it's above its basis and rising, red when below and falling, grey when those disagree |
| The orange line | The basis: the flow's own average |
| The ribbon | Green while the flow is above its basis, red while it's below |
| The two thin bands | The edges of the flow's normal range. Inside is normal, outside is stretched |
| Green or red dot | The flow crossed its basis: up or down |
| White dot | The flow broke out of a band |
| Yellow dot | The flow came back inside a band |
| Bull Div · Bear Div · Bull Hid · Bear Hid | Price and flow disagreeing (see Divergence) |
How the total is kept
It's built on Joe Granville's On-Balance Volume, with one change of ours: a single enormous bar can't swamp the total for months. A spike still counts. It just can't count for everything.
Crosses
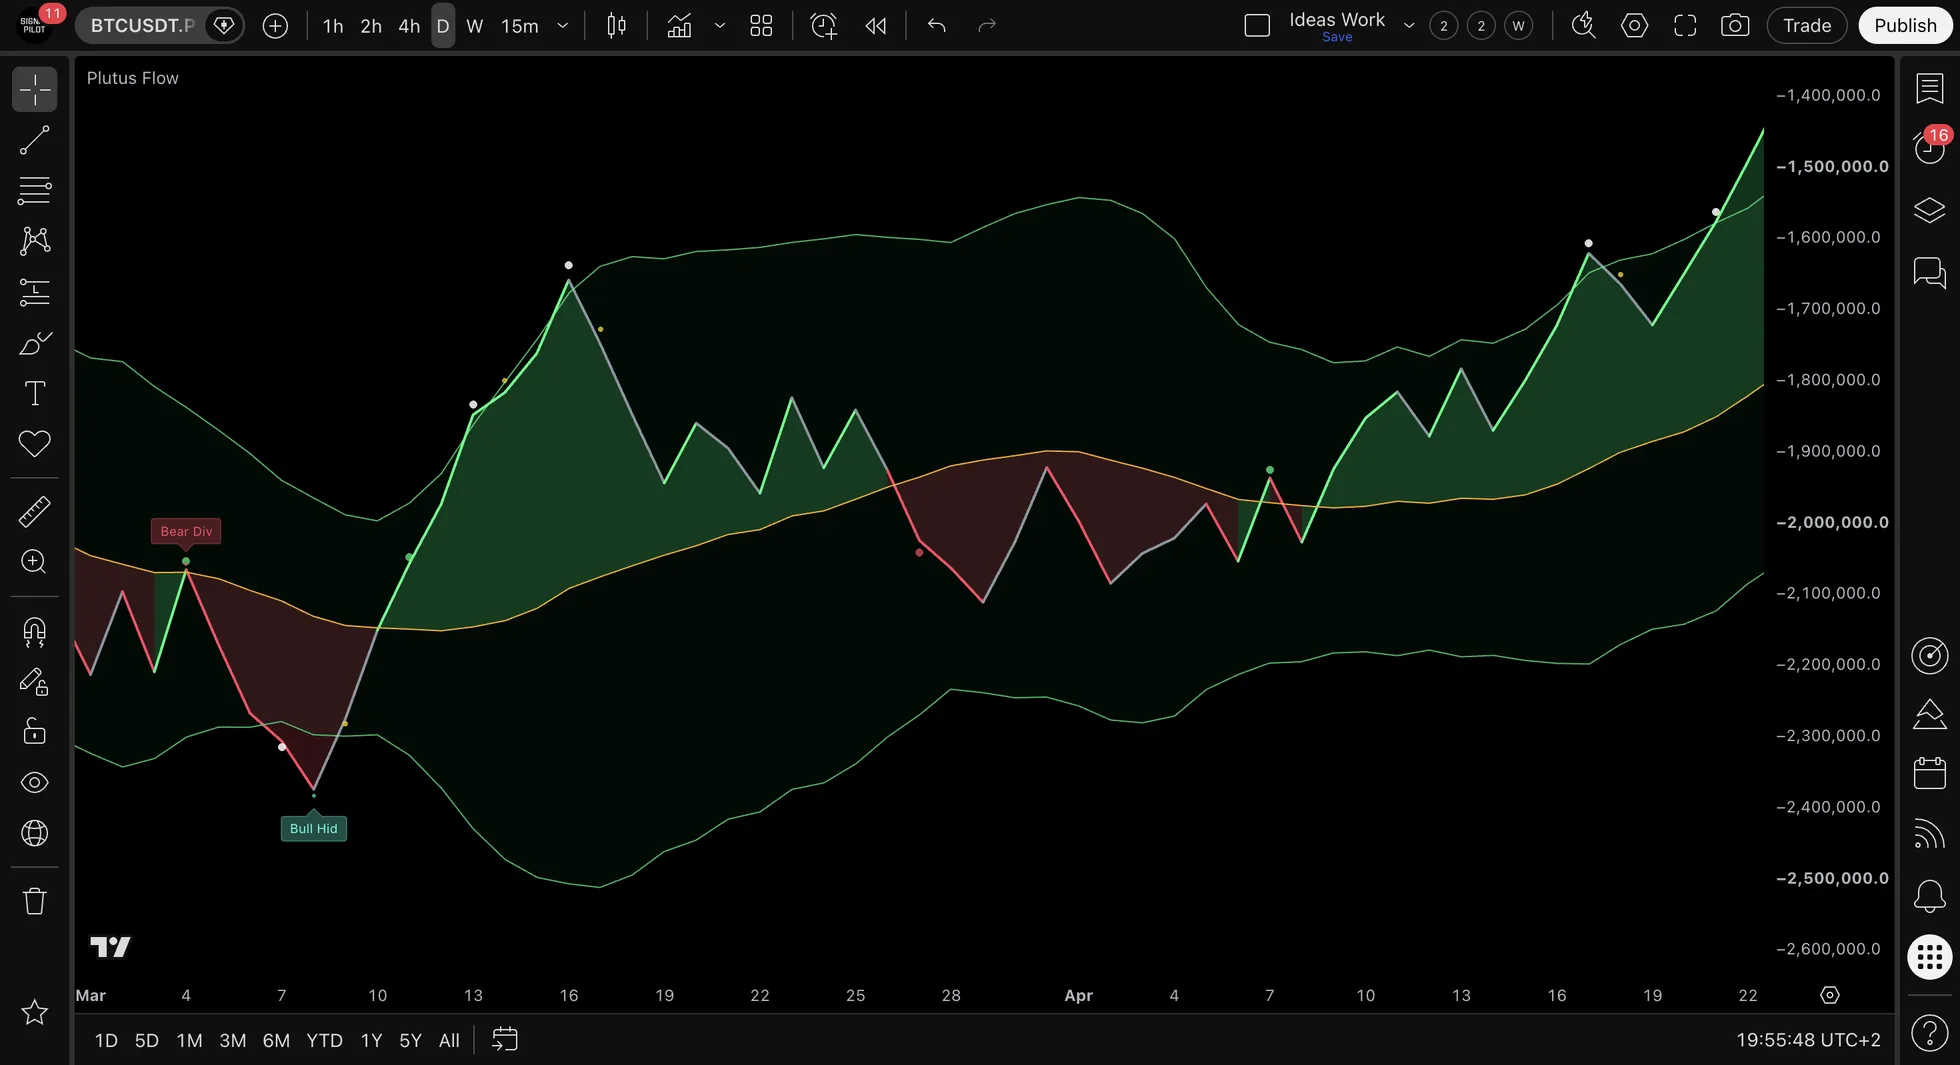
When the flow crosses its basis, a dot marks it: green going up, red going down. To keep a choppy market from flipping it back and forth, a cross the other way must wait at least three bars (FlipGuard).
The edges of normal
A white dot marks the bar where the flow breaks out of its band: the move is stretched, and sometimes it's the start of something. A yellow dot marks the bar where it comes back inside: the stretch letting go.
Divergence
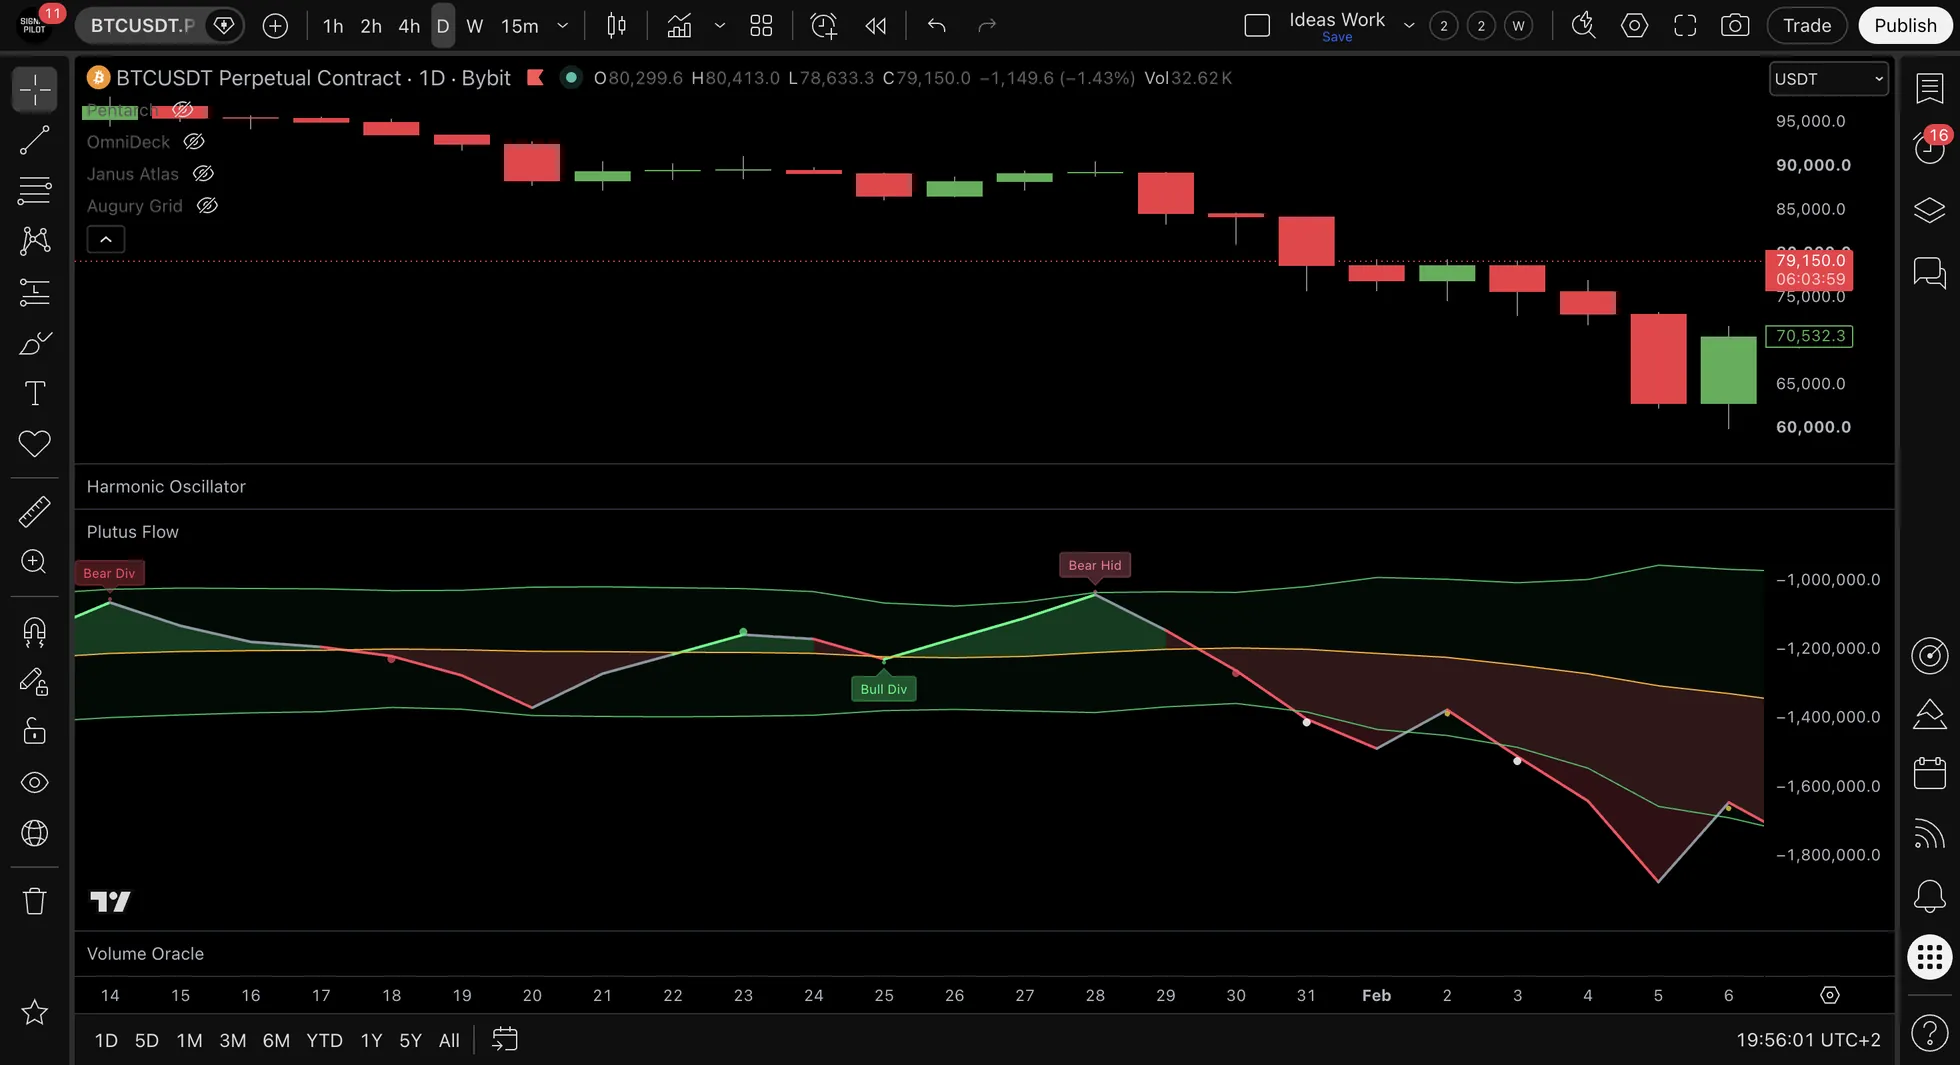
| Label | Price | Flow | Reads as |
|---|---|---|---|
| Bull Div | Lower low | Higher low | Selling pushing price down on less volume |
| Bear Div | Higher high | Lower high | Buying pushing price up on less volume |
| Bull Hid | Higher low | Lower low | The dip came with real selling, and price still held |
| Bear Hid | Lower high | Higher high | The bounce came with real buying, and price still couldn't climb |
Regular divergences point against the move; hidden ones point with it. Each label appears three bars after its swing, once the swing is confirmed, and is drawn back on the swing. Once it's there, it stays.
Settings that matter
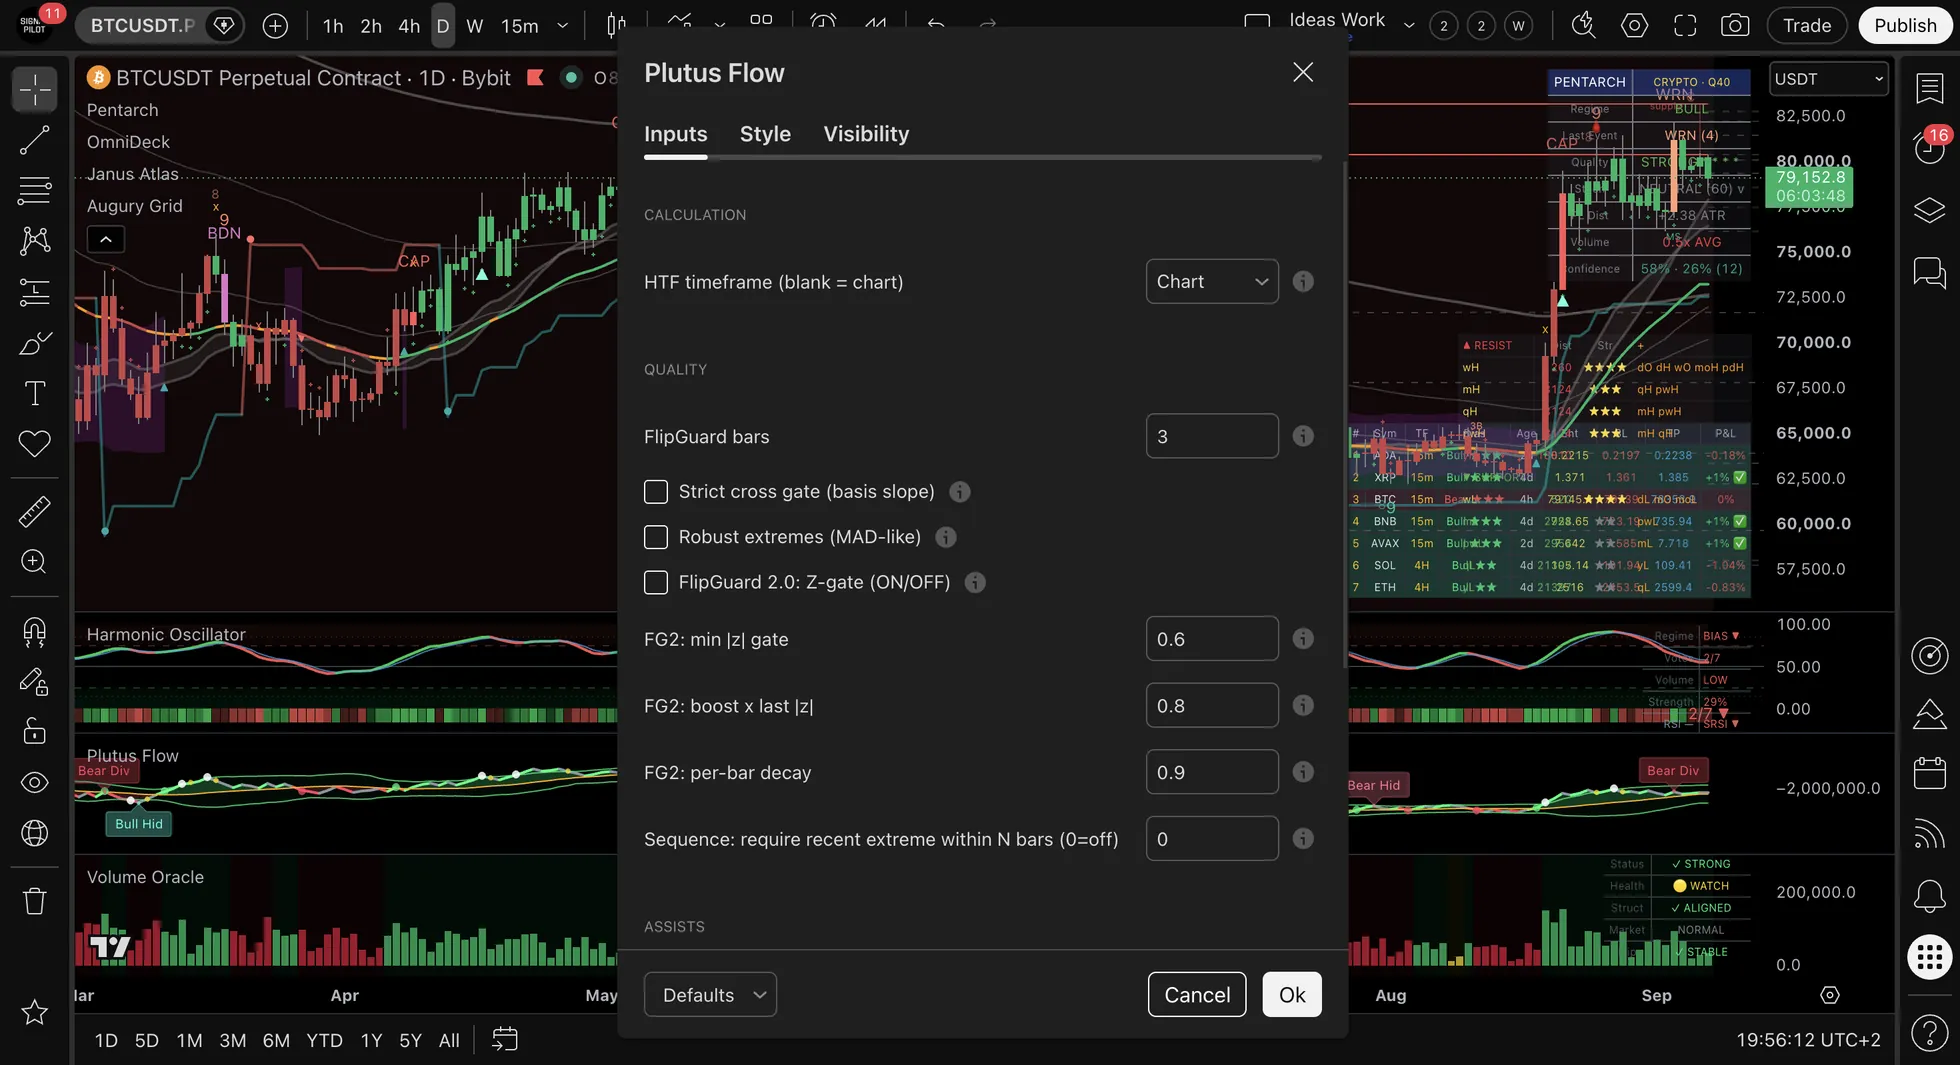
| Setting | Default | What it changes |
|---|---|---|
| HTF timeframe | Chart | Calculates the flow on a higher timeframe (smoother, slower) |
| FlipGuard bars | 3 | The bars a cross the other way must wait |
| Strict cross gate | Off | Only crosses in the direction the basis is sloping |
| Robust extremes | Off | Bands that big spikes stretch less |
| FlipGuard 2.0: Z-gate | Off | Crosses must also be strong enough to count |
| Sequence | 0 (off) | Only crosses that come within that many bars of the flow being outside a band |
| Flip gate: HTF alignment | Off | Only crosses that agree with the higher timeframe's flow |
| Min price swing for divergences | 0 | Skip divergences on small swings |
| Show divergence labels · Show extreme zone EXITS | On | The labels and the yellow dots |
Every gate is off by default: switch one on when you want fewer crosses.
Alerts
Ten alerts, each on the bar's close.
| Group | Alerts |
|---|---|
| Crosses | Plutus | CrossUp · Plutus | CrossDown |
| Out of the band | Plutus | Breach +2s · Plutus | Breach -2s |
| Back inside | Plutus | Exit +2s · Plutus | Exit -2s |
| Divergence | Plutus | Bull Div · Plutus | Bear Div · Plutus | Bull Hid · Plutus | Bear Hid |
Good to know
- It doesn't repaint. Dots and alerts come on closed bars; a divergence label waits three bars for its swing to be confirmed, then stays.
- No single mark tells you what comes next. Plenty of divergences fade, and plenty of white dots are followed by more of the same.
- It needs real volume. On markets with little or unreliable volume the flow means little.
- Read it with the others. Pentarch names the phase; Plutus shows whether volume agrees.
Learning guide
Read it in order, with real examples and the common misreads: open the learning guide (2 minutes).
📞 Support
Technical Questions: support@signalpilot.io
Deepen your understanding with these articles from the Signal Pilot Blog:
Learn to identify accumulation and distribution phases
Volume Profile BasicsMaster the fundamentals of volume-at-price analysis
💬 Need Help?
Have questions about Plutus Flow? Join our Discord community to get help from experienced users, share setups, and discuss approaches!
See Also
Related Pages:
- Volume Oracle - Complementary volume intelligence system
- Janus Atlas - Combine divergences with key structural levels
- OmniDeck - Ten systems in one overlay; it reads volume through zones and exhaustion rather than through OBV
- How to Set Up Alerts - Get notified on divergences and crosses
- Analysis Workflow - How OBV fits into complete analysis workflow
Disclaimer: Plutus Flow describes past price and volume; it does not predict. Results vary. Past performance does not guarantee future results. This is not financial advice.