Janus Atlas - Multi-Timeframe Auto-Levels
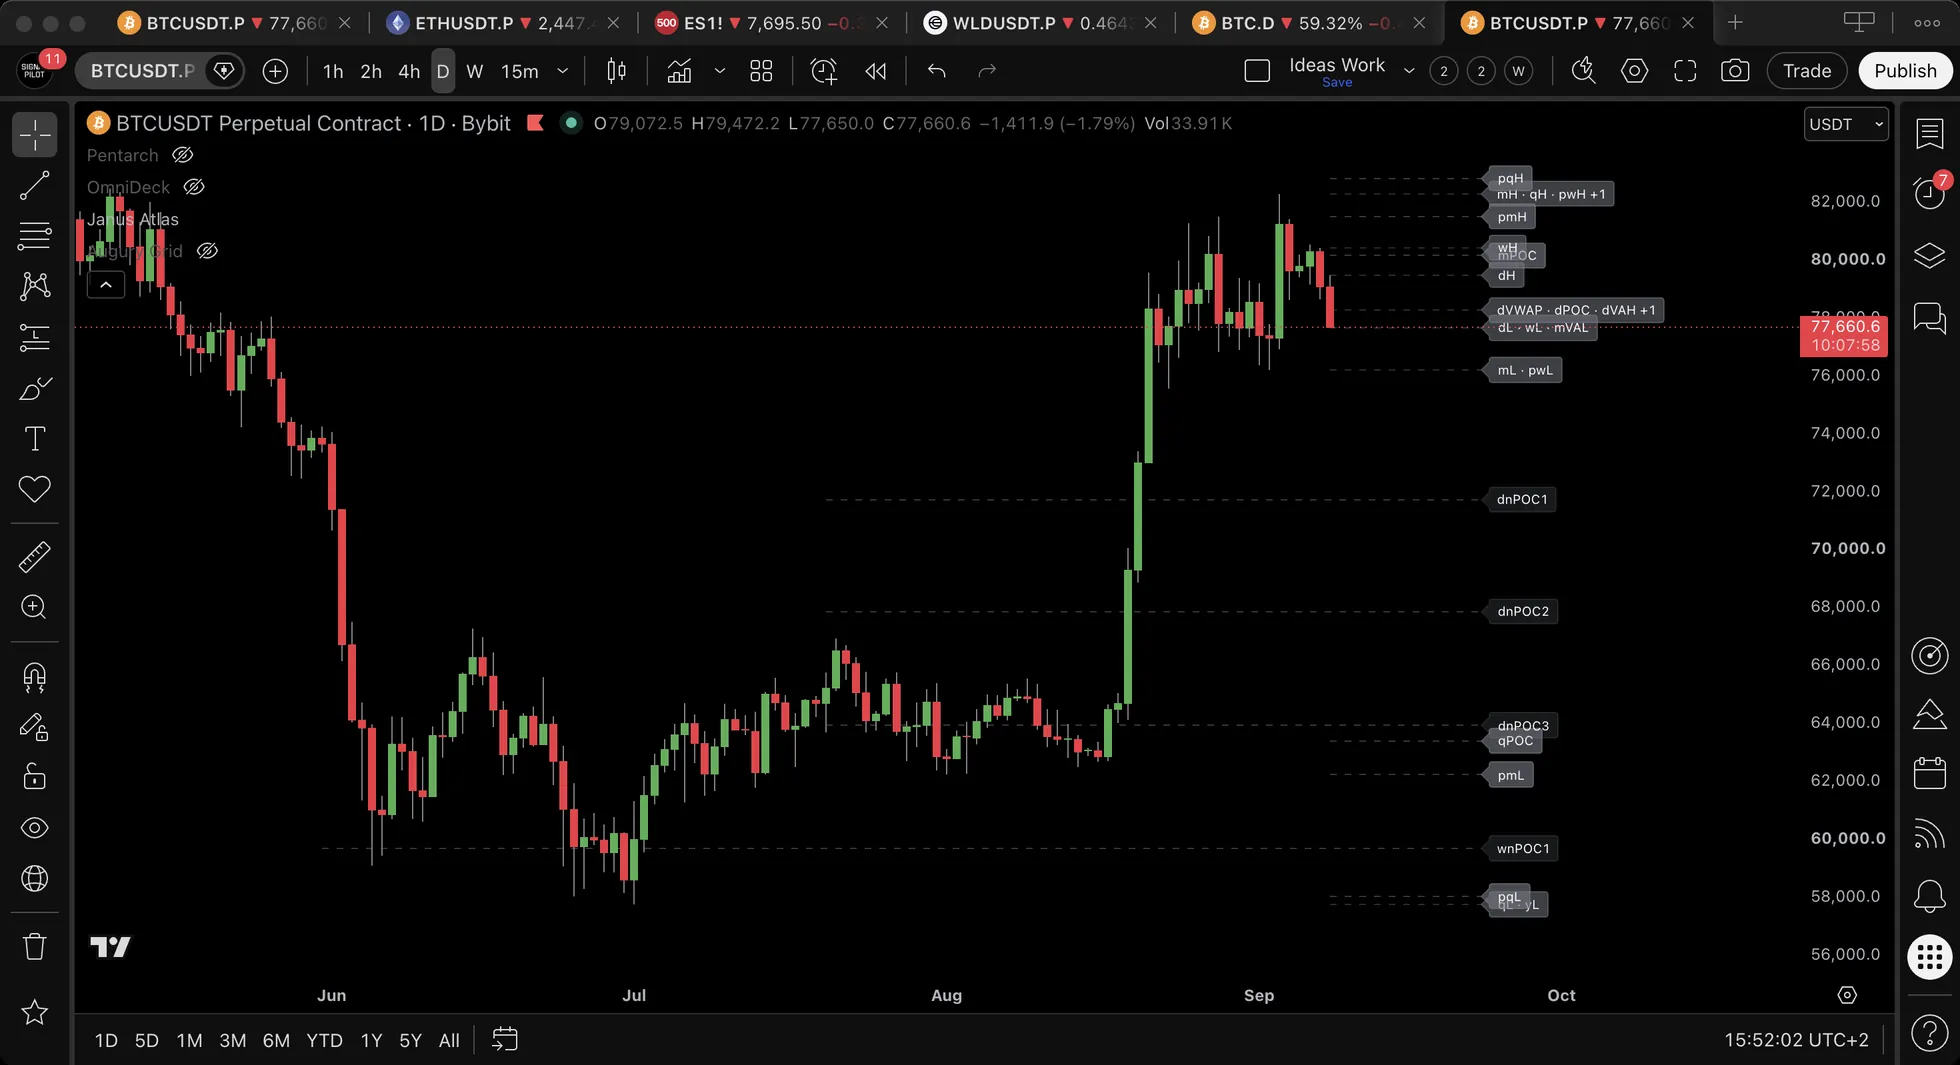
Every trader looks at the same lines: yesterday's high and low, this week's, the day's average price. Janus Atlas draws them for you, names each one, and keeps a table of how far price is from every one of them. It doesn't tell you whether price will stop at a level. It tells you where everyone is looking.
 Watch it explainedOn our YouTube channel: every part shown on real charts, in TradingView Bar Replay.12:20
Out of the box
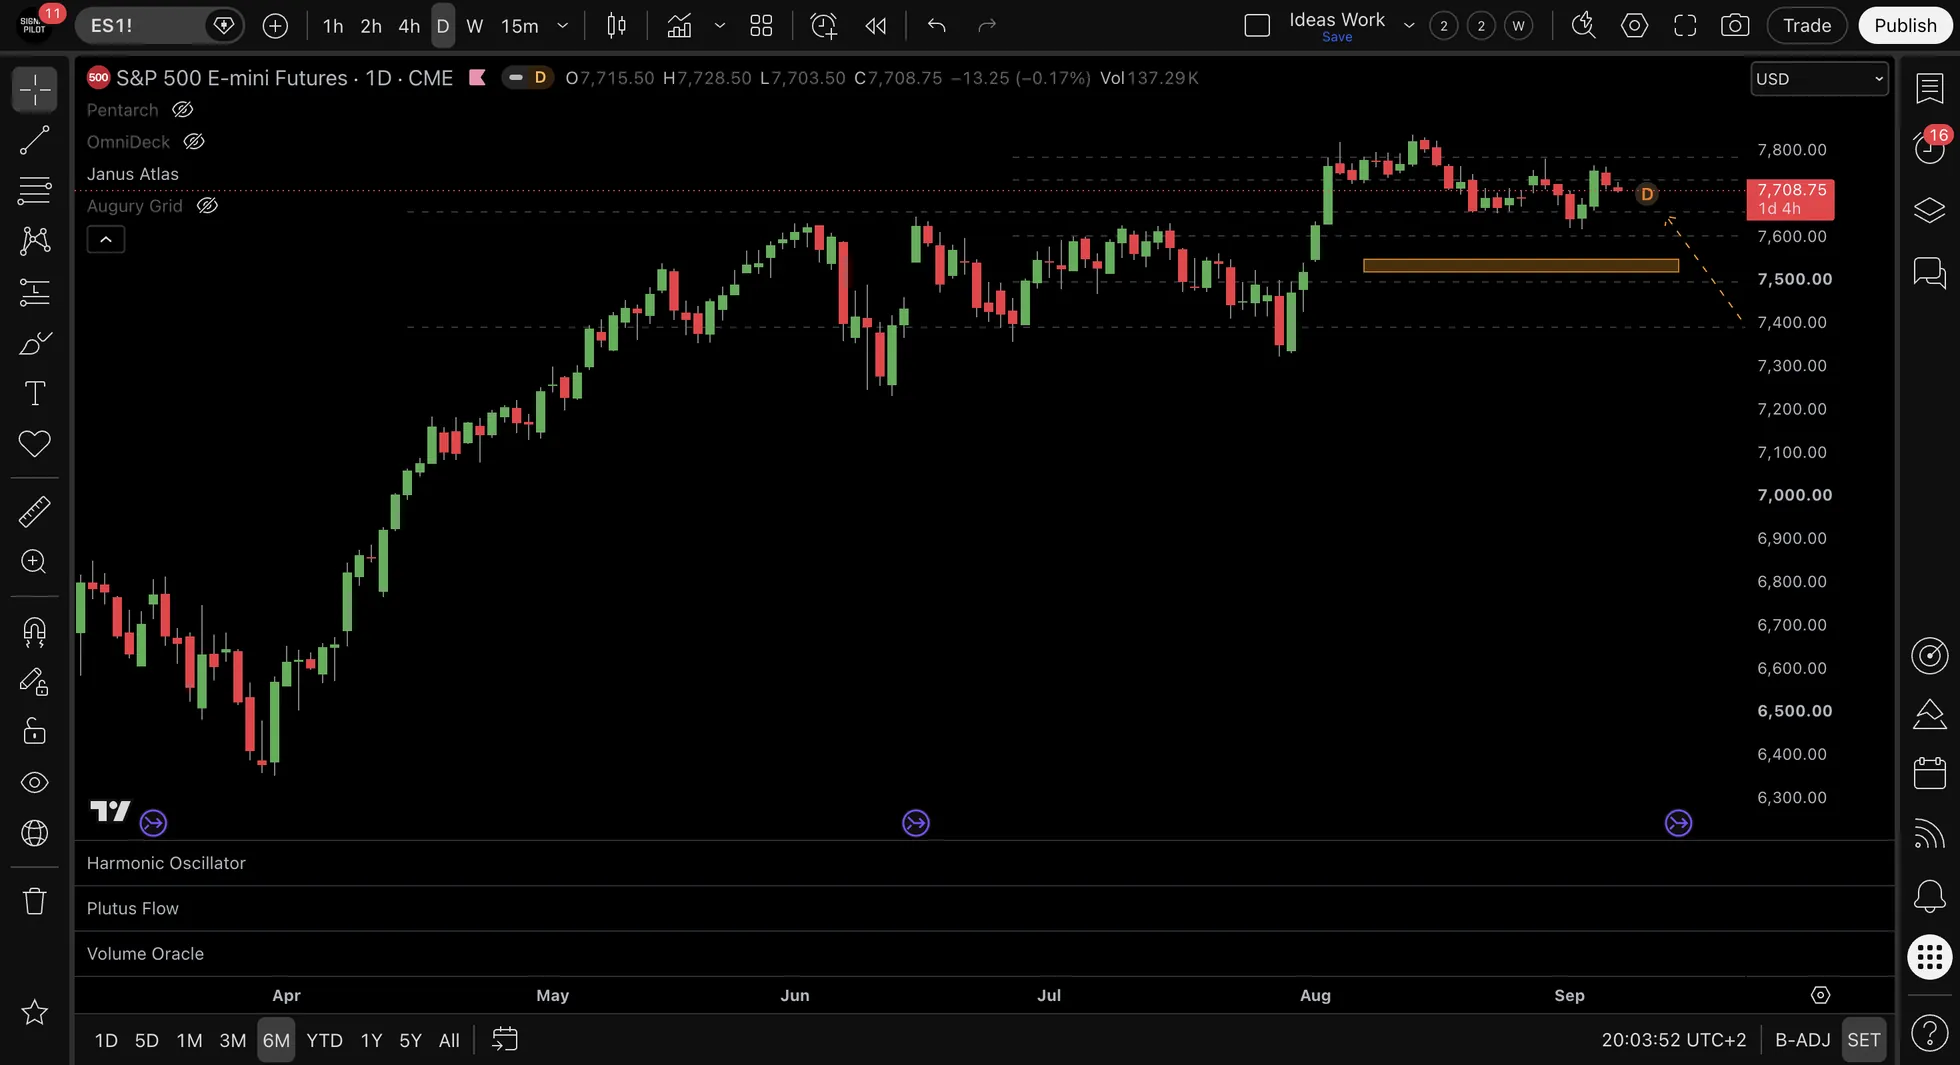
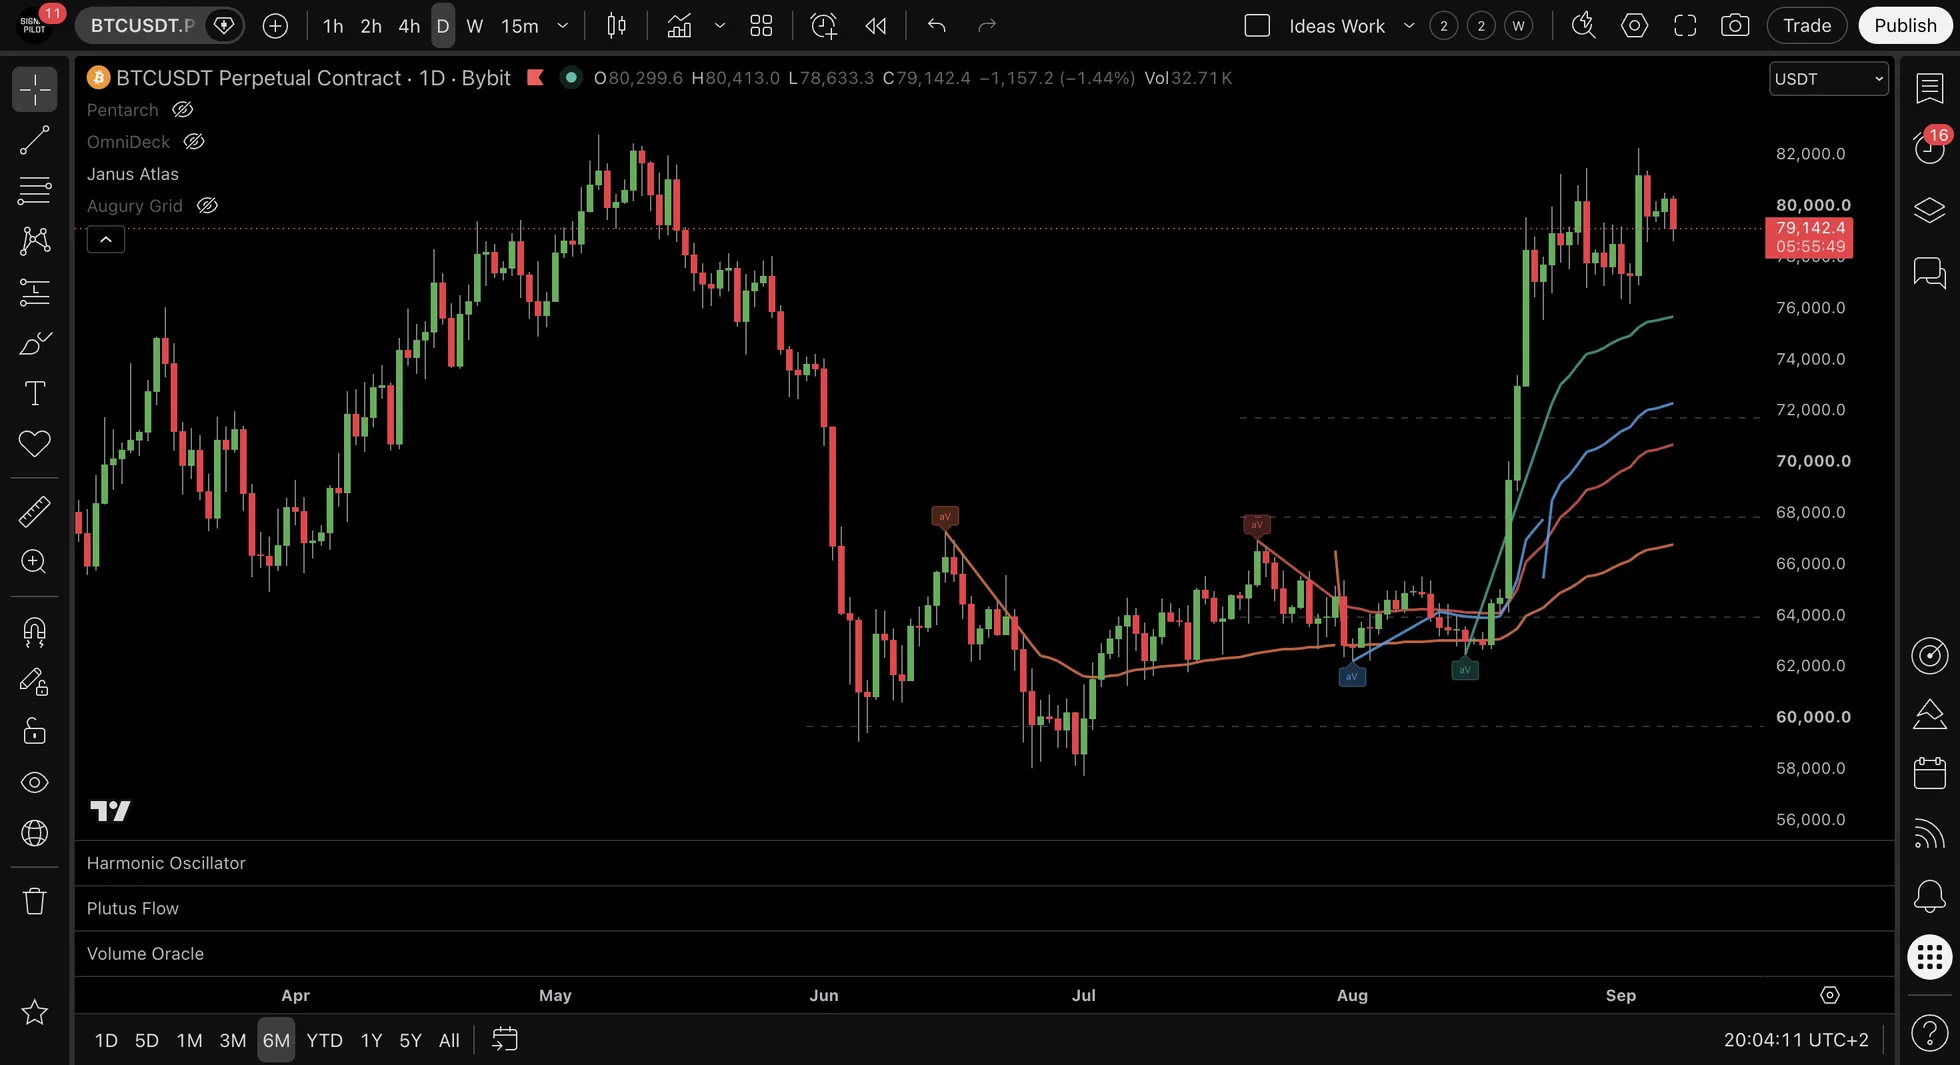
Switched on by default: today's and this week's high and low, yesterday's high and low, today's VWAP, the swing structure, fair value gaps and the distance table. That's seven levels on the chart.
| Label | Reads as |
|---|---|
| dH · dL | Today's high and low so far |
| wH · wL | This week's high and low |
| pdH · pdL | Yesterday's high and low |
| dVWAP | Today's average price, each bar weighted by how much traded in it |
How the names work: the first letter is the period (d day, w week, m month, q quarter, y year), a p in front means the one before, and the last letter is the level (O open, H high, L low; Mid for the middle). So pwL is last week's low. On crypto a day starts at midnight UTC, a week on Monday.
Levels that share a price
When levels sit within 0.15% of each other, Janus gives them one label: all their names, and the count in brackets, like dH · wH · pdH (×3). Several reasons at one price are easy to spot.
The distance table
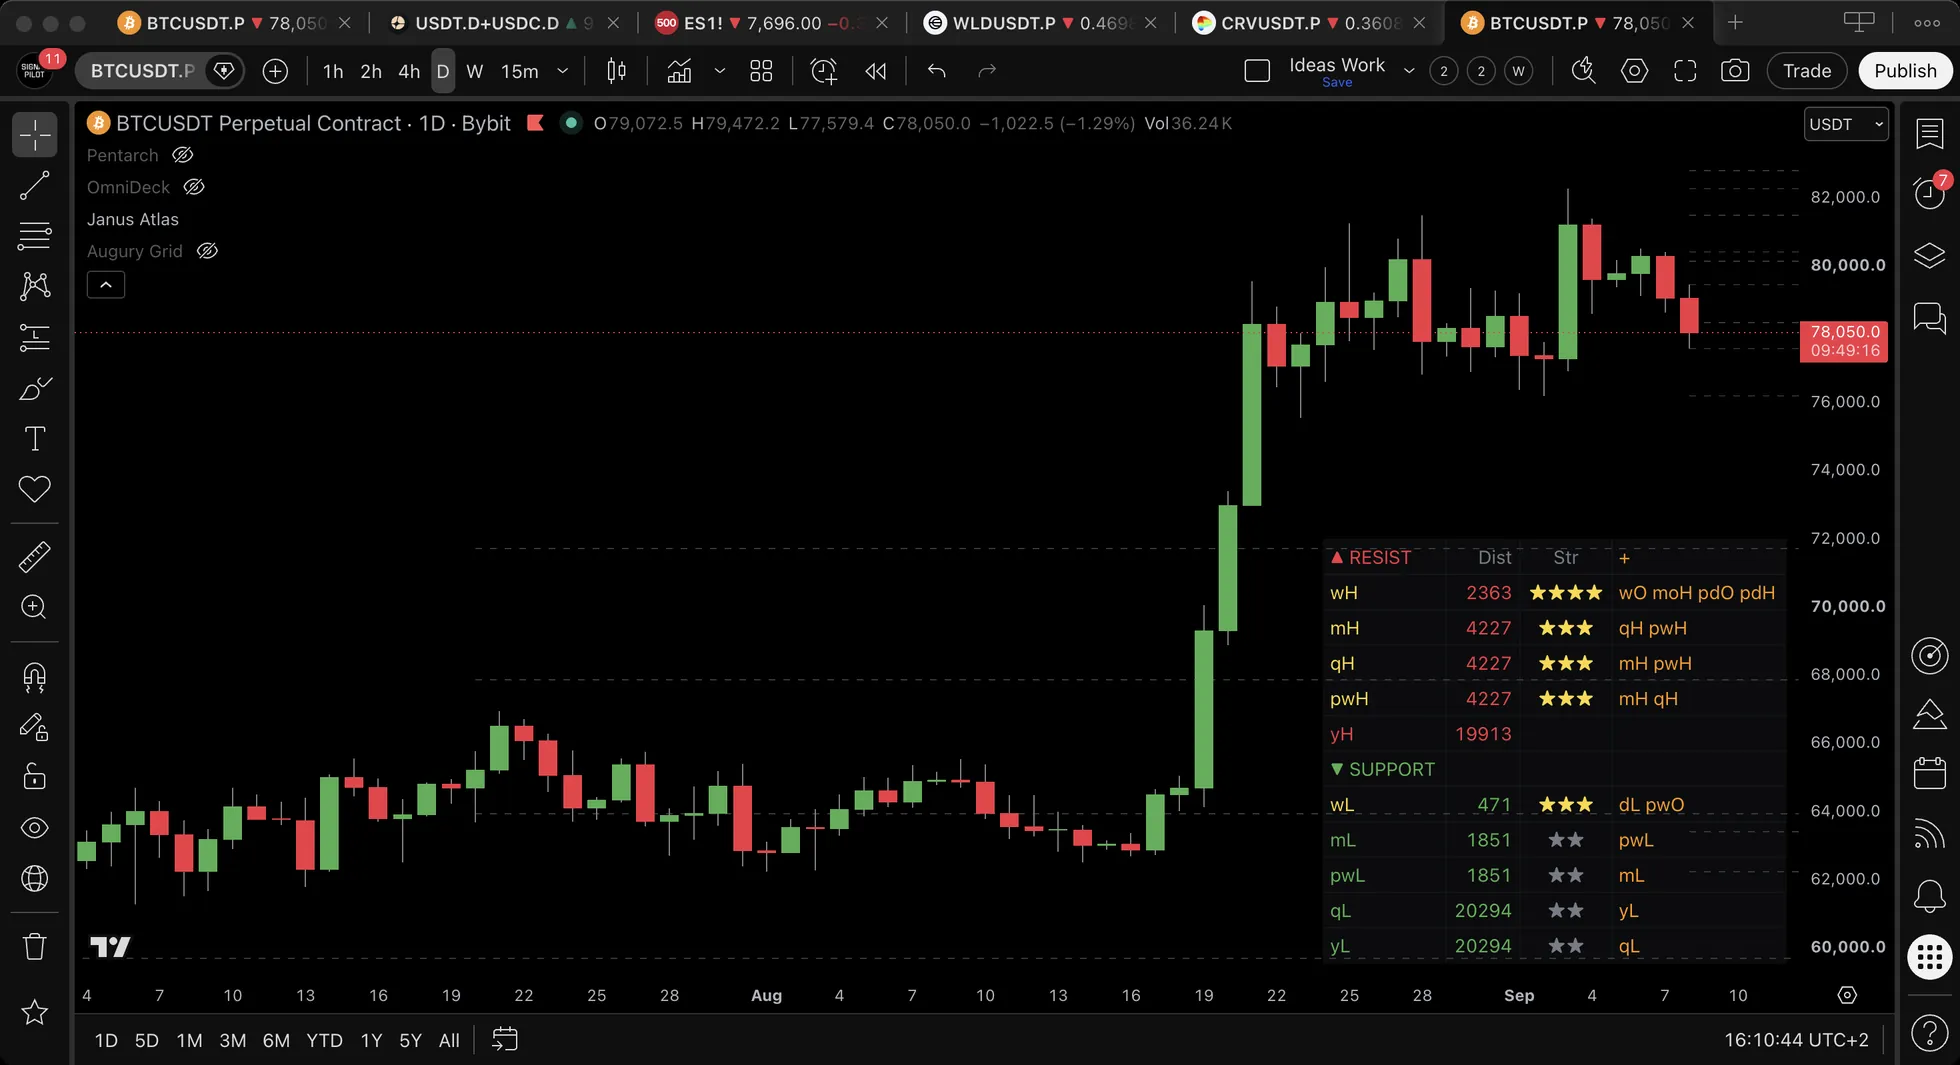
| Column | What it tells you |
|---|---|
| Level | The level's name |
| Dist | How far it is from the current price |
| Str | Stars: one for the level, one more for each other level within 0.15% of it, up to four. They count names, not separate reasons |
| The last column | The names of those other levels, including ones not drawn (like session highs) |
Swings and breaks
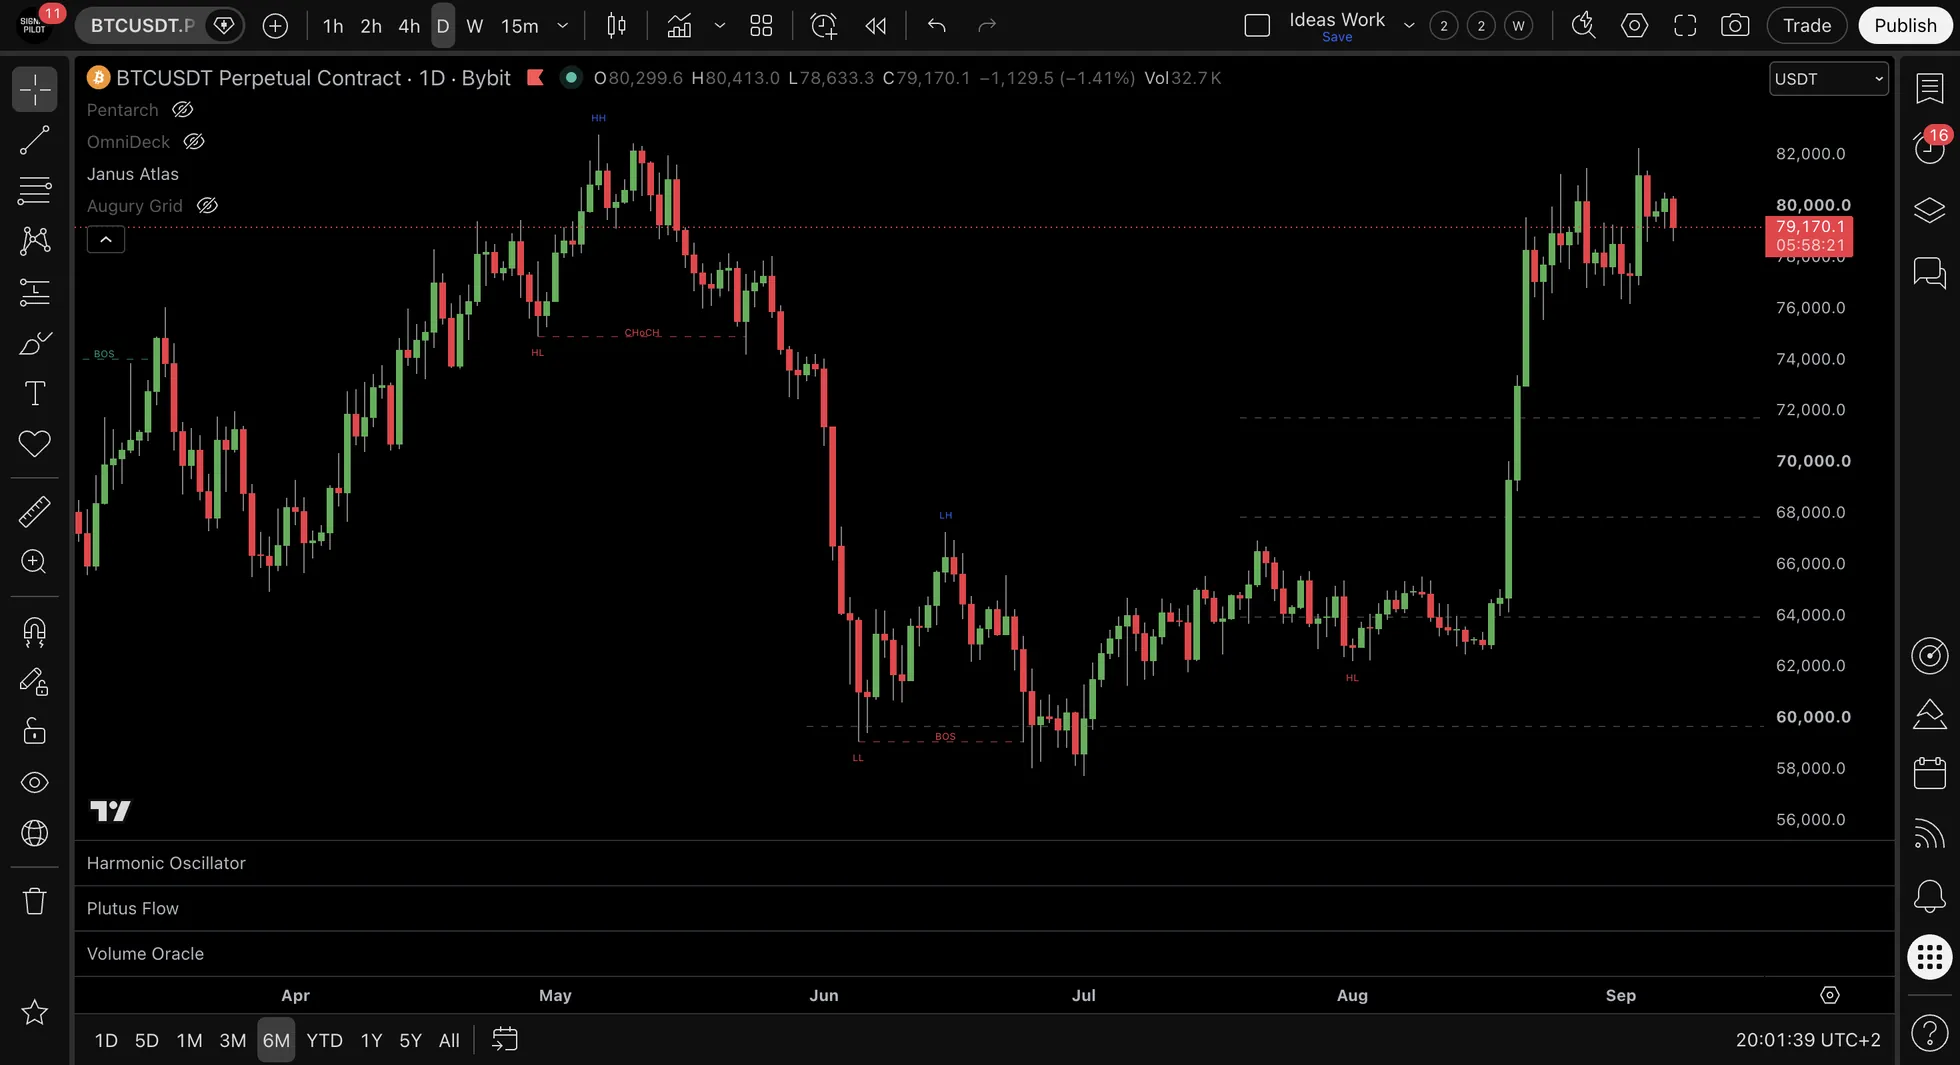
| Mark | Means |
|---|---|
| HH · LH | A higher high, or a lower high |
| HL · LL | A higher low, or a lower low |
| CHoCH | Change of character: price goes past the last swing against the trend Janus was tracking, and the trend flips |
| BOS | Break of structure: price goes past the last swing with the trend |
A swing needs bars on both sides of it: on the hourly chart, ten. So a swing label appears once those bars have closed, drawn back on the swing's own bar. The number adapts to the chart: twelve on 15 minutes, eight on 4 hours, six on the daily.
Fair value gaps
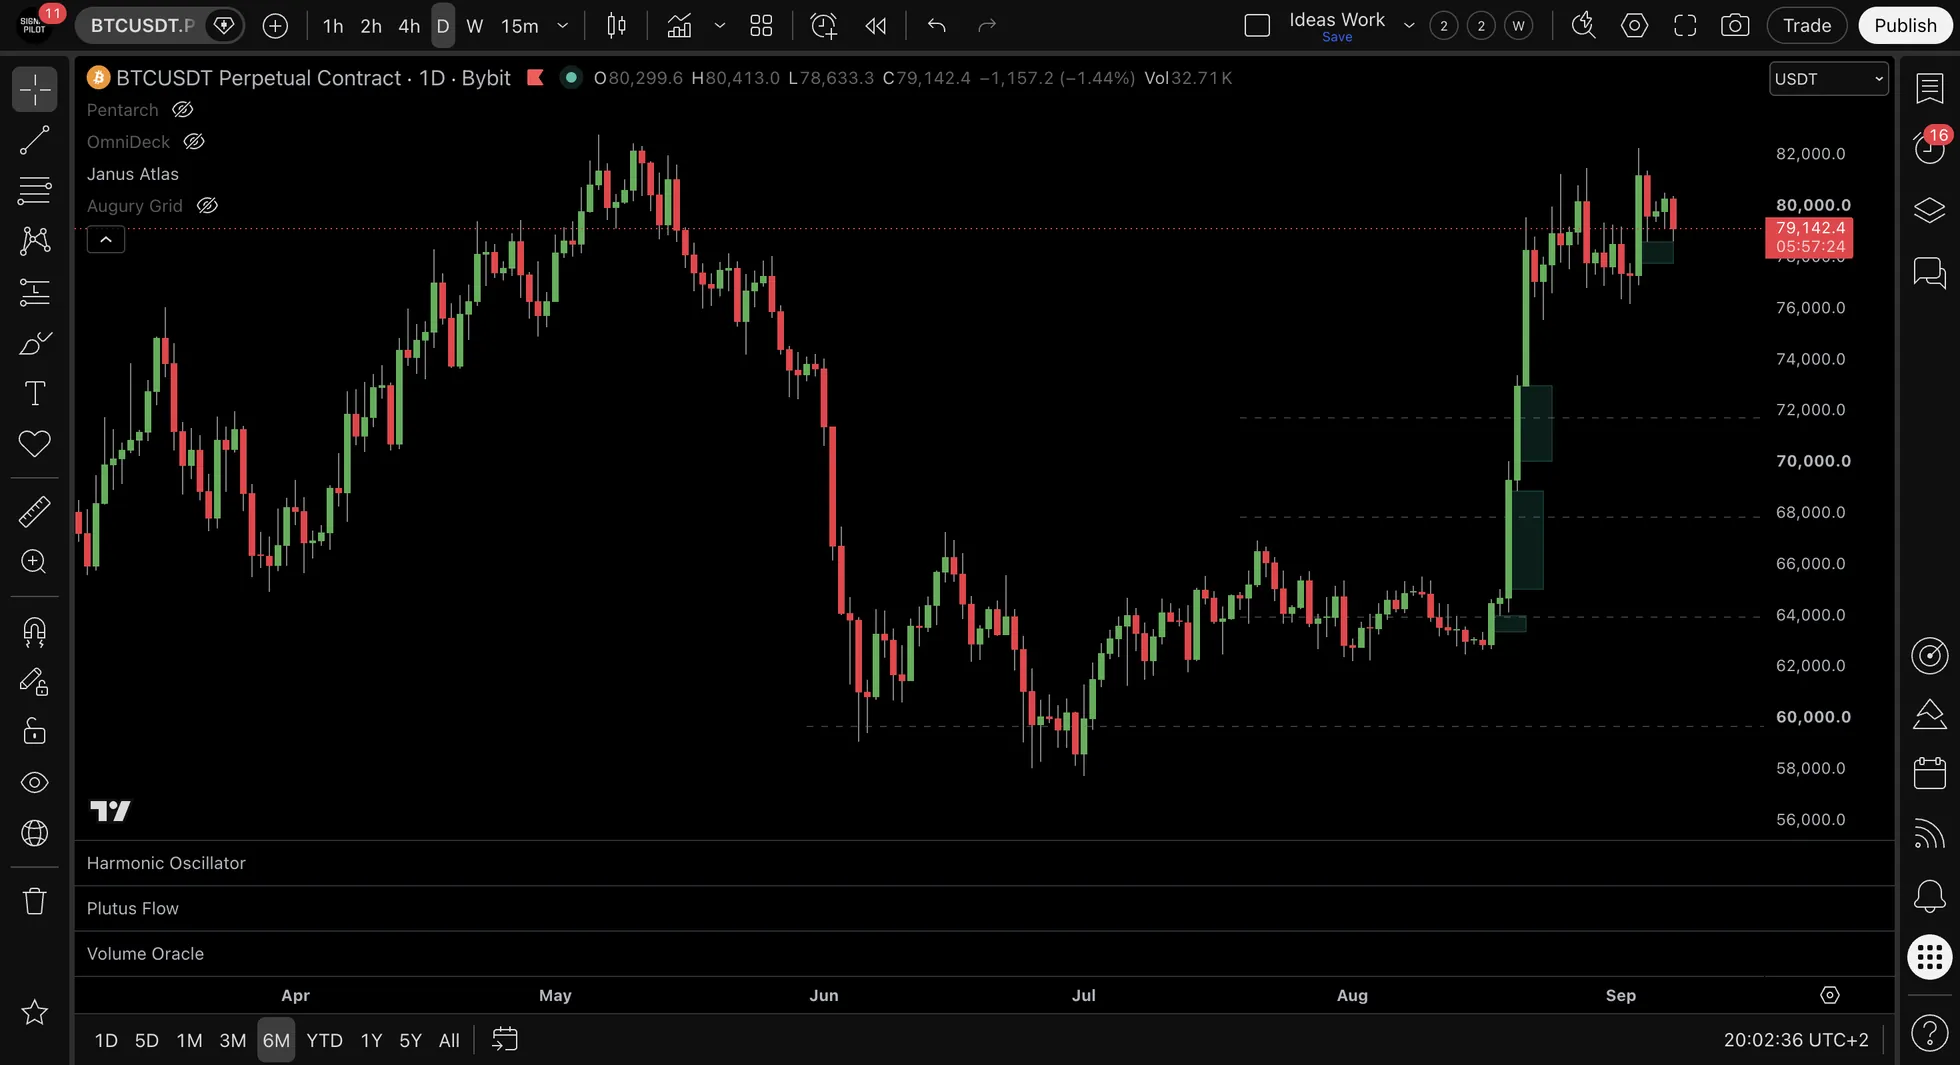
Three bars where price moved so fast that the third bar's low stayed above the first bar's high (or the mirror, down). Janus shades the gap as soon as the third bar opens beyond it, so until that bar closes the box can still change. Once price comes back and touches it, the gap is removed.
Everything else it can draw
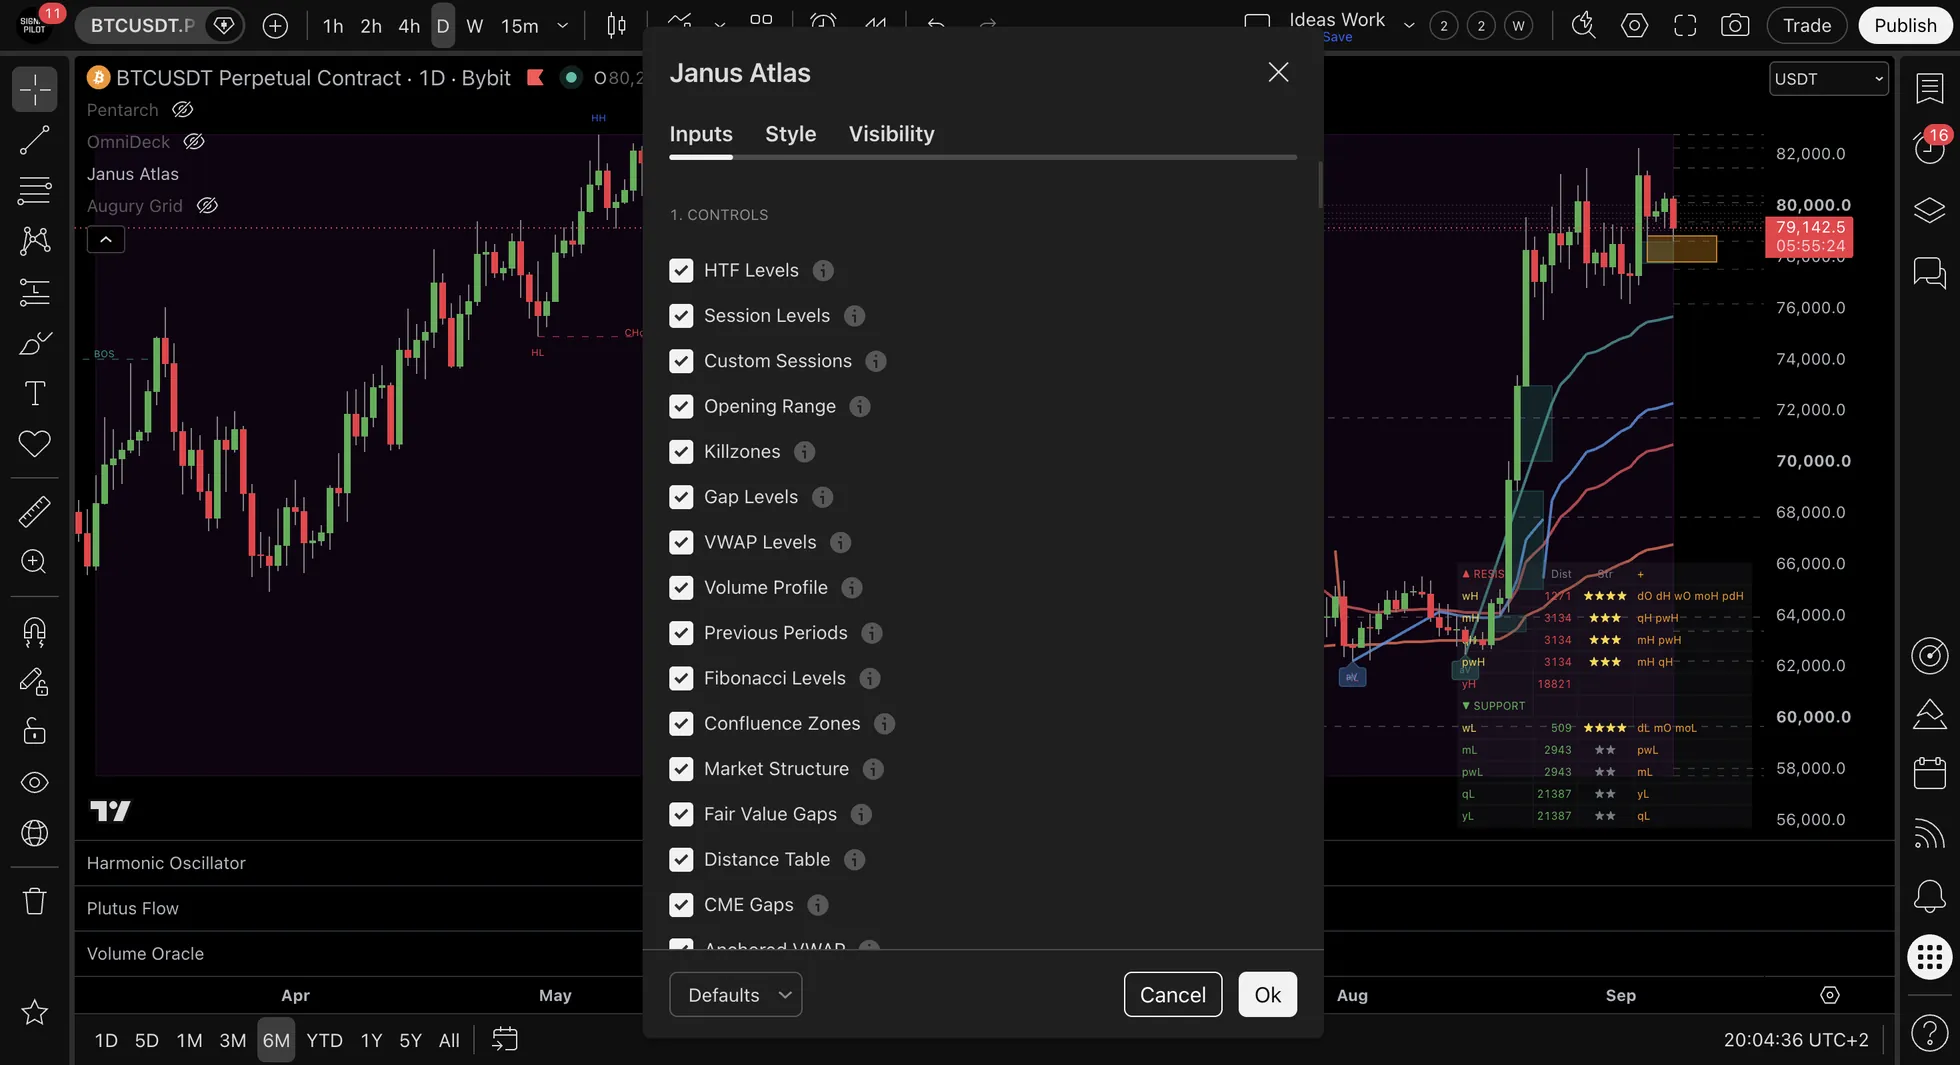
One switch each, at the top of the settings.
| System | What it draws |
|---|---|
| Session Levels | The high and low of the Asian, European and New York sessions, drawn while each is open |
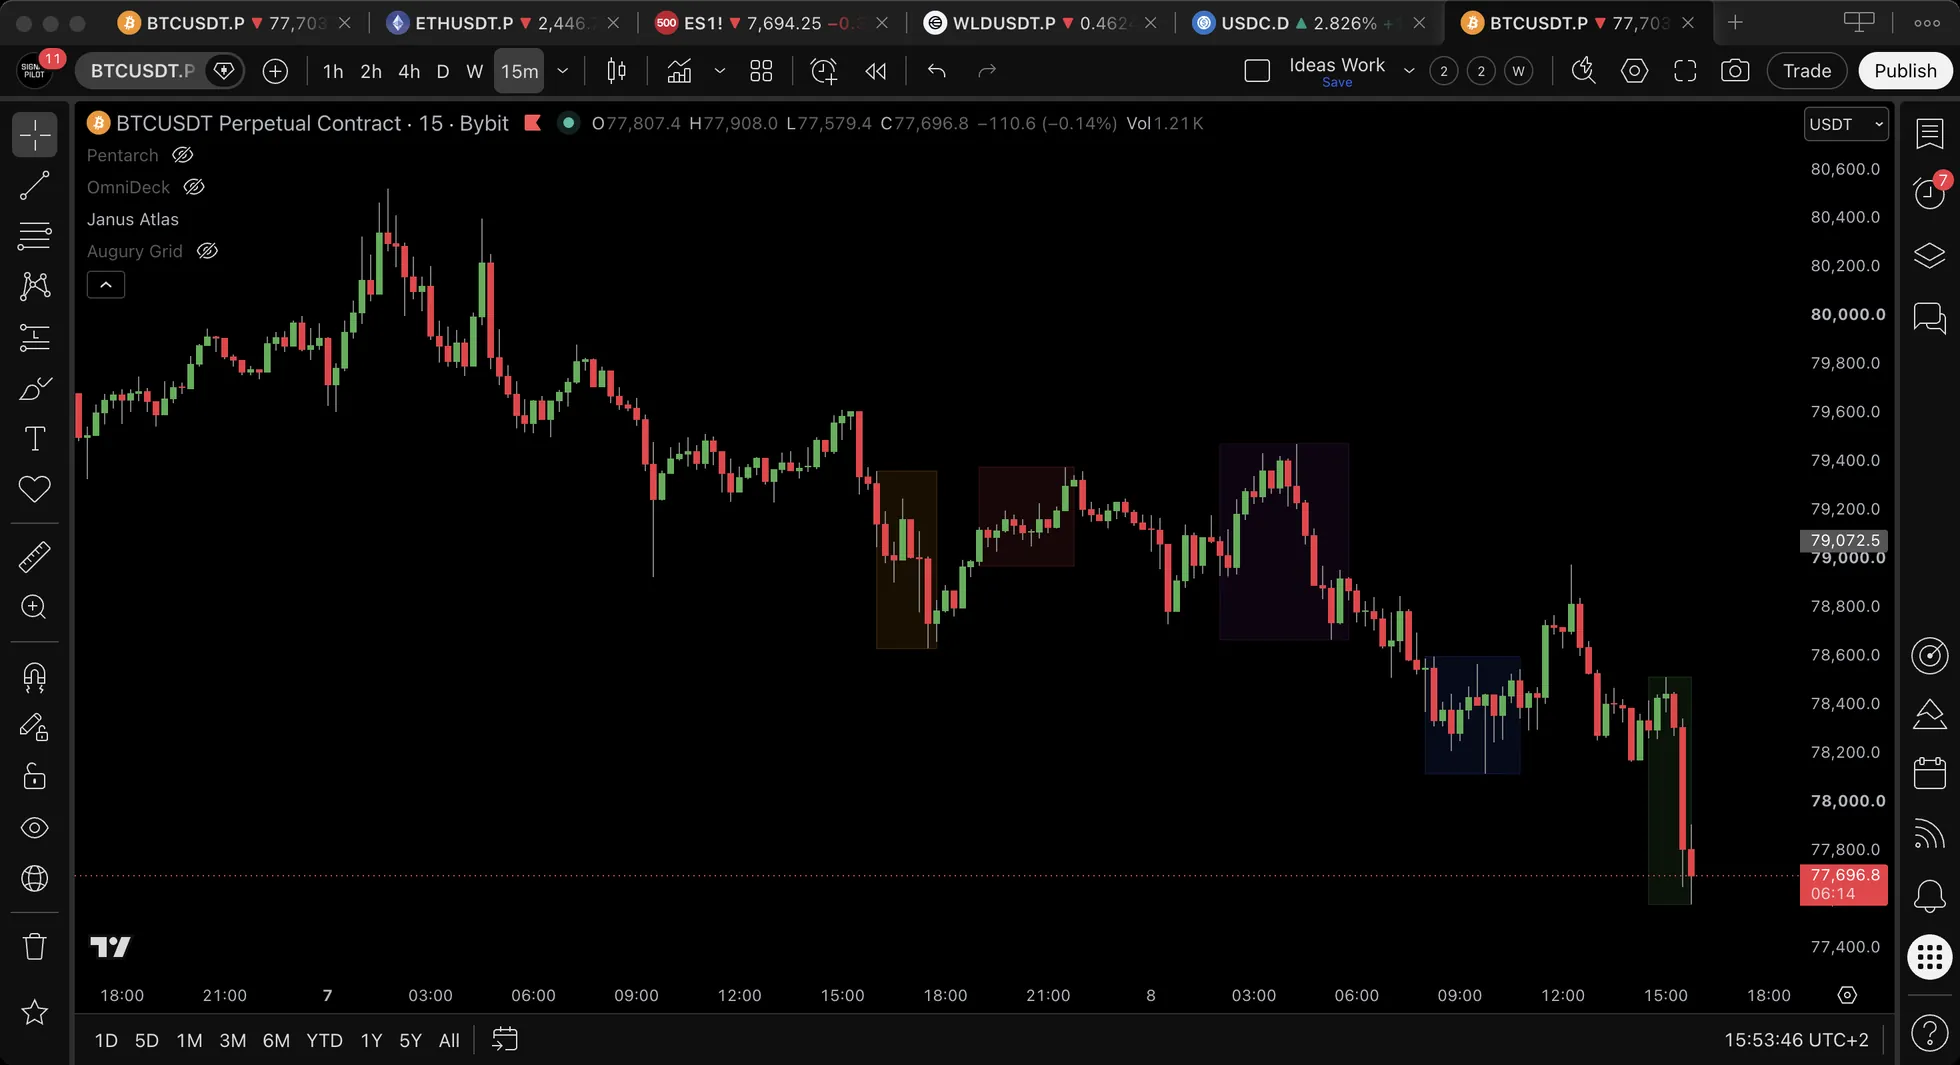
| Killzones | Shaded busy windows: the Asian, London open and New York open (two more you can turn on) |
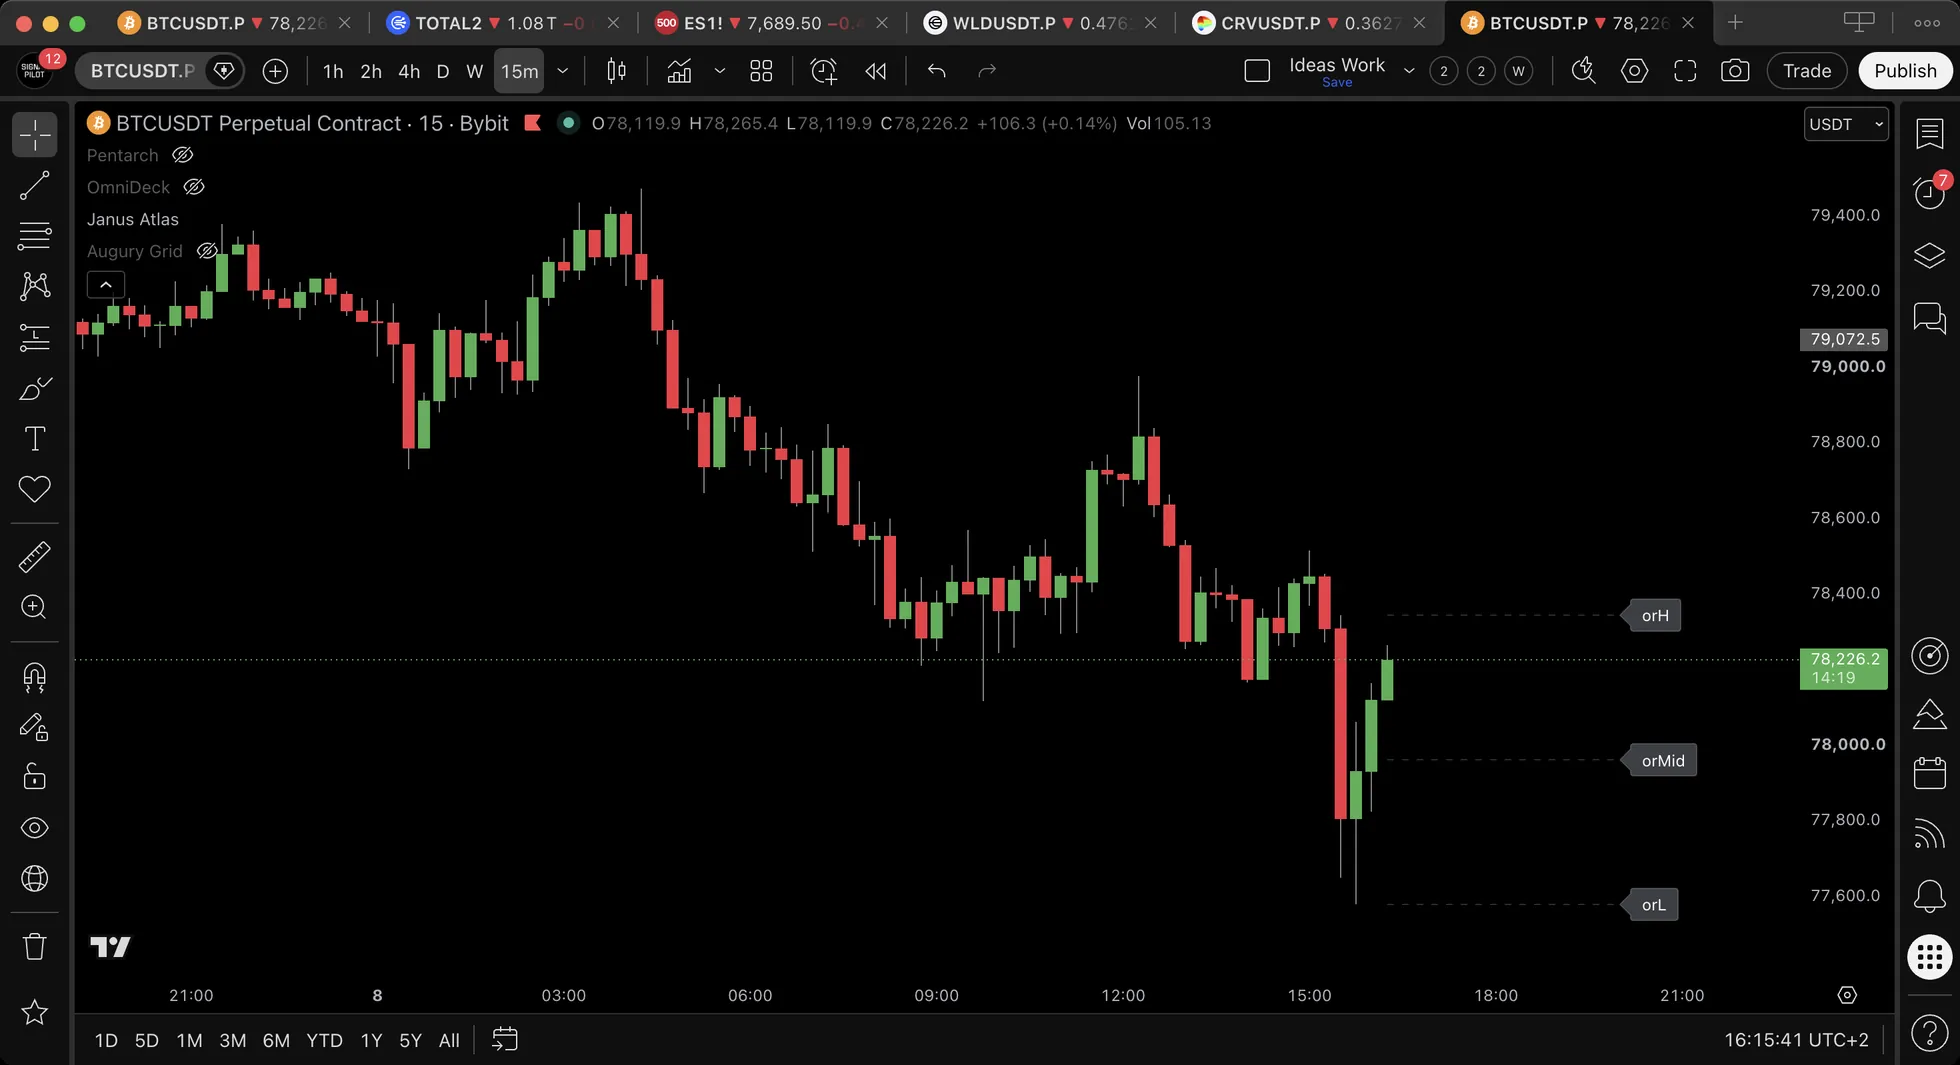
| Opening Range | The high and low of the first 30 minutes of the New York session (or another session) |
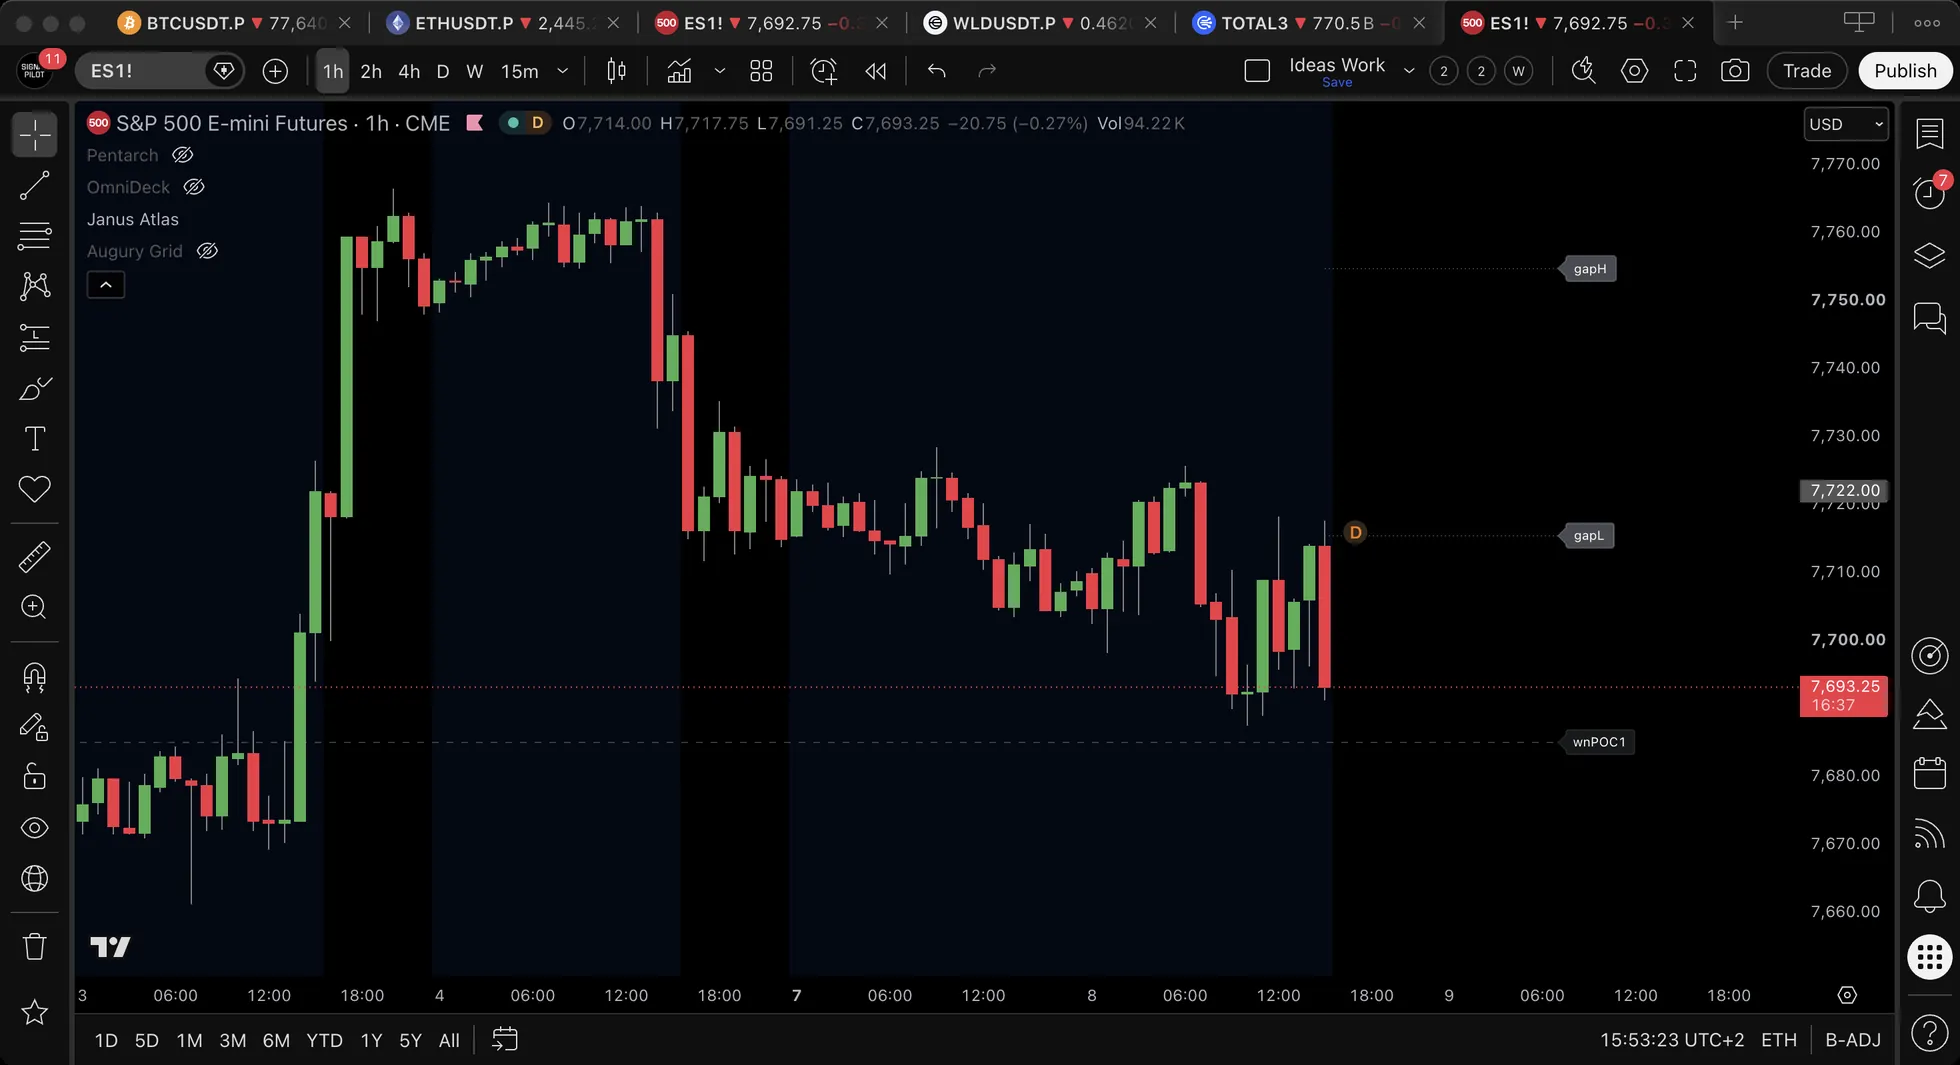
| Gap Levels | Where a stock opened away from yesterday's close |
| VWAP Levels | The average price for the day (on), the week, month, quarter and year, with bands |
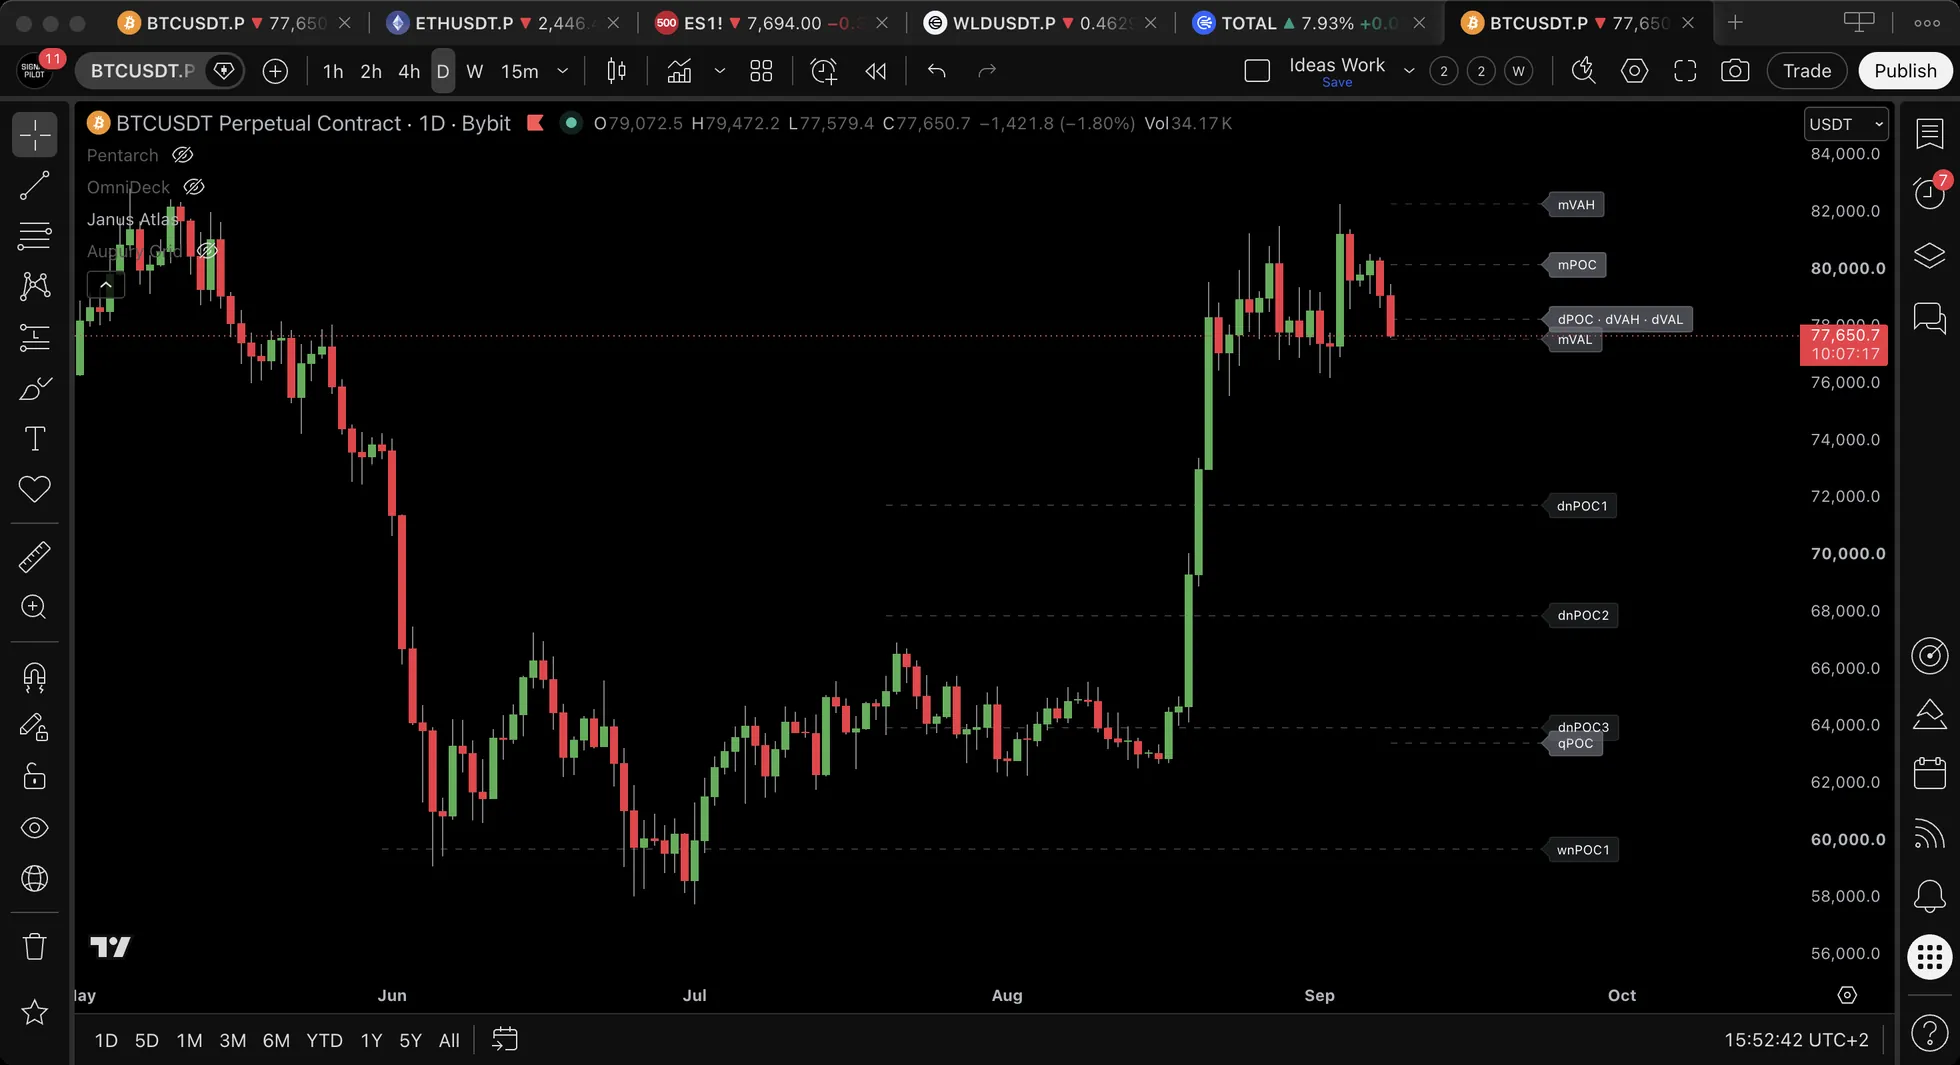
| Volume Profile | The point of control and value area for each period, and naked points of control: busy prices the market hasn't been back to |
| Previous Periods | Last week's, month's, quarter's and year's levels (yesterday's high and low are on by default) |
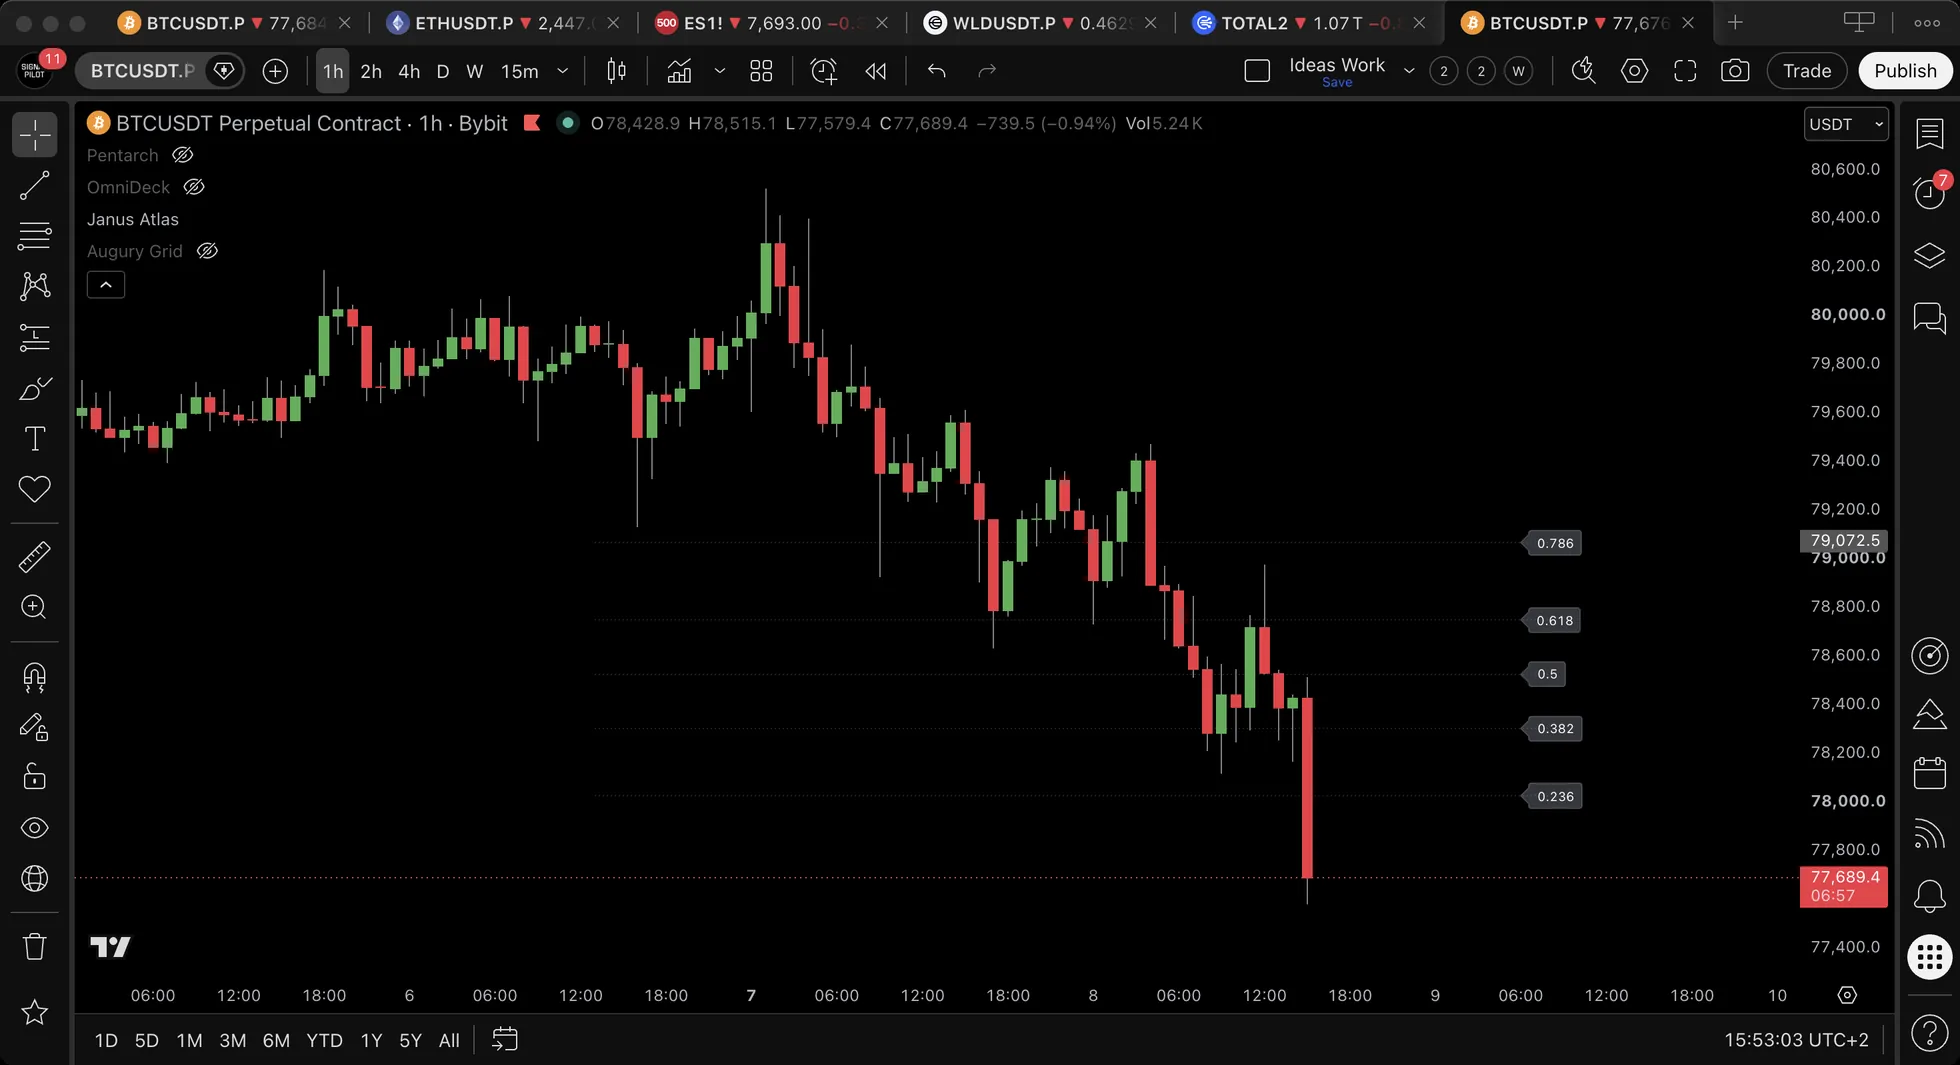
| Fibonacci Levels | Retracements across a range you choose (daily high and low by default) |
| CME Gaps | Gaps left by CME futures that close for the weekend |
| Anchored VWAP | An average price started at a recent swing high or low, or at a date you pick |
| Custom Sessions | Two sessions of your own |
Settings that matter
| Setting | Default | What it changes |
|---|---|---|
| The switches (Controls) | 7 of 16 on | Which systems draw |
| HTF Levels | Daily and Weekly H, L | Open, high, low and middle for the day, week, month, quarter, year and Monday, each on or off |
| Previous Periods | Yesterday's H, L | The same for the periods before |
| Label Combine % | 0.15 | How close levels must be to share a label |
| Session Timezone | America/New_York | The clock for killzones, custom sessions and the custom opening range |
| Distance Table: Position · Layout · Text Size · Levels Shown | Bottom Right · Vertical · Tiny · 12 | Where the table sits and how much it lists. On a phone: Compact |
| Fair Value Gaps: Show · Mitigation | Unmitigated · Wick | Hide filled gaps; a wick touch fills one |
Alerts
58 alerts. The level touches are checked when the bar closes; in the alert window, pick Once Per Bar Close to get the others on closed bars too.
| Group | Alerts |
|---|---|
| Today, yesterday, this week | Touches of dO, dH, dL, pdO, pdH, pdL, wO, wH, wL, and Monday's open, high and low |
| Longer periods | Monthly, quarterly and yearly levels; previous week, month, quarter and year |
| Sessions and the open | Session highs and lows, custom sessions, the opening range |
| VWAP and volume | Daily, weekly and previous VWAPs; POC, VAH and VAL; naked POCs |
| Structure | CHoCH and BOS, bullish and bearish; new fair value gaps |
| Gaps | Gap high, gap low, gap filled; CME gap new and filled |
| The rest | Fibonacci level touched, confluence zone, anchored VWAP touches |
Good to know
- A level is a place, not a promise. Price reaches it, and either it holds or it breaks.
- Stars count names. Four stars means four labels at one price, not four times the importance.
- Swings arrive late by design. A swing label needs the bars after it to close first.
- Read it with the others. Pentarch shows where the cycle stands, Volume Oracle who is driving the move.
Learning guide
Read it in order, with real examples and the common misreads: open the learning guide (2 minutes).
📞 Support
Technical Questions: support@signalpilot.io
Deepen your understanding with these articles from the Signal Pilot Blog:
Learn how key levels form and influence price action
Volume Flow AnalysisFollow volume footprints through the market
The Only Pattern That RepeatsIdentify the universal structure behind market movements
💬 Need Help?
Have questions about Janus Atlas? Join our Discord community to get help from experienced users, share setups, and discuss approaches!
See Also
Related Pages:
- Pentarch - Combine structural levels with cycle timing events
- OmniDeck - Ten systems on one overlay; it reads structure through zones and moving averages, not through plotted levels
- Janus Atlas Quick Reference - One-page cheat sheet
- How to Set Up Alerts - Get notified when price reaches key levels
- Analysis Workflow - How Janus Atlas fits into complete analysis workflow
Disclaimer: Janus Atlas draws levels from past price and volume; it does not predict. Results vary. Past performance does not guarantee future results. This is not financial advice.