Use the Multi-Symbol Screener (Augury Grid)
⚠️ EDUCATIONAL CONTENT
This guide shows how to use the Augury Grid screener tool for educational purposes only. This is NOT investment or trading advice. All examples are hypothetical and for illustrative purposes.
Goal: Monitor 7 different instruments across 3 timeframes simultaneously on one chart instead of flipping between watchlists.
What Can Be Learned: - Setting up a 7-symbol watchlist - Reading the screener table with star ratings - Reading for ★★★ rows, meaning a score of 95 or above - Acting on fresh opportunities
Time: 5-10 minutes
✅ Prerequisites (Before You Begin)
Make sure you have these ready before using Augury Grid:
🔴 Required
| Requirement | Details | Why It's Needed |
|---|---|---|
| TradingView Account | Any tier (Free, Essential, Plus, Premium) | Augury Grid works on all TradingView account tiers. |
| Augury Grid Indicator Access | Included with Signal Pilot subscription | Requires access to the Augury Grid v1.0 indicator. |
| Basic Symbol Knowledge | Understanding of ticker formats (e.g., BINANCE:BTCUSDT, NASDAQ:AAPL) | Symbols are configured in TradingView format. |
| 5-10 Minutes | Time for initial setup and testing | First-time setup takes ~10 minutes. Daily usage takes ~2 minutes. |
🟡 Highly Recommended
| Item | Purpose | Notes |
|---|---|---|
| Watchlist Prepared | Know which 7 symbols you want to monitor | Have your crypto/stocks/forex watchlist ready. Examples: BTC, ETH, SPY, QQQ, EURUSD. |
| Understanding of Ticker Formats | Know how to write symbol names correctly | Crypto: BINANCE:BTCUSDT, Stocks: NASDAQ:AAPL, Forex: FX:EURUSD |
💡 Ticker Format Quick Reference
TradingView requires specific formats:
- Crypto: BINANCE:BTCUSDT, COINBASE:ETHUSD
- Stocks: NASDAQ:AAPL, NYSE:TSLA
- Forex: FX:EURUSD, OANDA:GBPUSD
- Futures: CME:ES1! (S&P 500), CME:NQ1! (Nasdaq)
Tip: Right-click any symbol → Copy Symbol to get exact format.
If you have Augury Grid access and a watchlist ready, continue to the next section.
What Is Augury Grid?
Augury Grid v1.0 is an on-chart multi-symbol screener table. It monitors 7 symbols × 3 timeframes = 21 scans simultaneously and displays:
- Live signals (Bull/Bear) with star ratings (★★★/★★/★)
- Multi-TF confluence (🔗 = 2 TFs, 🔗🔗 = 3 TFs aligned)
- Entry, SL, TP levels and P&L tracking
- Signal age (how fresh it is)
Best for: Multi-asset analysis, portfolio management, finding setups across watchlists
📖 Full documentation: Augury Grid - Multi-Timeframe Scanner
Quick Setup (3 Steps)
Step 1: Add Augury Grid to Chart
- Open any chart in TradingView
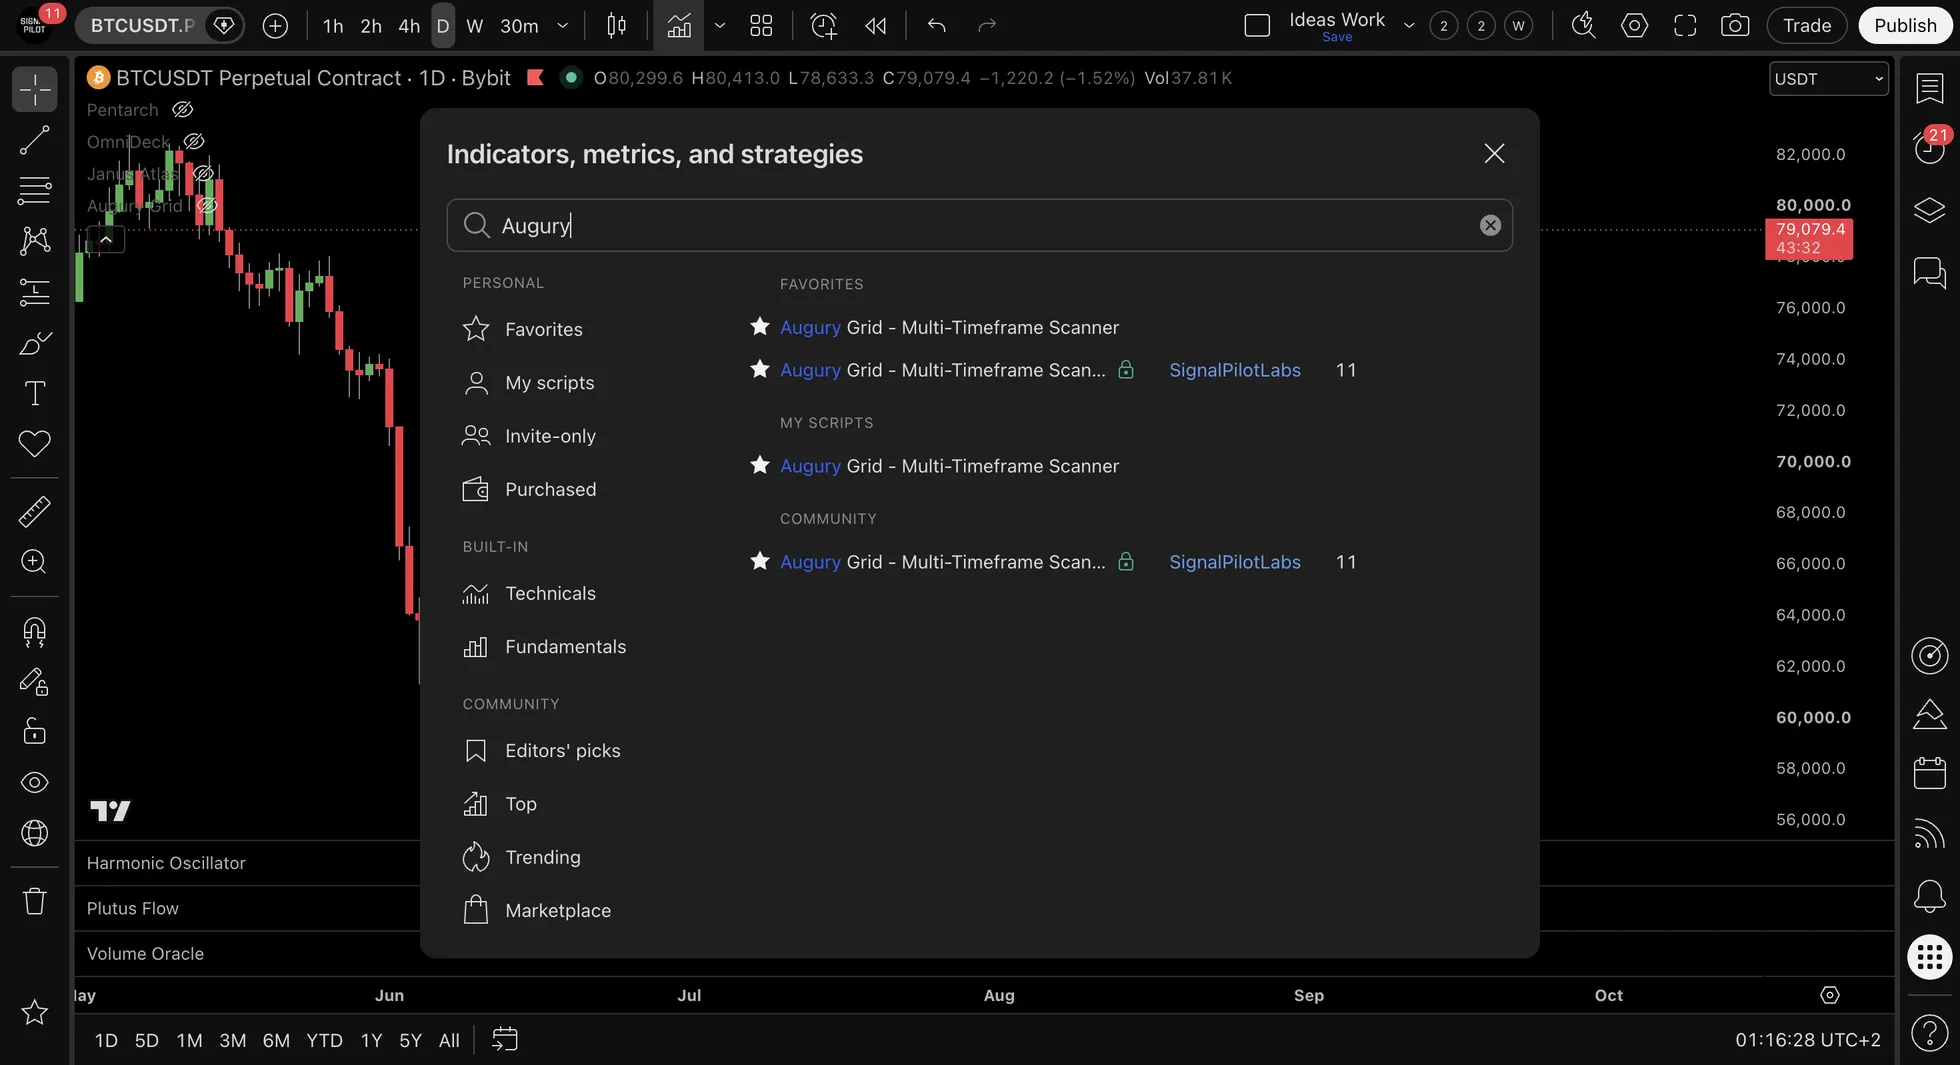
- Click Indicators → Search for "SP: Augury Grid"
- Add "SP: Augury Grid v1.0"
What you'll see: A table appears showing 7 symbol slots across 3 timeframes
Step 2: Configure 7 Symbols
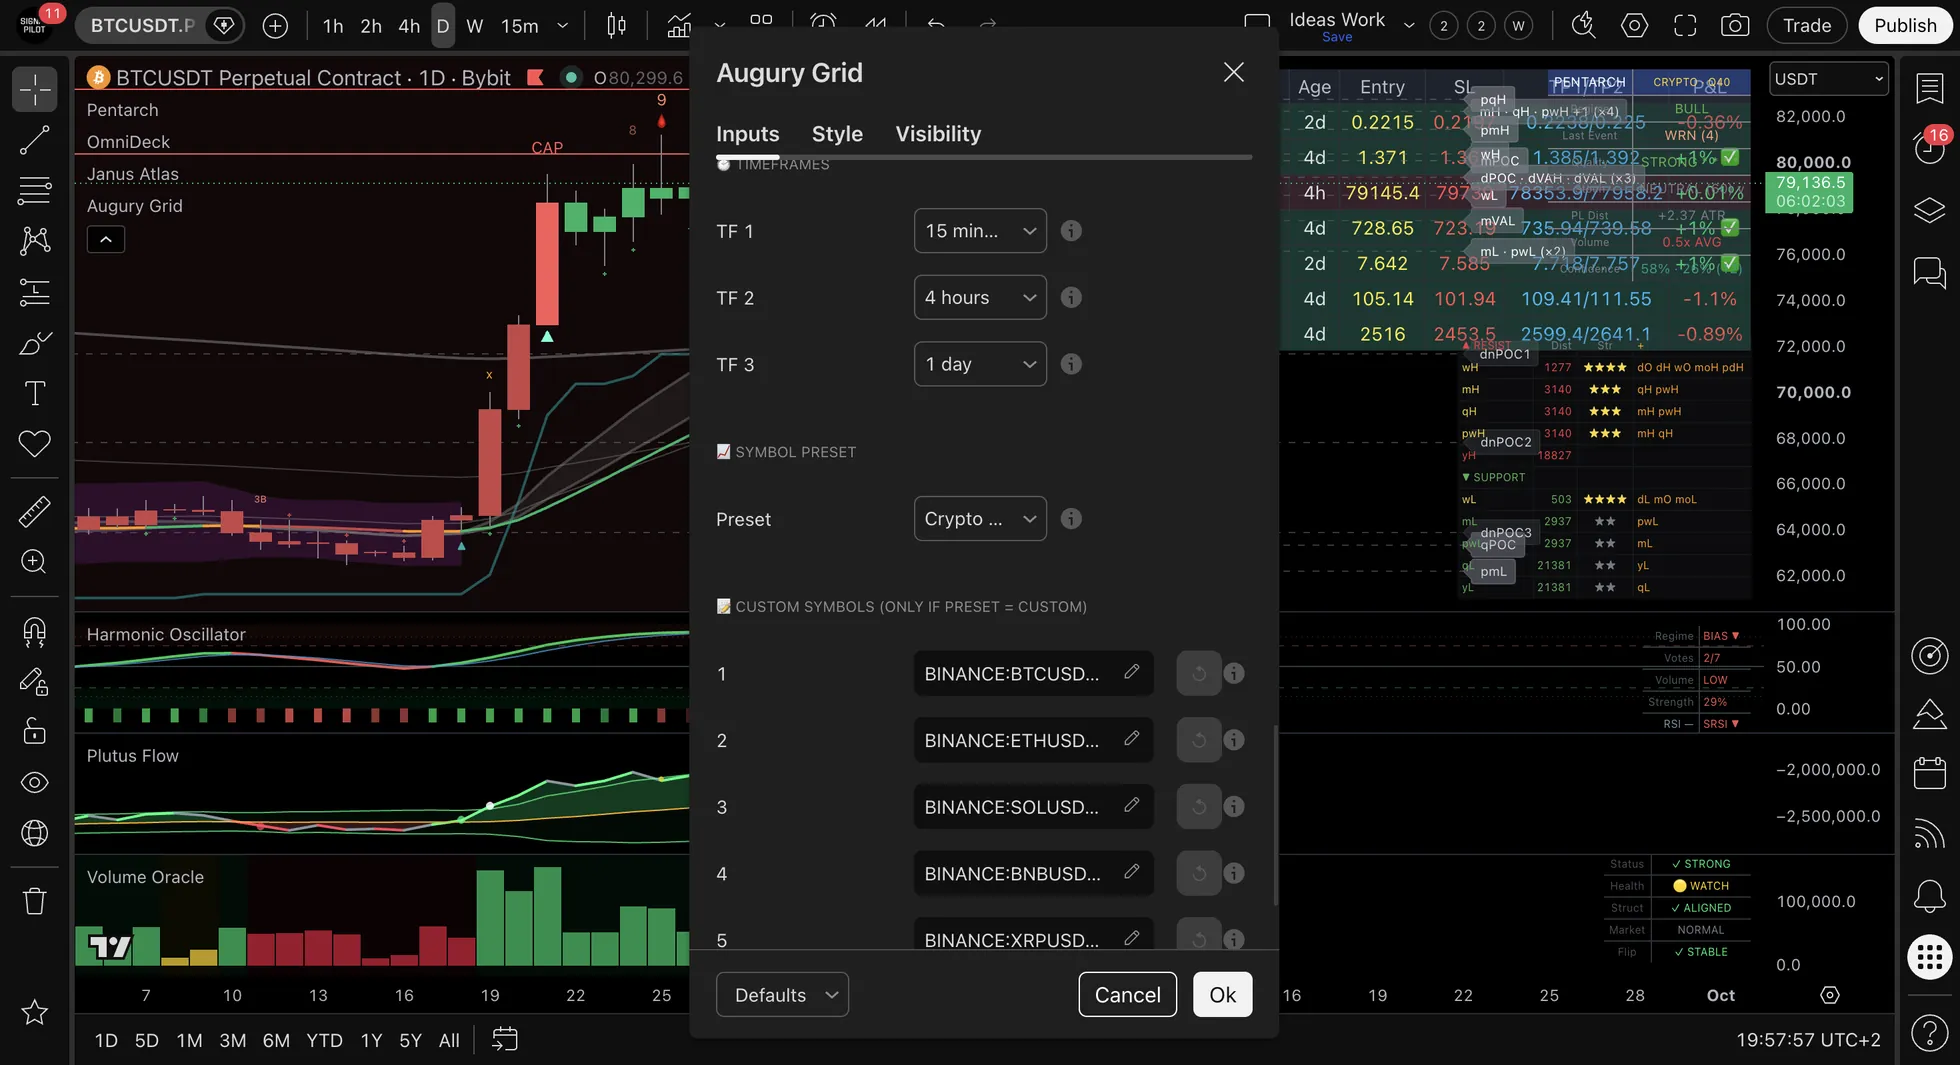
- Click the indicator name → Settings (gear icon)
- Scroll to Symbol Configuration
- Enter 7 tickers (use the exact TradingView format):
Example multi-asset watchlist:
Symbol 1: BINANCE:BTCUSDT
Symbol 2: BINANCE:ETHUSDT
Symbol 3: NASDAQ:AAPL
Symbol 4: NYSE:SPY
Symbol 5: NASDAQ:QQQ
Symbol 6: NASDAQ:TSLA
Symbol 7: CME_MINI:ES1!
Format requirements:
- Include the exchange prefix: BINANCE:, NASDAQ:, NYSE:, etc.
- Use the exact TradingView ticker format
- Test each ticker on a chart first to verify it works
Step 3: Set Quality Filter (Optional)
Minimum Confluence Score: - Default: 70 (everything the hard filters let through) - Common starting point: 85 (★★ and better) - Conservative: 95 (★★★ only)
ADX Threshold: - Default: 20 (works for most setups) - Higher (25-30): Only strong trends - Lower (15): More signals, each clearing a weaker trend test
Click OK to save.
How to Read the Grid
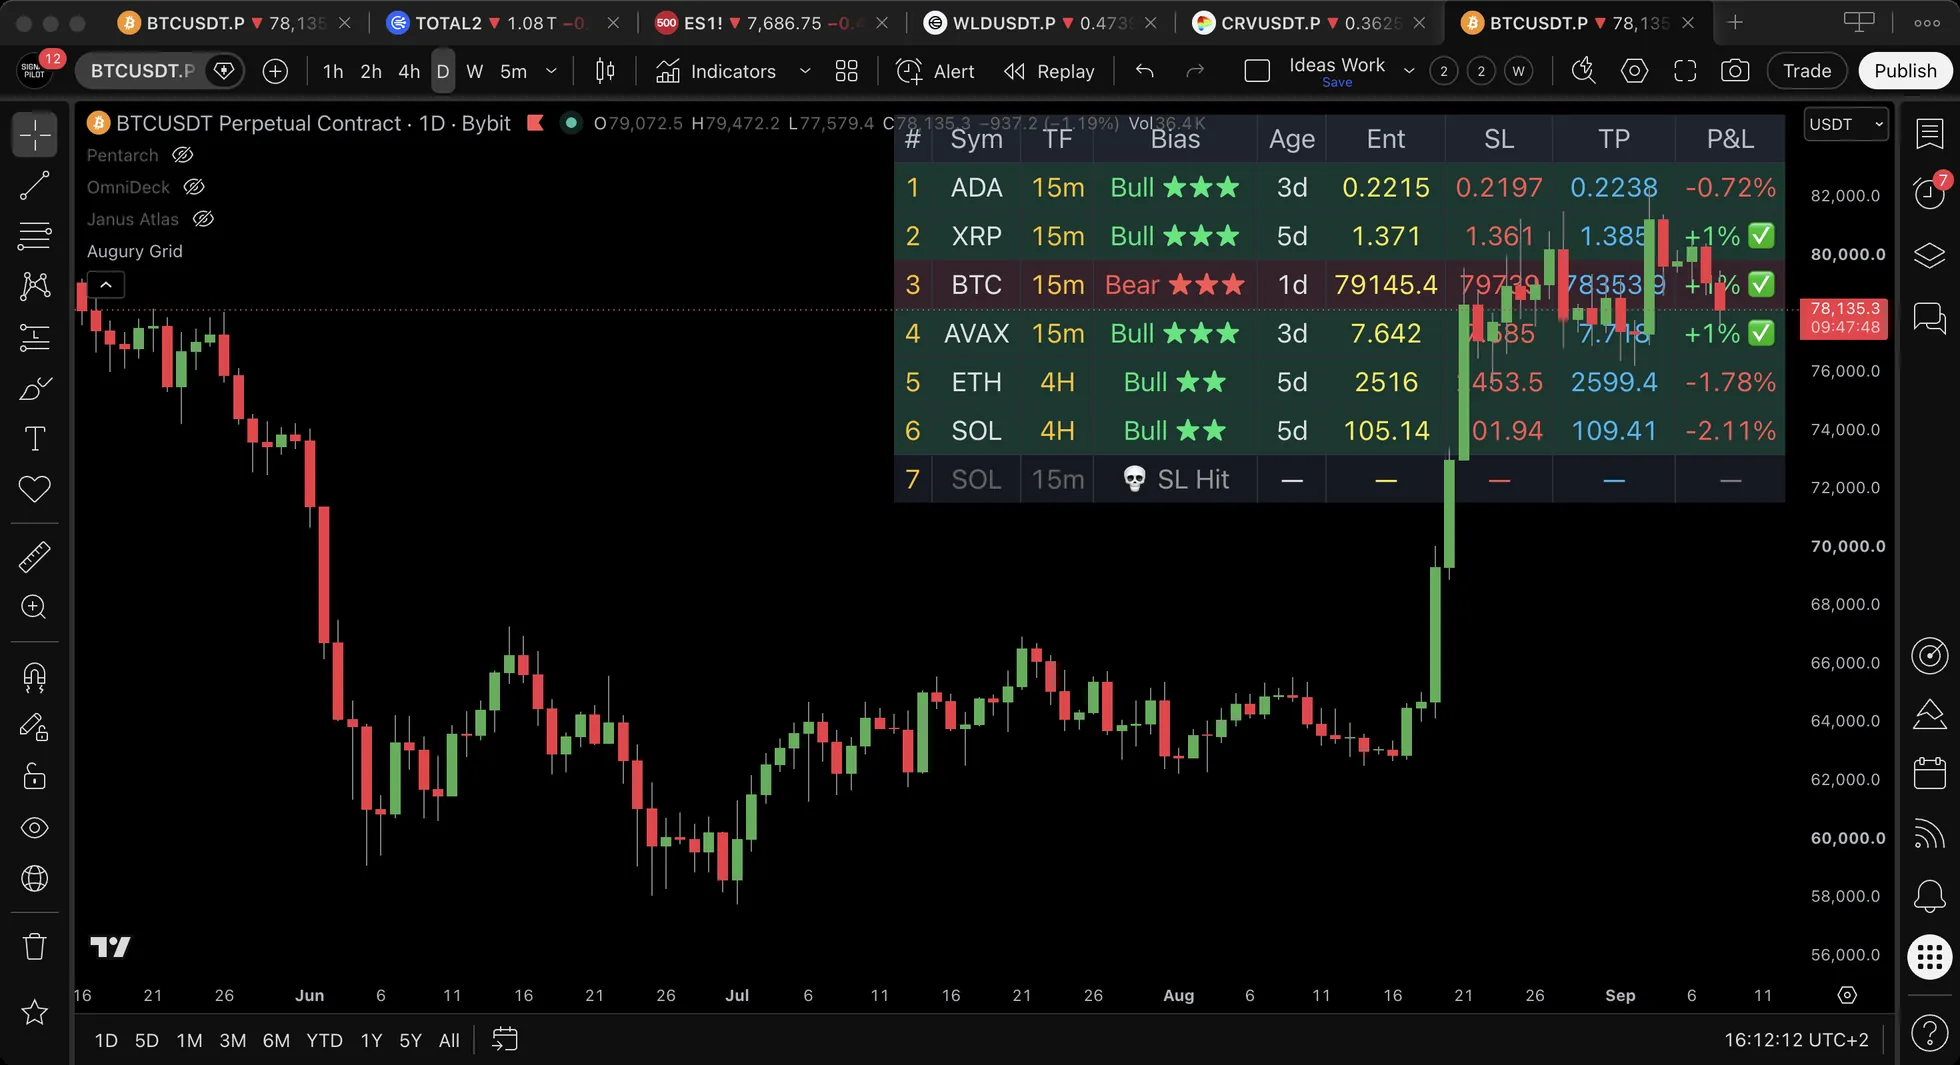
The table shows nine columns for each scan. The headings shorten when Abbreviate is on, which is the default: Sym rather than Symbol, Ent rather than Entry, and TP rather than TP1/TP2.
| Column | What It Shows | Notes |
|---|---|---|
| # | Rank position | Rows are ordered by score, strongest first |
| Sym | Ticker, with the exchange prefix stripped | BTC rather than BINANCE:BTCUSDT.P |
| TF | Which of the three timeframes the reading came from | 15m, 4H and D on the default settings |
| Bias | Bull or Bear, with the star rating | ★★★ (95 and above), ★★ (85-94), ★ (70-84). A 🔗 marks the same direction on two timeframes, 🔗🔗 on three |
| Age | Time since the reading printed | Shown in minutes, hours or days. A row is retired once it passes 30 days |
| Ent | Price when the reading printed | Fixed at that moment, it does not move afterwards |
| SL | Stop level | Entry plus or minus 1.5×ATR by default |
| TP | First target | Entry plus or minus 2.0×ATR by default. Shows TP1/TP2 together when Abbreviate is off |
| P&L | Move since the reading printed | Capped at the stop and target distances. ✅ marks a row that reached its target, ⛔ one that reached its stop |
Workflow: Finding Opportunities
1. Glance at Grid (10 seconds)
Scan for signals: - ★★★ (95 and above) or ★★ (85-94) signals - Age in minutes or hours rather than days, which means the reading is recent - Green P&L (if signal already triggered, it's working)
2. Pick the row to open (30 seconds)
Example:
- ★★★ signal (96) - Fresh (2 bars old) - The P&L column reads +0.3%, so price has moved in the signal's direction since the row printed - The reading: a fresh row, top rated, with price so far agreeing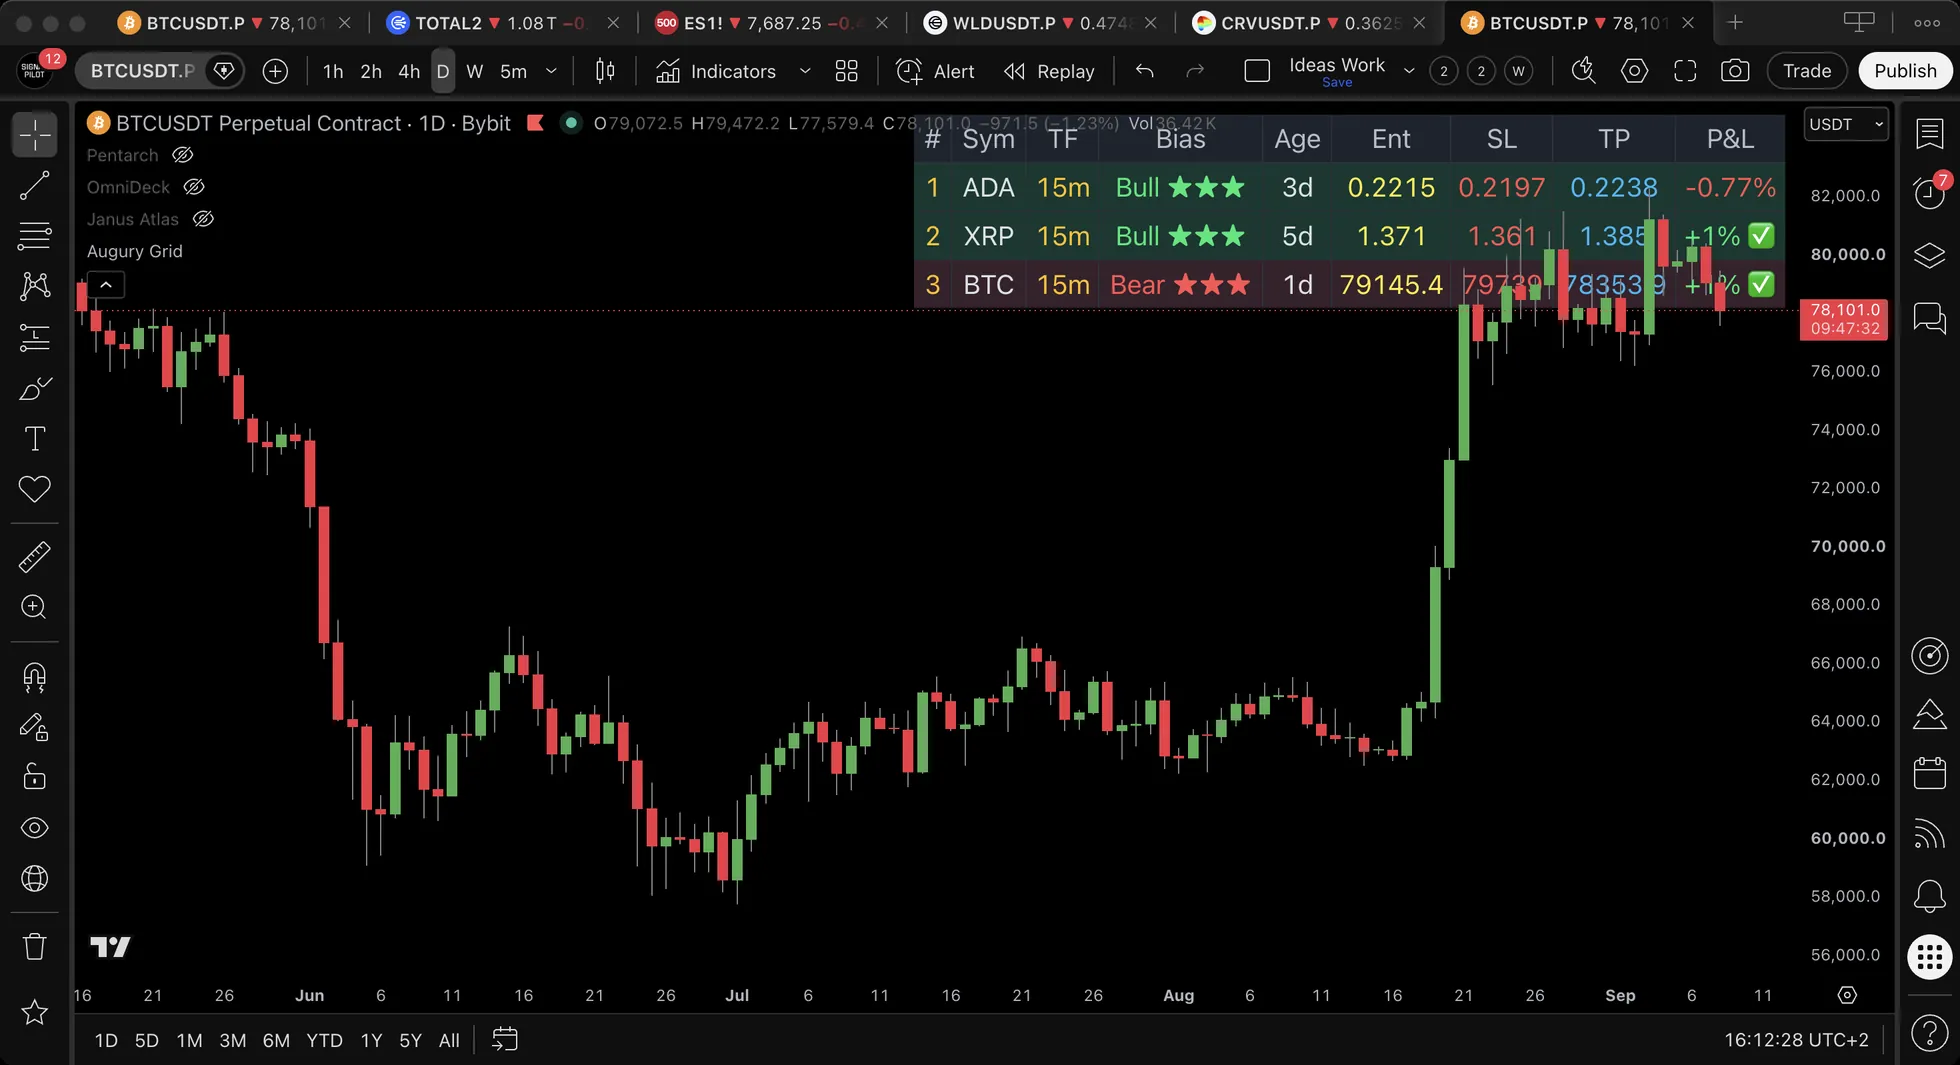
3. Verify on Chart (2 minutes)
Click the chart to load BTC/USD and check the following: - [ ] At support level or key zone? (Use Janus Atlas) - [ ] Volume confirming? (Use Volume Oracle) - [ ] No major resistance overhead? - [ ] Aligns with analysis bias?
4. Further Analysis (Educational Example)
Note: The following are educational examples only - not trading instructions.
- Example entry consideration: Current price or limit order (hypothetical illustration)
- Example stop concept: Below recent low for bullish setups or above recent high for bearish setups (educational example)
- Example target concept: TP1 from Grid as a reference point (illustrative)
- Monitoring approach: watch the P&L column, for educational tracking
Quality Tiers (Educational Reference)
Note: These tiers are for educational understanding only. Not trading recommendations.
| Score | Rating | What it means | Confluence | Educational Example Approach |
|---|---|---|---|---|
| 95-100 | ★★★ | Rare. Almost every factor aligned | Highest | Often considered first (educational example) |
| 85-94 | ★★ | Several bonus factors aligned | Strong | Standard evaluation approach (illustrative) |
| 70-84 | ★ | Meets every hard filter, nothing more | Acceptable | Selective analysis (educational example) |
| Below 70 | Hidden | Filtered out before it reaches the table | Under the threshold | Never displayed |
Common Mistakes & Fixes
- Is the grid table visible? → If no, add the indicator to chart
- Shows N/A or dashes? → Fix ticker format (use EXCHANGE:SYMBOL)
- Not updating? → Refresh the page
- Missing signals? → Wait for bar close
- Scores not showing? → Reset to default settings
Most Common Issue: Wrong ticker format. Always use EXCHANGE:SYMBOL format (e.g., BINANCE:BTCUSDT, not just BTCUSDT).
Mistake #1: Wrong Ticker Format
❌ Problem: Symbols show no data or "N/A"
✅ Fix:
- Use the exact TradingView format: BINANCE:BTCUSDT not BTC or BTCUSD
- Include the exchange prefix
- Test ticker on chart first before adding to Grid
Mistake #2: Acting on Every Signal
❌ Problem: Taking too many trades, overtrading
✅ Fix: - Focus on ★★★ and ★★ signals only - Set Min Score to 85 in settings - Verify chart before entering
Mistake #3: Chasing Old Signals
❌ Problem: Entering when AGE > 15 bars
✅ Fix: - Check AGE column - If >15 bars, signal is likely stale - Look for fresh signals (0-10 bars) instead
Mistake #4: Ignoring P&L Column
❌ Problem: Not checking if signal is working
✅ Fix: - If P&L shows -5% and the age is high, the row is describing a signal that did not hold - If P&L is green and signal is fresh, it's confirming: good sign - Use P&L to validate signal quality
Mistake #5: Not Verifying Context
❌ Problem: Blindly trading Grid signals without chart confirmation
✅ Fix: - Load the chart - Check support/resistance levels - Verify volume and structure - Grid finds opportunities; confirm with context
Advanced Tips
Tip #1: Mix Timeframes
Set different timeframes for each symbol:
Why: Scan multiple horizons simultaneouslyTip #2: Scan Same Ticker, Multiple Timeframes
Why: See multi-timeframe confluence on a single assetTip #3: Use 2 Grid Instances
- Grid 1: 7 crypto pairs (1H)
- Grid 2: 7 stock tickers (4H)
- Total: 14 symbols monitored
How: Add Augury Grid to the same chart twice
Tip #4: Track Performance by Tier
After 20 or more readings, compare the tiers: - Did the ★★★ rows look different afterwards from the ★★ rows? - Did the tiers behave differently on different symbols? - Adjust the Min Score filter based on results
Workflow Example (Real Scenario)
8:00 AM: Grid Check
Grid shows:
AAPL │ BUY  │ 96 ★★★ │ $175.20 │ $177.80 │  1 │ +0.1%
TSLA │ SELL │ 72 ★   │ $245.90 │ $242.10 │ 18 │ -2.3%
BTC  │ BUY  │ 88 ★★  │ $64,250 │ $65,800 │  5 │ +0.8%
Analysis: - AAPL: ★★★ signal (96), fresh (1 bar), already working (+0.1%) ✅ - TSLA: ★ signal (72), stale (18 bars), losing (-2.3%) ❌ Can be skipped - BTC: ★★ signal (88), moderate age (5 bars), working (+0.8%) ✅
Action: Focus on AAPL and BTC
8:05 AM: Load the AAPL chart - At Janus support: ✅ - Volume spike visible: ✅ - No resistance overhead: ✅ - Decision: consider a long on AAPL at $175.50
8:10 AM: Load the BTC chart - Breaking out of consolidation: ✅ - Higher timeframe aligned: ✅ - Decision: consider a long on BTC at $64,300
Throughout day: Monitor the P&L column to track trades
4:00 PM: Results - AAPL hit TP1 at $177.80 (+1.3%) - BTC still running, stop moved to breakeven
Why This Matters
Without Augury Grid:
- Twenty-one charts have to be opened one at a time: seven symbols on three timeframes each
- You might miss signals while looking at other symbols
- No systematic quality scoring available
- Multiple setups are hard to track
With Augury Grid:
- All 7 symbols across 3 timeframes in one glance (10 seconds)
- Quality scores show what's worth investigating
- Track performance in real-time
- Focus on the best opportunities
Bottom line: one table replaces twenty-one chart loads, and the score column says which of them is worth opening.
Common Questions
Q: Can I add more than 7 symbols? A: Not in one Grid (performance limit). Use Symbol Presets for quick watchlist switching.
Q: What if a symbol shows no data? A: Check three things: is the ticker format right, is the exchange prefix there, and is the symbol available on your TradingView plan?
Q: Should I trade every ★★★ signal? A: No. A ★★★ score says the confluence factors line up, not that the trade works. Verify the context and the levels against your own plan first. No system is right every time.
Q: Can I get alerts from the Grid? A: No (table indicators cannot create alerts). Workaround: when a ★★★ signal appears, set a manual alert on that symbol's own chart.
Q: How often does it update? A: Every bar close on configured timeframes. If Symbol 1 is set to 15m, it updates every 15 minutes.
Next Steps
✅ Learning achieved: How to scan 7 symbols × 3 timeframes simultaneously with Augury Grid
Continued learning available: - 📖 Full Augury Grid Documentation - Advanced settings, scoring system details - 📊 Janus Atlas (Support/Resistance) - Verify key levels for Grid signals - 🔔 Set Up Alerts - Alert on individual symbols when the Grid shows a ★★★ signal - 📈 Best Practices Guide - Risk management, workflow optimization
Important consideration: Augury Grid is an opportunity scanner across multiple symbols. It highlights what to investigate. Context verification and execution decisions remain with the trader. Scan smart, trade better.