Augury Grid - Multi-Timeframe Scanner
Augury Grid watches seven markets on three timeframes at once, twenty-one charts, and keeps one table: the markets that have just lined up, with their entry, stop and targets, and for the rest, what each one is still waiting for. It gives you attention, so you can spend your own on the few that matter.
 Watch it explainedOn our YouTube channel: every part shown on real charts, in TradingView Bar Replay.8:16
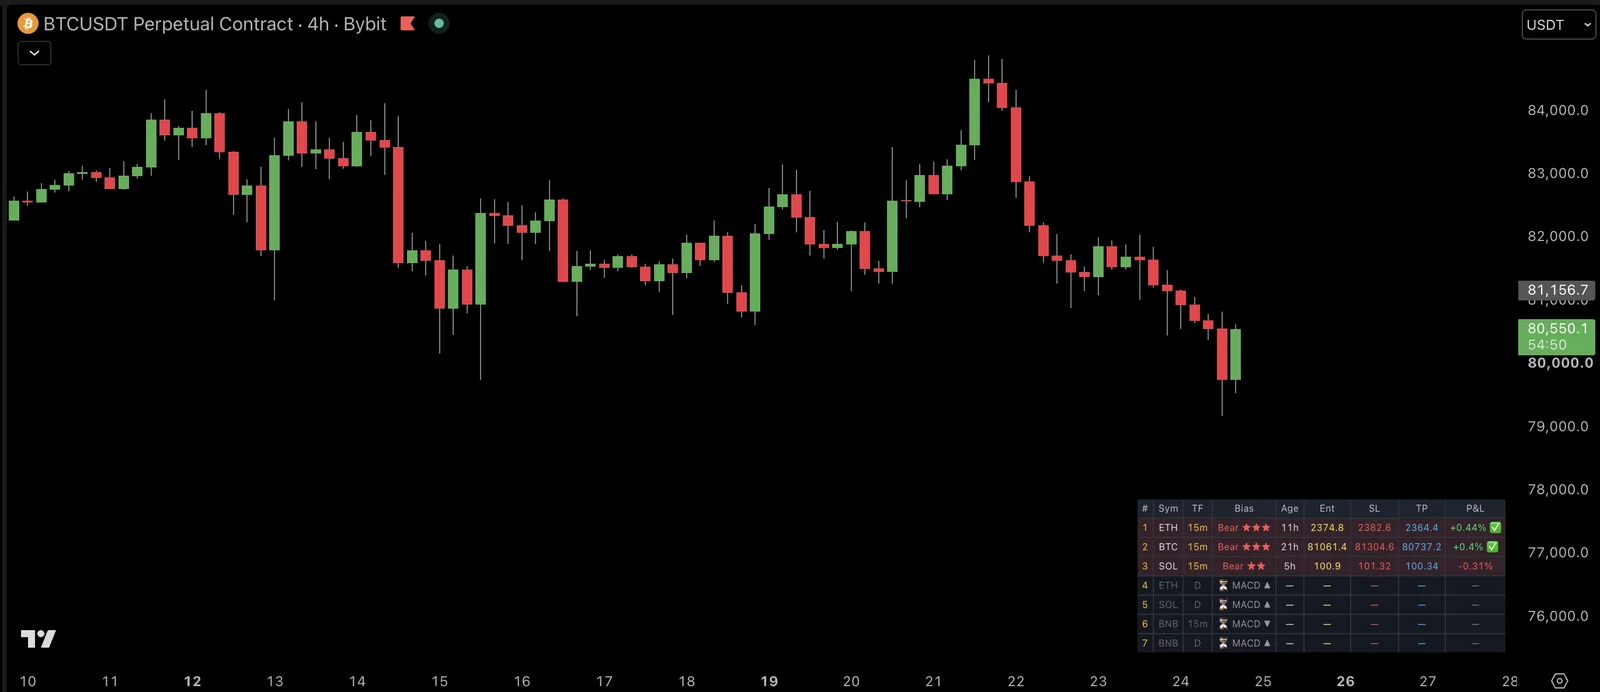
Reading a row
| Column | What it shows |
|---|---|
| # · Symbol · TF | The market and the timeframe it lined up on |
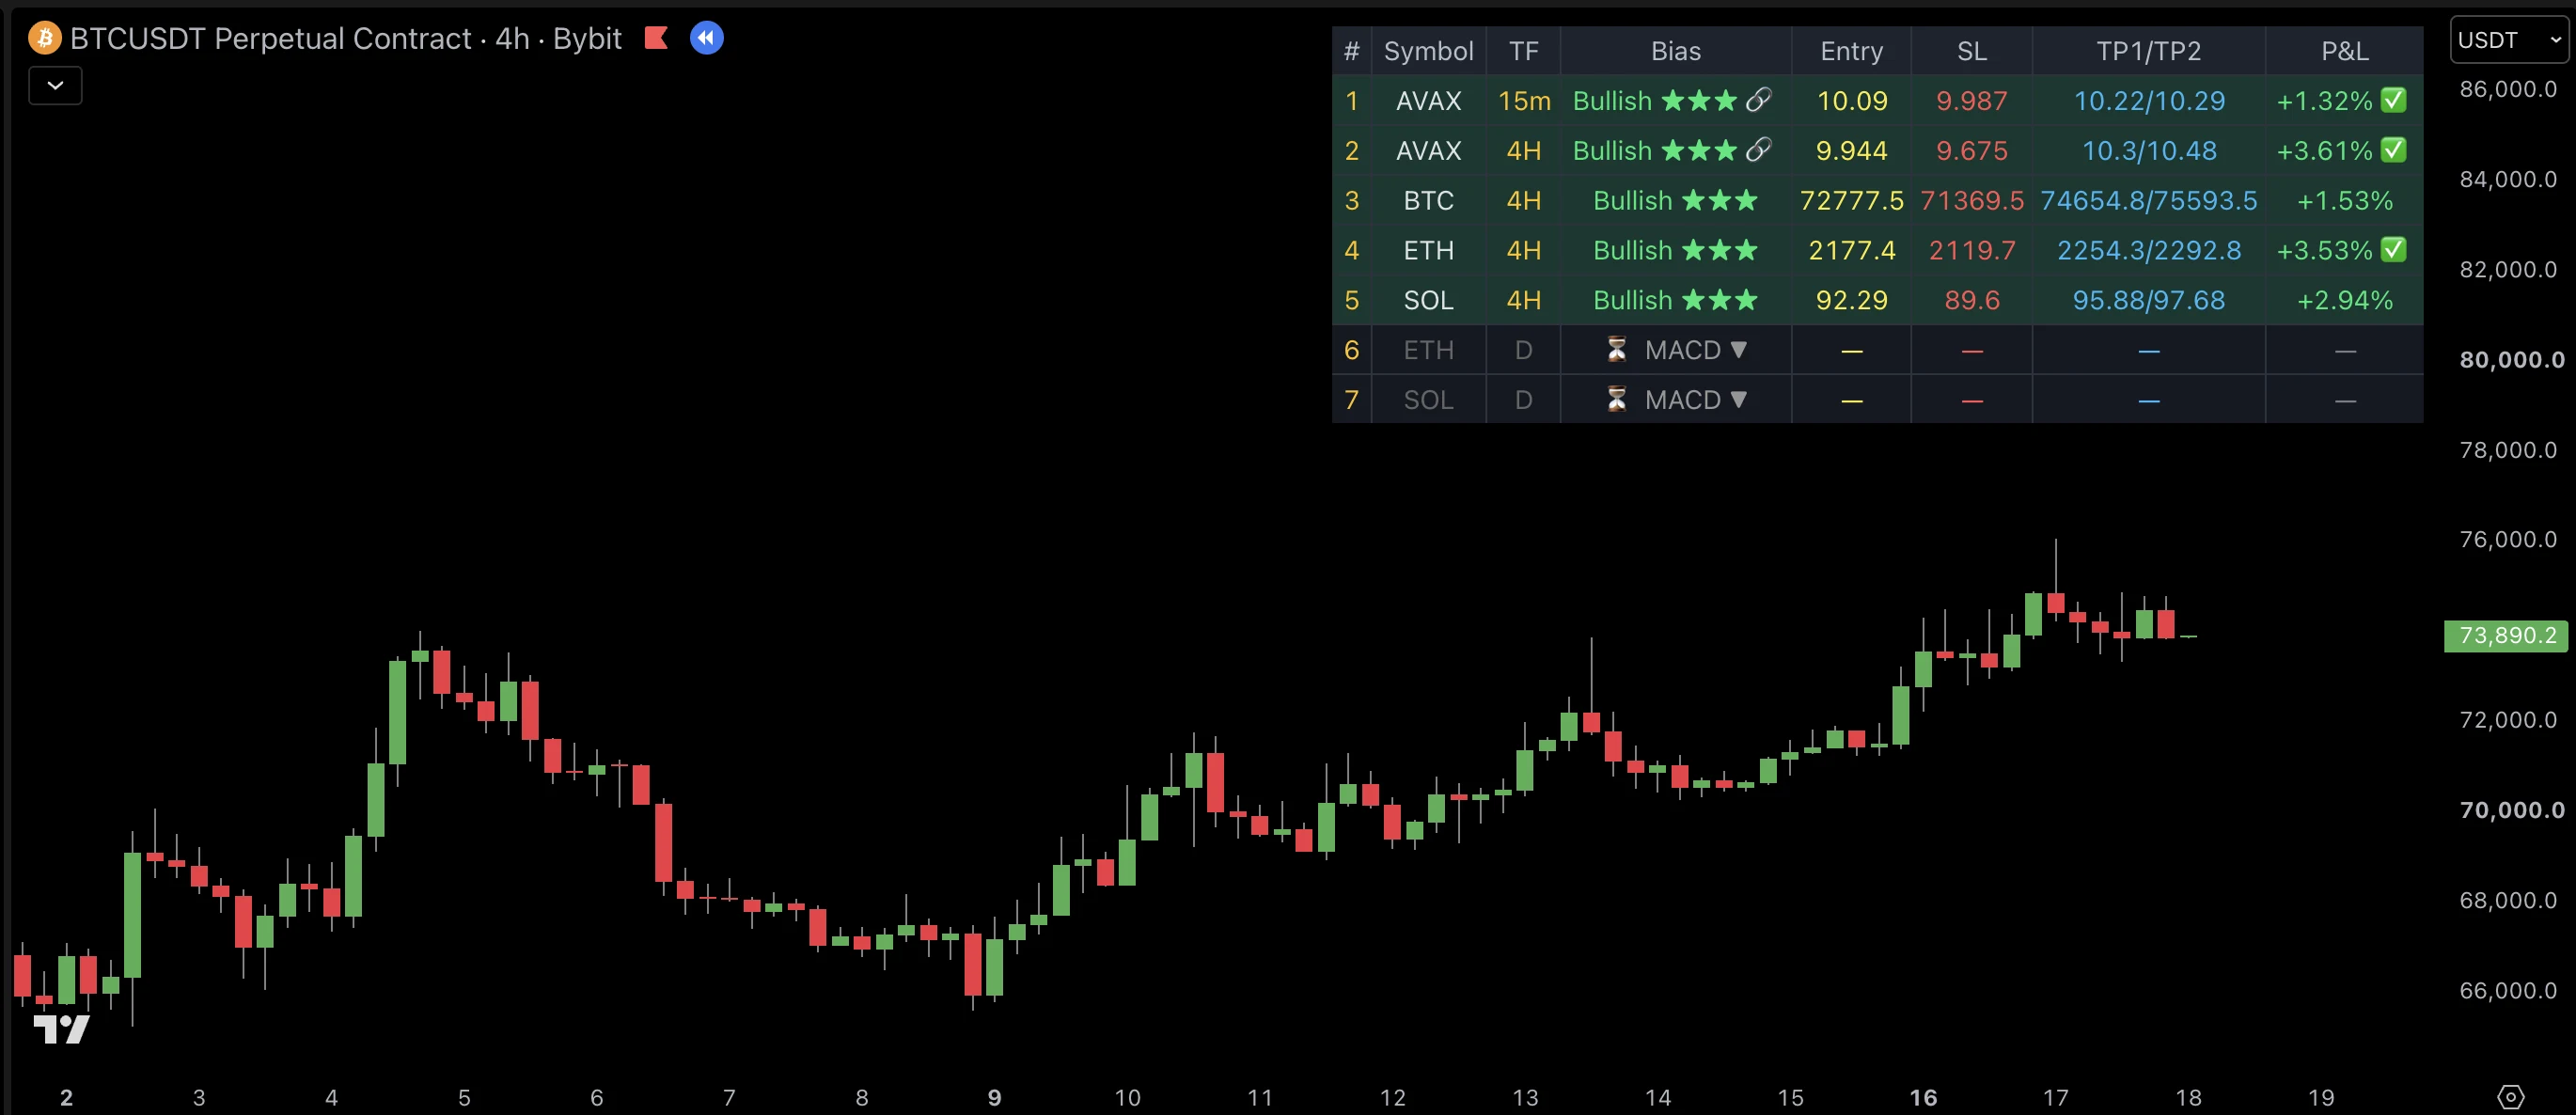
| Bias | Bullish or Bearish, with up to three stars. A link icon when the same market lines up on another timeframe too |
| Age | How long ago the row appeared |
| Entry · SL · TP1/TP2 | The close it appeared on, the stop, and two targets, set from the average range (ATR) |
| P&L | How far price has moved since, with a check mark once it's past the first target |
The grid shows seven rows, the highest first. A row is finished once a candle closes beyond its stop, and old rows leave after thirty days.
How a row appears
A row appears when a market lines up on a closed bar: the trend, the bigger picture, a move with real strength and volume behind it, and price not already stretched too far. The more of that is in place, the more stars. Stars count how much lined up; they aren't odds.
A row is a place to look, not an order. Open that chart and read it with the others: Pentarch for the phase the market is in, Janus Atlas for the level it is running into, Volume Oracle for who is behind the move.
Rows that are still waiting
Most of the time most markets have nothing to show. Their rows aren't blank: each says what is still missing, closest first.
| Row reads | Means |
|---|---|
| ⏳ MACD | Everything else is lined up; only the last piece, the turn in momentum, is missing |
| ⏳ Trend · EMA200 · ADX · Volume · Hist · Momentum · Score | That part isn't in place yet |
| ⚠️ RSI · ⚠️ Extended | The market has already run |
| ▲ or ▼ after it | The side the row would be on |
Real examples
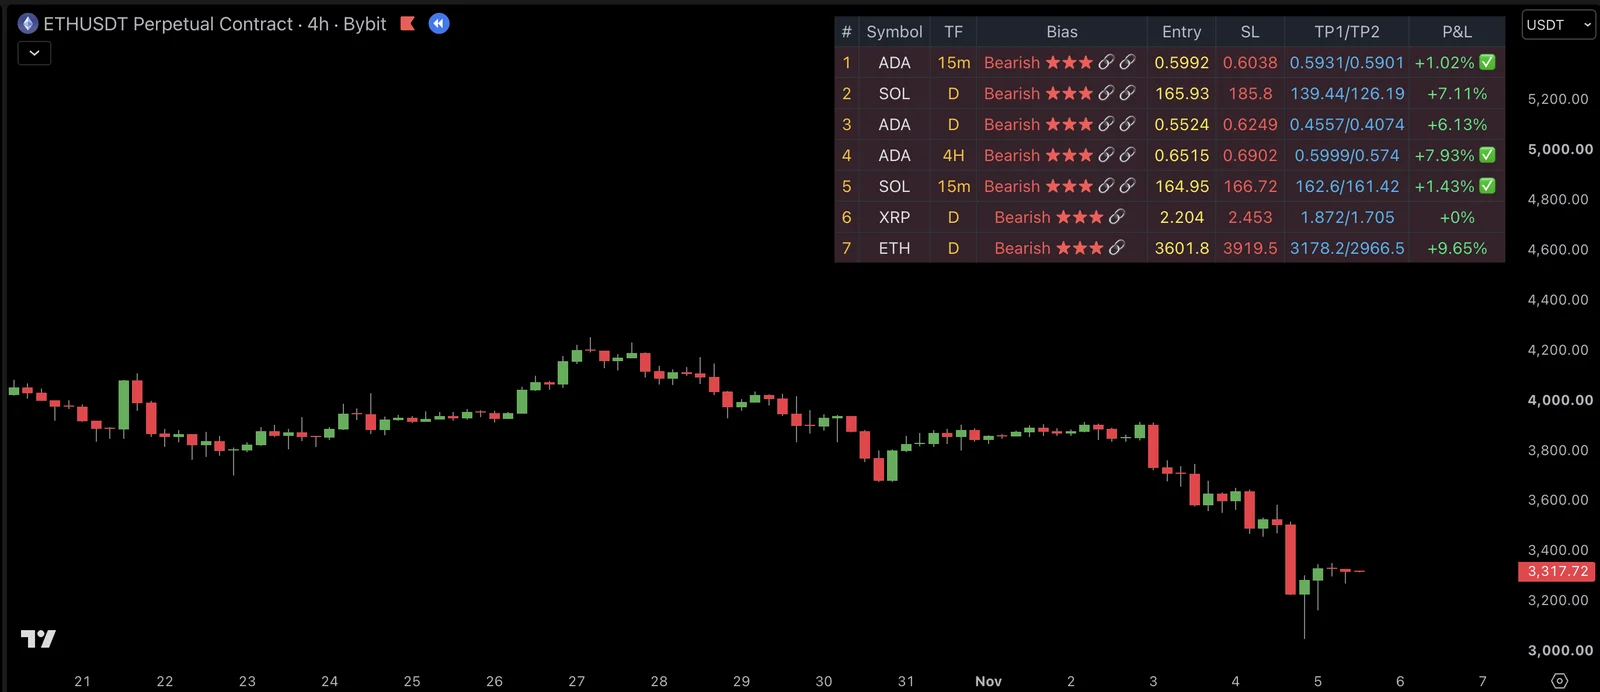
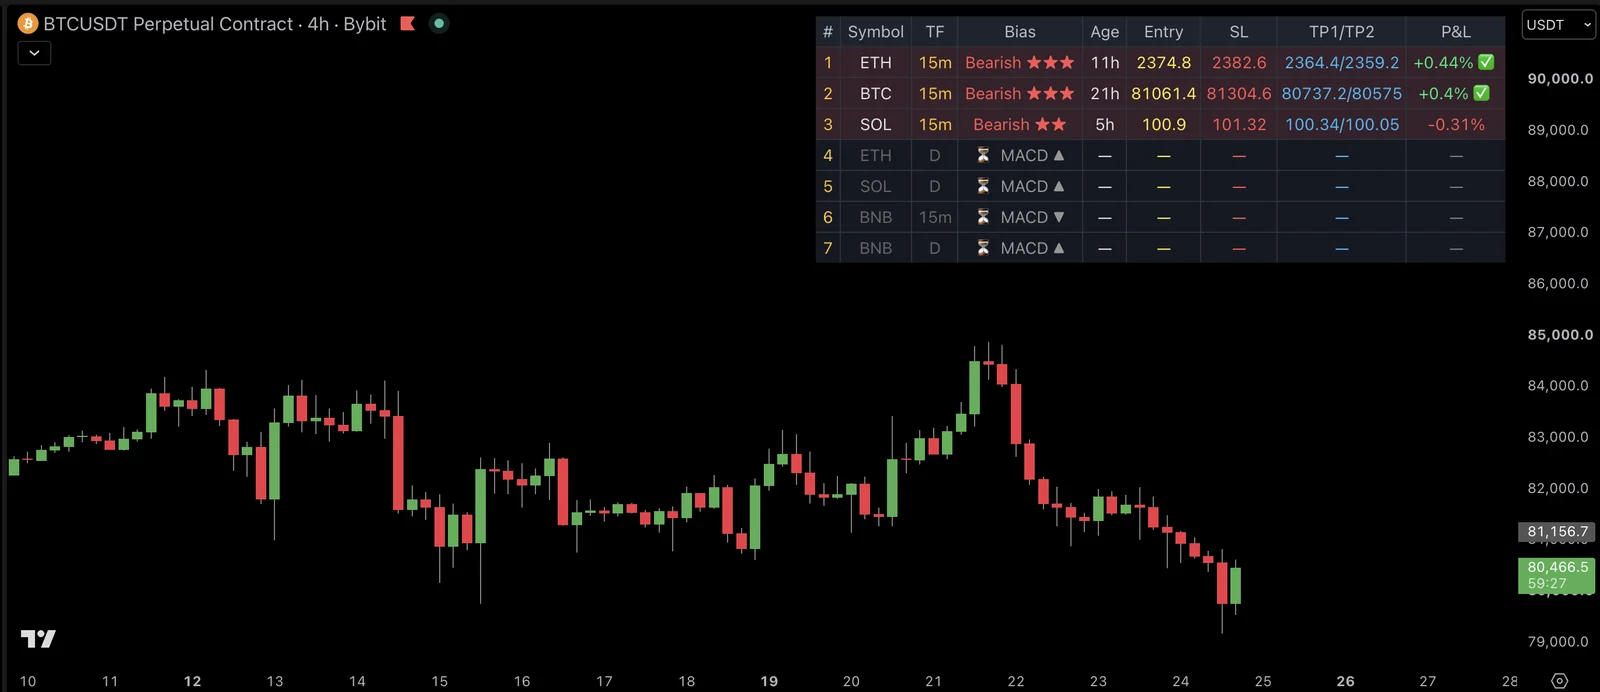
Every example here was picked because it shows one part clearly. A row is a market that lined up on that bar, not a promise.
Watchlists and timeframes
Pick a watchlist of seven: Crypto Majors (Binance or Bybit), Altcoins, Meme Coins, Forex Majors, US Indices, US Tech Giants, Commodities, or Custom for your own seven. The three timeframes are 15 minutes, 4 hours and daily out of the box, and yours to change.
Settings that matter
| Setting | Default | What it changes |
|---|---|---|
| Quick Preset | Mobile | Desktop (larger, top right), Mobile (tiny, bottom right) or Minimal (five rows, fewer columns) |
| Min Score | 70 | How complete a setup must be to get a row |
| ADX Minimum · RSI Range · Volume Spike · Extension ATR | 20 · 40 to 60 · 1.3 · 2.5 | The tuning: how strong, how calm, how busy, how stretched |
| SL · TP1 · TP2 (×ATR) | 1.5 · 2.0 · 3.0 | The levels in every row |
| TF 1 · TF 2 · TF 3 | 15m · 4H · D | The three timeframes |
| Preset (watchlist) | Crypto Majors (Binance) | The seven markets |
Alerts
One alert covers all twenty-one charts. Choose Any alert() function call to get every new row in one line, once the bar closes, like ETH 4H BEAR | Entry: 3733.9 | SL: 3836.8 | TP: 3596.6. Three simple alerts are there too: Any Bullish, Any Bearish, and both together.
Good to know
- No row is a promise. A row is a market that lined up on that bar. What you do with it is your decision.
- Read it with the others. Open the chart of a row and check it with Pentarch and Janus Atlas.
📞 Support
Technical Questions: support@signalpilot.io
Deepen your understanding with these articles from the Signal Pilot Blog:
Align your analysis across multiple timeframes
Timeframe SelectionChoose the right timeframes for your analysis approach
💬 Need Help?
Have questions about Augury Grid? Join our Discord community to get help from experienced users, share setups, and discuss approaches!
See Also
Augury Grid Guides:
- ⏱️ Timeframe Configuration Guide - Fix memory crashes, recommended setups by trading style
- 📊 Advanced Learning Guide - Correlation awareness, portfolio psychology, avoiding fake diversification
Related Pages:
- How to Use Screener - Detailed guide for using Augury Grid
- Pentarch - Cycle timing on a symbol the grid has surfaced
- Harmonic Oscillator - Momentum agreement on that same symbol
- Volume Oracle - Whether volume supports the direction the grid found
- All Indicators At A Glance - Quick reference for the whole suite
Disclaimer: Augury Grid describes what the markets have done; it does not predict. Results vary. Past performance does not guarantee future results. This is not financial advice.