Augury Grid - Multi-Timeframe Scanner
7 symbols × 3 timeframes = 21 opportunities at a glance. A signal scanner that scores every scan from 0 to 100, works out the entry, stop and targets from ATR, and retires a signal from the table once price reaches its stop.
New to Technical Analysis? Start Here
In Plain English: Augury Grid scans 7 symbols across 3 timeframes simultaneously (21 total scans), ranks them by quality, and shows everything in one clean table. Think of it like:
- A command center showing all active opportunities
- A leaderboard of what scored highest on this scan
- A worksheet that keeps the entry, stop and targets for every live signal
What You'll See (9 Columns):
| # | Rank (best scores first) |
| Sym | Symbol ticker (BTC, ETH, SPY...) |
| TF | Timeframe (15m, 4H, D) |
| Bias | Bull/Bear + star rating (★/★★/★★★) |
| Age | Time since signal (5h, 2d, etc.) |
| Entry | Entry price when signal fired |
| SL | Stop loss (ATR-based) |
| TP | Take profit levels (TP1/TP2) |
| P&L | Current profit/loss % |
Key Features:
- Lifecycle Tracking : Signals "die" when SL is hit, automatically finding new opportunities
- Quality Ratings : ★ (basic), ★★ (good), ★★★ (excellent) based on 0-100 scoring
- Multi-Timeframe : Same symbol can appear on multiple TFs if signals are active
- Position Management : Entry, SL, TP1, TP2 calculated automatically using ATR
- Blocker Detection : Shows WHY there's no signal (waiting for MACD, wrong trend, etc.)
🎓 How is this different from the old scanner?
Old approach: 8 symbols, 1 timeframe, simple X/5 confluence score, no position tracking.
New Augury Grid:
- 7 symbols × 3 timeframes = 21 simultaneous scans
- Professional 0-100 scoring system built from twelve scoring factors
- Automatic Entry/SL/TP calculation
- Real-time P&L tracking from entry
- Signals expire when stopped out or stale (30 days)
- 8 preset symbol groups (Crypto, Forex, Indices, etc.)
Beginner Starting Point:
- Choose a preset (Crypto Majors, US Indices, etc.) from the dropdown
- Look for ★★★ signals : these scored 95 or above, so the most factors lined up
- Check the P&L column : positive means price moved in signal direction
- Use Entry/SL/TP : these are your position management levels
💡 Pro Tip: The same symbol (like BTC) can appear multiple times if it has active signals on different timeframes. This is normal and powerful: you see the setup on 15m AND 4H simultaneously.
🎯 Core Functionality Beginner Friendly
Multi-Timeframe Scanning Architecture
Augury Grid scans 7 symbols across 3 timeframes = 21 simultaneous scans:
Preset (7 symbols) → Scanner → 3 Timeframes → MACD + 8 Hard Filters → Score (0-100) → Signal or Blocked
Augury Grid is a professional signal scanner that monitors 7 symbols across 3 timeframes simultaneously (21 total scans). Each potential signal has to clear a MACD crossover and eight hard filters, and is then scored from 0 to 100 by twelve scoring factors.
Architecture: 7 symbols × 3 timeframes = 21 simultaneous scans, ranked by quality score.
Display Format: Professional table with 9 columns: Rank, Symbol, Timeframe, Bias (with stars), Age, Entry, SL, TP, P&L.
Signal Detection: MACD histogram crossovers gated by eight hard filters (trend, EMA 200, ADX, RSI, extension, volume, histogram and momentum), then scored by twelve factors.
Position Management: Automatic Entry/SL/TP calculation using ATR-based distances.
Lifecycle Tracking: Signals automatically expire when SL is hit or after 30 days, then system finds new opportunities.
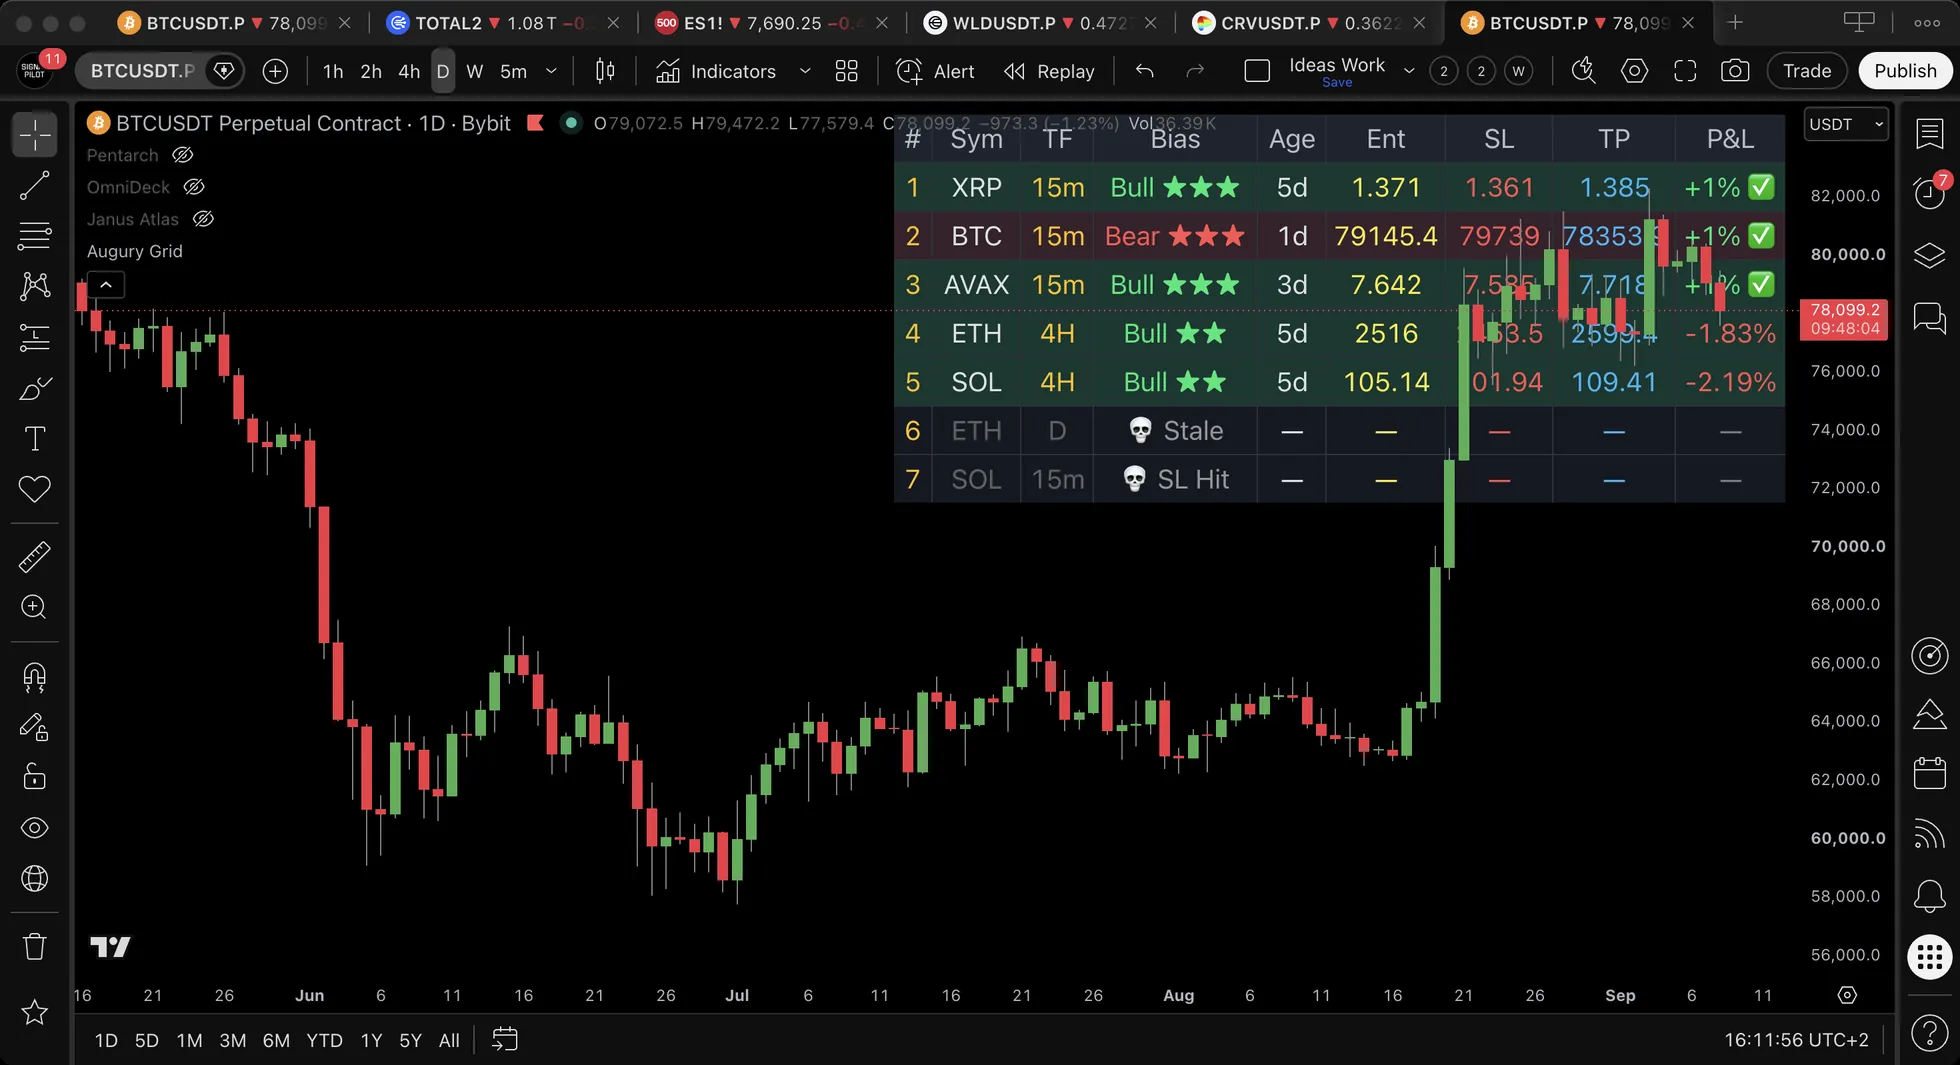
📊 A Worked Example: Reading the Table
(An illustration with round numbers, not a record of any real session. Educational only. Not financial advice.)
A snapshot of the table on the Crypto Majors preset, with "└ Show Rows" left at its default of 7 (its maximum), and the default multiples: SL at 1.5×ATR, TP1 at 2.0×ATR. Every stop and target below is that arithmetic on the entry price. Rows are ranked by score, so the two scans with no signal fall to the bottom.
| # | Sym | TF | Bias | Age | Entry | SL | TP | P&L |
|---|---|---|---|---|---|---|---|---|
| 1 | BTC | 4H | Bull ★★★ 🔗 | 1d | $94,200 | $93,000 | $95,800 | +1.5% |
| 2 | SOL | 15m | Bull ★★★ 🔗 | 5h | $185.20 | $182.20 | $189.20 | +1.8% |
| 3 | SOL | 4H | Bull ★★ 🔗 | 1d | $181.00 | $174.25 | $190.00 | +2.3% |
| 4 | BTC | 15m | Bull ★★ 🔗 | 2h | $94,500 | $93,900 | $95,300 | +0.6% |
| 5 | ETH | D | Bull ★★ | 3d | $3,280 | $3,130 | $3,480 | +3.1% |
| 6 | ADA | 15m | ⏳ Volume | — | — | — | — | — |
| 7 | AVAX | 4H | 💀 SL Hit | — | — | — | — | — |
Key Observations:
- BTC ★★★ 🔗 ranked #1 : Two timeframes agree, 15m and 4H, which is why both BTC rows carry a single 🔗. The Daily has no BTC signal, so there is no third row and no 🔗🔗.
- BTC appears twice : One row per timeframe with a live signal. A symbol with signals on all three timeframes would take three rows.
- SOL ★★★ 🔗 ranked #2 : Rows 2 and 3 are the two SOL timeframes that agree, 15m and 4H. Every 🔗 in the table has its partner row somewhere in the table.
- ETH ★★ has no 🔗 : Only the Daily is bullish, so there is nothing to agree with.
- ADA shows ⏳ Volume : The MACD crossover happened, but the volume filter has not passed, so no signal and no ranking
- AVAX shows 💀 SL Hit : Previous signal stopped out, scanning for new opportunity
The arithmetic, on row 1: the 4H ATR is $800. The stop sits 1.5 × $800 = $1,200 below the $94,200 entry, at $93,000. TP1 sits 2.0 × $800 = $1,600 above it, at $95,800. Every row is built the same way, so the distance to TP1 is always four thirds of the distance to the stop.
This example shows how multi-timeframe confluence is displayed. The 🔗 marks say how many timeframes agree, not how far price has moved.
📈 Symbol Presets
Augury Grid includes 8 built-in symbol presets plus a custom option. Select from the dropdown in settings:
| Preset | Description | Exchange |
|---|---|---|
| Crypto Majors (Binance) | BTC, ETH, SOL, BNB, XRP, ADA, AVAX | Binance |
| Crypto Majors (Bybit) | BTC, ETH, SOL, BNB, XRP, ADA, AVAX | Bybit |
| Altcoins (Binance) | ADA, AVAX, DOT, LINK, NEAR, ATOM, UNI | Binance |
| Meme Coins (Binance) | DOGE, 1000SHIB, 1000PEPE, 1000FLOKI, 1000LUNC, PEOPLE, WIF | Binance |
| Forex Majors (OANDA) | EUR/USD, GBP/USD, USD/JPY, AUD/USD, USD/CAD, USD/CHF, NZD/USD | OANDA |
| US Indices | SPY, QQQ, DIA, IWM, VTI, VOO, XLF | Various |
| US Tech Giants | AAPL, MSFT, GOOGL, NVDA, TSLA, META, AMZN | NASDAQ |
| Commodities | GC (Gold), SI (Silver), CL (Oil), NG (Gas), HG (Copper), PL (Platinum), PA (Palladium) | COMEX and NYMEX |
| Custom | Your own 7 symbols | Any |
⚠️ Custom Symbols Warning
When using Custom preset, all 7 symbols must be from the SAME exchange (e.g., all Binance or all NASDAQ). Mixing exchanges causes TradingView memory issues.
🔄 Signal Lifecycle System
Augury Grid signals have a lifecycle: they are born, they live, and they die. A dead signal leaves the table, so what you are looking at is always current:
Signal Birth
A signal fires when:
- MACD histogram crossover occurs (above zero = bullish, below zero = bearish)
- All eight hard filters pass: trend, EMA 200, ADX, RSI, extension, volume, histogram and momentum
- The score reaches 70. Below that the signal does not fire, whatever Min Score is set to; that filter only decides what is drawn, and it also defaults to 70.
At birth, Entry/SL/TP are locked in based on current price and ATR.
Signal Life
While active, the signal:
- Tracks the move from the entry price, capped at the stop distance below and the TP1 distance above
- Displays Age (how long since signal fired)
- Shows quality rating (★/★★/★★★)
- Remains ranked by quality score
Signal Death
A signal dies when:
- 💀 SL Hit : Price reached stop loss (signal failed)
- 💀 Stale : Signal is >30 days old (expired)
- New opposite signal : Bullish replaced by bearish (or vice versa)
When a signal dies, Augury Grid immediately scans for a new opportunity on that symbol/timeframe combination.
⏳ Blocker Detection (Why No Signal?)
When there's no active signal, Augury Grid shows you exactly WHY with blocker codes. Only one code shows at a time: the first condition that is not met, checked in this order: MACD cross, trend, EMA 200, ADX, volume, histogram, RSI, extension, momentum, score.
| Code | Meaning | What to Do |
|---|---|---|
| ⏳ MACD | Waiting for MACD crossover | No momentum shift yet, so wait |
| ⏳ Trend | Wrong trend direction | Trend doesn't support the signal |
| ⏳ EMA200 | Below/above 200 EMA | Major trend filter not aligned |
| ⏳ ADX | ADX too low (<20) | No trend strength, choppy market |
| ⚠️ RSI | RSI at an extreme | Above 70 on a bullish cross, or below 30 on a bearish one |
| ⚠️ Extended | Price too far from the fast EMA | Further from EMA 21 than the Extension ATR setting allows, 2.5 by default |
| ⏳ Volume | No volume spike | Insufficient volume confirmation |
| ⏳ Hist | MACD histogram too flat | Its recent size is under half a percent of ATR |
| ⏳ Momentum | Momentum not aligned | Other momentum filters disagree |
| ⏳ Score | Every filter passed, the score did not reach 70 | The scan is sound but ranks below the display floor |
| 💀 SL Hit | Previous signal stopped out | Scanning for new opportunity |
| 💀 Stale | Signal older than 30 days | Expired, scanning for a fresh signal |
| ⏳ Scanning | No reading yet for that symbol and timeframe | The scan has not produced a result for this combination |
⭐ Quality Rating System
Each signal is scored from twelve factors, three of which turn into penalties when they fail. The twelve at their best total 116 points and the three at their worst subtract 60, and the result is then clamped to the 0-100 range. The multi-timeframe confluence bonus is added after that clamp and is not clamped again, so a row carrying a link mark can hold a score above 100. Scores are displayed as star bands:
| Rating | Score Range | Meaning |
|---|---|---|
| ★ | 70-84 | The score cleared every hard filter, and little else |
| ★★ | 85-94 | Several bonus factors added to the score |
| ★★★ | 95 and above | The top band. Most of the scored factors lined up, which is uncommon |
Signals Below 70 Are Hidden
The Min Score filter defaults to 70, and the detection itself already requires 70 before a signal exists at all. Lowering Min Score below 70 therefore shows nothing new; raising it above 70 hides rows that did fire. What reaches the table has cleared every hard filter, and the score says how much beyond that lined up.
Scoring factors that increase score:
| Scoring factor | Points | Description |
|---|---|---|
| Trend alignment | +10 | EMA 21 > EMA 55 (bull) or < (bear) |
| EMA 200 alignment | +15 | Price on correct side of 200 EMA |
| ADX minimum | +10 | ADX ≥ 20 (trend strength) |
| ADX strong | +8 | ADX ≥ 25 (strong trend) |
| ADX rising | +10 | ADX increasing for 2 bars |
| Volume spike | +10 | Volume ≥ 1.3× average |
| RSI mid-range | +10 | RSI between 40-60 (room to run) |
| Momentum aligned | +12 | RSI and MACD histogram agree |
| Histogram quality | +8 | Histogram amplitude sufficient |
| Histogram growing | +8 | Histogram expanding |
| Structure | +10 | Price in favorable position |
| Not extended | +5 | Price not too far from EMA |
Penalty factors that decrease score:
| Scoring factor | Points | Description |
|---|---|---|
| Wrong side of EMA 200 | -25 | Fighting major trend |
| ADX too low | -15 | No trend (choppy market) |
| Price extended | -20 | Too far from EMA 21 |
The bands and the link marks are not independent
A signal only fires at all when its score already reaches 70, whatever Min Score is set to. The link bonus is then added on top: +15 for two timeframes, +30 for three. So a row carrying 🔗 sits at 85 or above and is always ★★ or ★★★, and a row carrying 🔗🔗 sits at 100 or above and is always ★★★. A ★ row never carries a link mark.
🔗 Multi-Timeframe Confluence
When the same symbol has signals in the same direction across multiple timeframes, Augury Grid detects this confluence and rewards it with bonus points.
Confluence Indicators
| Indicator | Meaning | Score Bonus |
|---|---|---|
| (none) | Signal on 1 timeframe only | +0 |
| 🔗 | Signal on 2 timeframes (same direction) | +15 |
| 🔗🔗 | Signal on 3 timeframes (same direction) | +30 |
How It Works
Augury Grid scans each symbol across 3 timeframes. When it detects the same directional bias on multiple TFs, it:
- Adds bonus points to the score (+15 for 2 TFs, +30 for 3 TFs)
- Displays the 🔗 indicator next to the star rating
- Ranks confluence signals higher in the table
Example
| Without Confluence | With Confluence |
|---|---|
| SOL 15m Bull ★★ | SOL 15m Bull ★★★ 🔗 |
| (only 15m has signal) | (15m AND 4H both bullish) |
Why Confluence Matters
Agreement across timeframes is worth knowing about, because it says the signal is not fighting a larger trend. When an event is confirmed across multiple timeframes:
- 15m + 4H agree: Short-term momentum aligned with swing trend
- 15m + 4H + Daily agree: Rare but powerful: all timeframes aligned
A signal carrying 🔗 or 🔗🔗 is at least not fighting the larger timeframe. That is the whole claim: agreement across timeframes removes one way for the setup to be wrong, it does not make the setup right.
Reading Confluence in the Table
# | Sym  | TF  | Bias              | Age | Entry  | ...
1 | BTC  | 4H  | Bull ★★★ 🔗🔗     | 2d  | 94,200 | ...  ← all three timeframes bullish
2 | BTC  | 15m | Bull ★★★ 🔗🔗     | 6h  | 94,500 | ...  ← same symbol, second timeframe
3 | BTC  | D   | Bull ★★★ 🔗🔗     | 4d  | 92,800 | ...  ← same symbol, third timeframe
4 | SOL  | 15m | Bull ★★★ 🔗       | 5h  | 185.20 | ...  ← two timeframes bullish
5 | ETH  | D   | Bull ★★           | 1d  | 3,280  | ...  ← only the Daily bullish
This is what 🔗🔗 looks like from the table's side: three BTC rows, one per timeframe, each carrying the same mark. BTC ranks first because its 4H row carries the highest score once the 🔗🔗 bonus is added, and rank is score first, age second.
Confluence vs Conflicting Signals
| Scenario | What You See | Interpretation |
|---|---|---|
| BTC bull on 15m, 4H, D | BTC 15m Bull ★★★ 🔗🔗 | +30 on a score of at least 70, so always the top band |
| BTC bull on 15m, 4H only | BTC 15m Bull ★★ 🔗 or ★★★ 🔗 | +15, so at least the middle band |
| BTC bull on 15m, bear on 4H | BTC 15m Bull, no mark | Neither direction reaches two rows, so no bonus and no mark |
| BTC bull on 15m only | BTC 15m Bull, no mark | One row, no bonus. The band is whatever the score gave |
Conflicting Signals
If you see BTC appear twice with different directions (e.g. "BTC 15m Bull" and "BTC 4H Bear"), neither direction reaches the two rows a bonus needs, so neither row carries a mark. What is on screen is two timeframes reading the same symbol differently.
⚙️ Settings
📱 Display Settings
Display is driven by a preset. The four settings under it are read only when Use Custom Settings is on; with it off they are ignored and the preset decides.
| Setting | Options | Default |
|---|---|---|
| Quick Preset | Desktop, Mobile, Minimal | Mobile |
| Use Custom Settings | On/Off | Off |
| ├ Text Size | Tiny, Small, Normal, Large | Small |
| ├ Position | Nine positions: Top, Middle or Bottom, each Left, Center or Right | Top Right |
| ├ Abbreviate | On/Off | On |
| └ Show Rows | 1 to 7 | 7 |
📊 Column Visibility
Toggle each column on/off:
- # (Rank)
- Sym (Symbol)
- TF (Timeframe)
- Bias (Direction + Stars)
- Age
- Entry
- SL (Stop Loss)
- TP (Take Profit)
- P&L (Profit/Loss)
⚡ Filter Settings
| Setting | Description | Default |
|---|---|---|
| Min Score | Minimum quality score to display | 70 |
| └ Show Rows | How many signal rows the table draws. Takes effect only when Use Custom Settings is on; without it the preset decides, 5 rows on Minimal and 7 otherwise. A separate Show Top N input appears under Filters, but the script never reads it, so changing it does nothing. | 7 |
🔧 Signal Tuning (Advanced)
Fine-tune signal detection thresholds for different market conditions or analysis approaches:
| Setting | Default | Range | Description |
|---|---|---|---|
| ADX Minimum | 20 | 10-40 | Minimum ADX value for trend strength filter |
| RSI Range Low | 40 | 20-50 | RSI lower bound for mid-range bonus |
| RSI Range High | 60 | 50-80 | RSI upper bound for mid-range bonus |
| Volume Spike × | 1.3 | 1.0-3.0 | Volume must be ≥ this multiple of 20-bar average |
| Extension ATR | 2.5 | 1.0-5.0 | Max ATR distance from EMA 21 before signal rejected |
When to Adjust These Settings
ADX Minimum:
- Lower to 15: Ranging/choppy markets where trends are weaker
- Keep at 20: Default, balanced for most conditions
- Raise to 25-30: Only want strong, established trends
RSI Range (40-60):
- Widen to 35-65: More signals, accepts entries closer to extremes
- Keep at 40-60: Default, ensures room for price to run
- Narrow to 45-55: Stricter, only mid-range entries
Volume Spike ×:
- Lower to 1.1: Low-volume markets (some forex, small-caps)
- Keep at 1.3: Default, requires 30% above average
- Raise to 1.5-2.0: Only want strong volume confirmation
Extension ATR:
- Lower to 2.0: Stricter, rejects extended moves earlier
- Keep at 2.5: Default, balanced
- Raise to 3.0-3.5: Allows entries on stronger momentum moves
Preset Configurations
Conservative (fewer signals, each meeting stricter thresholds):
ADX Minimum: 25
RSI Range: 45-55
Volume Spike: 1.5
Extension ATR: 2.0
Aggressive (more signals, catch more moves):
ADX Minimum: 15
RSI Range: 35-65
Volume Spike: 1.1
Extension ATR: 3.0
Default (balanced):
ADX Minimum: 20
RSI Range: 40-60
Volume Spike: 1.3
Extension ATR: 2.5
🎯 Target Settings
| Setting | Description | Default |
|---|---|---|
| SL ×ATR | Stop loss distance in ATR multiples | 1.5 |
| TP1 ×ATR | First take profit distance | 2.0 |
| TP2 ×ATR | Runner take profit distance | 3.0 |
⏱️ Timeframe Settings
| Setting | Description | Default |
|---|---|---|
| TF 1 | First timeframe (scalp/intraday) | 15m |
| TF 2 | Second timeframe (swing) | 4H |
| TF 3 | Third timeframe (position) | D |
⚠️ Chart Timeframe Must Match TF 1
Golden Rule: Your chart timeframe must be equal to or lower than TF 1 (your lowest scanner timeframe). Otherwise, TradingView will crash with "Memory limits exceeded."
Example: If TF 1 = 15m, use a 15m chart (or lower like 5m). If you're on a 4H chart, set TF 1 to 4H or higher.
📈 Symbol Preset
Dropdown with 9 options: 8 presets + Custom (see Symbol Presets section above)
📝 Custom Symbols
When Preset = Custom, you can enter 7 custom symbols. Enter full TradingView format:
- Crypto:
BINANCE:BTCUSDT - Stocks:
NASDAQ:AAPL - Forex:
OANDA:EURUSD
📱 The Three Presets
Quick Preset sets the whole display in one field. Mobile is the default.
| Setting | Desktop | Mobile | Minimal |
|---|---|---|---|
| Text size | Normal | Tiny | Small |
| Position | Top Right | Bottom Right | Top Right |
| Abbreviated direction | Off | On | On |
| Rows drawn | 7 | 7 | 5 |
| Columns drawn | All 9 | All 9 | 5: #, Sym, TF, Bias, Entry |
Minimal is the only preset that hides columns. It drops Age, SL, TP and P&L.
Changing one thing at a time
The column toggles and the four settings under the preset are read only when Use Custom Settings is on. Turning it on takes the preset out of the picture entirely, so every value comes from your own settings from that point.
🔔 Alert Configuration
Augury Grid v1.0 includes actionable alerts with full signal details: symbol, timeframe, direction, entry, stop loss, and take profit.
Alert Message Format
When a signal fires, you receive a message like:
🟢 BTC 4H BULL | Entry: 89500 | SL: 88300 | TP: 91100Or for bearish signals:
🔴 ETH 15m BEAR | Entry: 3450 | SL: 3525 | TP: 3350Message components:
| Part | Example | Meaning |
|---|---|---|
| Emoji | 🟢 or 🔴 | Direction (green=bull, red=bear) |
| Symbol | BTC | Which asset |
| Timeframe | 4H | Which timeframe triggered |
| Direction | BULL | Bullish or bearish bias |
| Entry | 89500 | Entry price when signal fired. Prices are printed without a thousands separator and without trailing zeros |
| SL | 88300 | Stop loss level, entry minus 1.5×ATR |
| TP | 91100 | First target, entry plus 2.0×ATR |
Setting Up Alerts
Important: Use 'Any alert() function call'
To receive the full actionable alerts with symbol names, you MUST select "Any alert() function call" as the condition.
Step-by-step setup:
- Add Augury Grid to your chart
- Right-click the indicator → Create Alert
- In the Condition dropdown, select "Augury Grid"
- In the second dropdown, select "Any alert() function call"
- Set Alert actions (popup, email, webhook, mobile push)
- Set Expiration (recommend "Open-ended")
- Click Create
One Alert Catches Everything
With "Any alert() function call", a single alert will fire for ALL 21 symbol/timeframe combinations. Each alert message tells you exactly which symbol and timeframe triggered.
Simple Alerts (Legacy)
For users who prefer simple trigger alerts without detailed messages, these are also available:
| Alert Condition | Trigger |
|---|---|
| 🟢 Any Bullish (Simple) | Any bullish signal on any symbol/TF |
| 🔴 Any Bearish (Simple) | Any bearish signal on any symbol/TF |
| ⚡ Any Signal (Simple) | Any signal (bull or bear) |
These show a basic message like "Bullish signal - check Augury Grid for details" without the full Entry/SL/TP info.
Webhook Integration
For automated logging or external integration, use webhook alerts:
- Set up alert as above
- In Alert actions, enable Webhook URL
- Enter your webhook endpoint
- The alert message (with full signal details) will be sent as POST body
Example webhook payload:
🟢 SOL 15m BULL | Entry: 185.2 | SL: 182.2 | TP: 189.2Parse this string in your webhook receiver to extract:
- Direction (🟢 or 🔴)
- Symbol (SOL)
- Timeframe (15m)
- Bias (BULL)
- Entry price (185.2)
- Stop loss (182.2)
- Take profit (189.2)
Alert Use Cases
Mobile user: Enable push notifications. When alert fires, you see the complete setup details without opening the app.
Webhook automation: Send alerts to Discord, Telegram, or external services. Parse the message to auto-log setups for review.
Email journal: Send alerts to email. Creates automatic signal journal with timestamps for review.
🔗 Integration with Other Indicators
Augury Grid is a powerful screener that identifies high-confluence opportunities across multiple symbols. Combine it with other Signal Pilot indicators for deep analysis after the grid filters your watchlist:
Augury Grid → Pentarch (Deep Timing Analysis)
Workflow:
- Grid shows ★★ or ★★★ signal → Symbol passes quality filter with high score
- Click symbol to open individual chart → Review full chart with Pentarch signals visible
- Check the Pentarch event type → TD (accumulation) and IGN (markup) sit early in the cycle; BDN (decline) sits late
- Confirm signal freshness → Signal fired in last 1-3 bars = timely setup opportunity
- Expected outcome: Grid filters across 21 scans → Pentarch provides precise timing context
Example: Augury Grid shows SOL ★★★ bullish on 4H → Open SOL chart → Pentarch IGN event just fired = high-confluence bullish setup
Augury Grid → Janus Atlas (Level Confluence)
Workflow:
- Grid shows a signal in the two upper bands → ★★ or ★★★ bullish/bearish signal appears
- Open individual chart with Janus Atlas → Check if price is at key support/resistance level
- Look for level confluence → Daily Low + Weekly Low + VWAP clustering = structural confluence
- Grid quality plus level confluence → the momentum read and the structural read point the same way, which is the most you can ask of two independent systems
- Expected outcome: Grid identifies momentum + levels provide structure = complete setup analysis
Example: Grid shows AAPL ★★ bearish on D → Open chart → Price at Daily High + Weekly resistance = strong bearish confluence
Augury Grid → Volume Oracle (Regime Confirmation)
Workflow:
- Grid highlights a symbol in the two upper bands → ★★ or ★★★ rating
- Open chart and check Volume Oracle regime → Is the regime aligned with the grid signal direction?
- Aligned regime = signal validation → Bullish grid signal + Accumulation regime = volume confirmation
- Conflicting regime = proceed with caution → Bullish grid signal + Distribution regime may lack follow-through
- Expected outcome: Volume Oracle regime validates which grid signals have volume support
Example: Grid shows TSLA ★★★ bullish → Volume Oracle shows Accumulation regime (green, 78%) = confirmed accumulation flow
Augury Grid → OmniDeck (Multi-System Validation)
Workflow:
- Grid shows directional signal → Bullish or bearish with ★★+ quality
- Open chart with OmniDeck → Check Regime Box for trend context
- OmniDeck confirms grid direction → Grid bullish + OmniDeck bullish regime = trend alignment
- OmniDeck conflicts with grid → Grid bullish with an OmniDeck bearish regime: the two disagree, and the reading has one source rather than two
- Expected outcome: OmniDeck provides broader trend context for grid-filtered opportunities
Example: Grid shows QQQ ★★ bullish on 15m → OmniDeck shows bullish regime box = aligned bullish setup
Pro Tip: The Multi-Timeframe Filter Workflow
Use Augury Grid as your first filter. The grid gives you the ★★-and-better shortlist; then take the timing from Pentarch, the levels from Janus Atlas and the regime confirmation from Volume Oracle. The grid ranks 21 symbol and timeframe combinations at once by quality score. Start with the ★★★ rows, and check that the regime agrees before acting.
See also: Analysis Workflow Guide for detailed multi-indicator approaches.
⚠️ Common Mistakes to Avoid
These mistakes are frequently made by new Augury Grid users. Avoid them to improve your results:
Mistake #1: Monitoring Too Many Symbols
The Problem: Not giving enough attention to each symbol in the grid. Ignoring symbols or rushing analysis = missed signals or poor decisions.
The Fix:
- A preset always scans seven symbols. What you control is how many of the seven rows you actually work: start by following four or five you understand well.
- Focus on symbols with strong trends, high volume, and clear technical patterns
- Only widen to all seven once you can read 21 scans without skimming
- Fewer symbols read closely leaves more attention per row than seven skimmed
Remember: the scanner is fixed at seven symbols; what you are learning to widen is your own attention across them.
Mistake #2: Acting on Every Signal
The Problem: The three star bands do not carry the same information. A ★ row and a ★★★ row look alike at a glance, and they are not.
What each band records:
- ★★★ (95-100): the most scored factors lined up
- ★★ (85-94): several bonus factors above the hard filters
- ★ (70-84): the least the Min Score filter lets through
- Blocked (⏳/💀): a filter has not passed, or the previous signal reached its stop
Remember: The bands exist so the rows can be told apart. Reading them as one number is what removes that.
Mistake #3: Skipping Individual Chart Analysis
The Problem: The grid is a filter, not a final decision tool. Acting based solely on grid confluence without reviewing the actual chart leads to poor analysis and missed context.
The Fix:
- Grid highlights opportunity → ALWAYS open individual chart for detailed analysis
- Check price action: Is price at support/resistance? Clean breakout or choppy range?
- Review Pentarch events: When did the event fire? Which event type (IGN vs BDN)?
- Confirm with Janus Atlas levels and Volume Oracle before acting
Remember: Grid = screener, not strategy. Use it to filter your watchlist, then perform full chart analysis before acting.
Mistake #4: Ignoring the Quality Rating
The Problem: Treating all bullish or bearish signals equally, regardless of quality score. A ★ bullish signal is far weaker than a ★★★ bullish signal.
The Fix:
- Always check the star rating: ★★★ > ★★ > ★
- Prioritize your attention: Review ★★★ signals first, then ★★
- The alerts cannot filter by star rating, so let them all through and let the rating decide which you open a chart for
- A higher score means more of the twelve factors line up. That is a cleaner read, not a guaranteed one.
Remember: The stars matter more than the direction. A ★★★ signal deserves immediate attention; a ★ signal can wait.
Mistake #5: Using Wrong Timeframe for Your Analysis Style
The Problem: Leaving TF 1, TF 2 and TF 3 at 15m/4H/D when none of the three matches how long you actually hold. The scanner then reports on timeframes you will never act on.
The Fix: the three timeframes are settings, not the chart you happen to have open. Set them to your own:
- Intraday analysis: 5m / 15m / 1H
- Multi-day analysis: 1H / 4H / D
- Position analysis: 4H / D / W
- Then drop the chart itself to TF 1 or lower, which is the memory rule, not a scanning rule
Remember: the chart timeframe decides whether TradingView can load the scan, not what gets scanned. TF 1, TF 2 and TF 3 decide that.
Mistake #6: Never Updating Your Watchlist
The Problem: Markets change. Symbols that were trending 2 months ago may now be dead/choppy. Static watchlists become less effective over time.
The Fix:
- Review watchlist weekly: Remove low-volume, choppy, or stagnant symbols
- Add new symbols showing strong trends, high relative strength, or sector rotation
- Rotate symbols based on market conditions (growth stocks in bull markets, defensive in bear markets)
- Keep watchlist dynamic and relevant to current market environment
Remember: A fresh, actively managed watchlist performs better than a stale, outdated one. Review and rotate symbols regularly.
Additional Resources
For more best practices, see Best Practices & Pro Tips. For screener workflow examples, see Screener How-To Guide.
🌫️ When This Doesn't Work Well
Augury Grid signals show reduced reliability in certain market conditions. Recognizing these environments helps set appropriate expectations:
Broad Choppy Market Conditions (Market-Wide Indecision)
The Condition: When overall market environment (SPY, QQQ, or sector indices) is sideways/choppy, most stocks/assets in your watchlist exhibit similar indecisive behavior.
What Happens: Grid shows mostly ★ and ★★ quality ratings across all symbols. Few ★★★ signals appear. Symbols that do signal often flip from Bullish to Neutral to Bearish within 5-10 bars. P&L percentages hover around ±1-2%, showing no sustained follow-through. Even the setups that score well lack the broader market momentum to follow through.
Context: Augury Grid analyzes individual symbol momentum via MACD and confluence factors. But individual symbols are influenced by overall market sentiment. During broad market choppy periods (VIX elevated but direction unclear, major indices range-bound), even stocks with strong individual confluence struggle to trend. This isn’t Augury failing. It is accurately showing that momentum exists but lacks supporting market context. Best practice: Check SPY/QQQ regime first using Pentarch or OmniDeck. When the broader market shows a neutral or choppy regime, the scores the Grid prints come from a market with less direction in it than the scoring assumes. When the broader market is trending clearly, the same scores rest on a firmer regime reading.
Reading Only the Bottom Band (★)
The Condition: Working the ★ rows (70-84) as though they carried what the ★★★ rows (95-100) carry.
What Happens: More rows retire at the 💀 SL Hit marker without the move continuing, and the rating stops carrying information because everything on screen looks the same.
Context: The score counts how many supporting factors line up behind a signal. A score in the top band means the MACD confirmed, the trend filter passed, no blocker is active and momentum registered. A score in the bottom band means several of those were weak or in conflict. A ★ row can have the direction right and still be recording that little else agreed with it. The alert conditions do not filter by star band, so every band reaches the alert alike; the band is visible only in the table. A ★ row is worth reading for what a partial alignment looks like.
Whipsaw & Transition Periods
The Condition: Individual symbols transitioning between regimes, moving from downtrend to consolidation to uptrend, or vice versa.
What Happens: Grid shows signal instability: Symbol fires Bullish ★★★ → 3 bars later shows 💀 SL Hit → 5 bars later fires Bearish ★★ → then shows ⏳ Trend blocker. Quality ratings fluctuate rapidly. P&L shows +3%, -2%, +1%, -1% oscillating pattern. This happens because MACD is centered around zero crossover, and during transitions, the histogram oscillates around the zero line without committing to either direction.
Context: MACD-based systems (like Augury Grid) excel at identifying momentum within established trends. They struggle during regime transitions when momentum itself is unstable. During these periods, the histogram crosses zero multiple times in both directions as the market "decides" which way to trend. These whipsaws are inherent to zero-crossing methodologies. Best practice: When you see a symbol flip signals 3+ times within 20 bars, that symbol is in transition, so remove it from active consideration temporarily. Revisit it after 10-15 bars to see if regime has stabilized. Or combine with Pentarch: read the Pentarch regime bars for the same symbol. A clear colour (green or red rather than gray) says the symbol is not mid-transition, and that is on screen before anything happens.
Mismatched Timeframe & Analysis Approach
The Condition: Using Augury Grid on a timeframe that doesn't match your analysis approach or hold duration.
What Happens:
- Intraday user on 4H/D/W: signals fire once every few days. By the time one appears, most of the intraday move is behind it.
- Multi-day user on 1m/5m/15m: signals fire constantly across the watchlist. Most reverse before you finish looking at the chart, and the volume of them leads to paralysis or to picking at random.
Context: Augury Grid scans the three timeframes you set in TF 1, TF 2 and TF 3, on all seven symbols. Nothing about that depends on the chart you have open; the chart only has to sit at TF 1 or lower so TradingView can hold the twenty-one requests in memory. So a mismatch here is a settings mistake, not a charting one. Short holds of minutes to hours → 5m/15m/1H. Holds of hours to a day → 15m/1H/4H. Holds of days to weeks → 1H/4H/D, the default. Holds of weeks to months → 4H/D/W. Set wrong, the grid gives you either too few signals to act on or more than you can read. Best practice: pick the three timeframes from your own hold period first, then set the chart to TF 1 or below.
Highly Correlated Watchlist (All Symbols Move Together)
The Condition: Watchlist contains symbols that are highly correlated, and they all move together (e.g., all tech stocks, all crypto, all oil stocks).
What Happens: Grid shows "diversification illusion." When tech sector rallies, all 7 symbols flash Bullish ★★★ simultaneously across all timeframes. Feels like 21 opportunities, but it's really ONE opportunity (tech sector) expressed through 7 correlated symbols. When sector reverses, all flip Bearish together. No true diversification. Risk concentration masked by symbol count.
Context: Augury Grid's value is finding THE BEST opportunities across a diversified watchlist. If all symbols are correlated, the grid just amplifies sector moves without adding information. A watchlist of AAPL, MSFT, GOOGL, META, NVDA, AMD, TSLA (all high-beta tech) will show nearly identical signals. This defeats the purpose of multi-symbol scanning. Better watchlist design: Mix sectors (tech, healthcare, energy, financials, consumer), mix asset classes (stocks, crypto, commodities), mix market caps (large-cap, mid-cap, small-cap). When tech gives Bullish ★★★, healthcare might show Bearish ★★★, and energy shows Neutral. THIS is useful: it shows WHERE opportunity is rotating. If your grid shows all symbols firing same signal simultaneously, your watchlist is too correlated. Diversify symbol selection.
Low Liquidity & Thinly Traded Symbols
The Condition: Including penny stocks, micro-cap altcoins, or illiquid futures contracts in your watchlist.
What Happens: Signals appear (MACD crossover is valid), but price action is erratic. A Bullish ★★★ fires, but the bid-ask spread is 5%. Price gaps intraday due to lack of buyers. Slippage eats most of theoretical profit. P&L shows +8% but actual fill is at +3% due to liquidity issues.
Context: Augury Grid analyzes momentum mathematically (MACD calculations). It doesn't "know" about liquidity, bid-ask spreads, or average daily volume. A $0.50 penny stock can show ★★★ quality, but if daily volume is only 10,000 shares, entering a 5,000-share position moves the market against you. MACD-based signals work best on liquid instruments where your order doesn't materially impact price. Best practice: Pre-filter your watchlist by liquidity before adding to Augury Grid. For stocks: minimum $5M average daily volume. For crypto: minimum $50M daily volume (on the specific exchange you trade). For futures: use front-month contracts with high open interest. Grid shows technical signals; you must ensure those signals are tradeable with acceptable slippage.
Using Grid Signals Without Individual Chart Confirmation
The Condition: Acting directly from grid signals without pulling up individual charts to verify setup quality.
What Happens: Grid shows AAPL Bullish ★★★. You act immediately. Pull up the AAPL chart afterward and three things show up at once. Price is sitting on the Weekly High drawn by Janus Atlas. Volume is below average, which Volume Oracle makes plain. And there have already been three failed bullish attempts at this level. The ★★★ signal is valid on its own terms, and the context around it says something else. The row and the chart disagree.
Context: Augury Grid is a screener: its job is to surface candidates worth investigating, not to provide complete analysis. The grid analyzes signals across 7 symbols × 3 timeframes efficiently. But it doesn't check: support/resistance context, volume quality, recent failed attempts, news events, earnings dates, sector rotation. These require individual chart analysis. Best practice workflow: (1) the grid identifies candidates, the ★★★ rows; (2) pull up the individual chart for the top ones; (3) ask whether price is at major support or resistance, using the levels from Janus Atlas; (4) ask whether volume supports the move, using Volume Oracle; (5) ask whether the regime supports the direction, using Pentarch; (6) only then decide to act. Grid surfaces 21 scans. The steps above narrow those to the one or two worth the reading time. That is the workflow.
Recognizing Reduced Reliability Environments
Practical Identification:
- Entire table showing mostly ★ and ★★ ratings: nothing on screen has cleared the top band, which is itself a reading of the market
- SPY/QQQ showing neutral/gray on Pentarch: Market lacks direction: Augury signals less reliable
- Multiple symbols flipping signals within 10 bars: Whipsaw environment: wait for stabilization
- All symbols in watchlist fire same signal simultaneously: Watchlist too correlated: diversify
- P&L oscillating ±1-2% without sustained moves: Choppy conditions or wrong timeframe
- Symbol volume under $5M daily (stocks) or $50M (crypto): Liquidity concerns: remove from watchlist
- Acting from grid without checking individual charts: Missing context: verify setups individually
Remember: Augury Grid's strength is efficiency: scanning 7 symbols × 3 timeframes (21 scans) simultaneously to find momentum shifts. Its weakness is context: it doesn't know about support/resistance, volume quality, broader market regime, or individual symbol liquidity. The grid finds candidates. You validate candidates. Best results come from combining that scanning efficiency with individual chart analysis: the levels from Janus Atlas, the volume confirmation from Volume Oracle and the regime context from Pentarch. Grid → Candidates → Validation → Action. That's the complete workflow.
❓ Frequently Asked Questions
Q: Why do I see the same symbol twice?
A: This means the symbol has active signals on different timeframes. For example, BTC can occupy both a 15m and a 4H row when a signal is live on each. That is what the 🔗 mark records.
Q: What does 💀 SL Hit mean?
A: The previous signal was stopped out (price hit the stop loss). The system is now scanning for a new opportunity on that symbol/timeframe. This is the lifecycle system in action: a failed signal leaves the table instead of sitting there looking live. What you do with an open position is still your decision; the indicator has no view of it.
Q: Why are all my signals ★★★?
A: ★★★ signals (95+ score) are rare but not impossible. If you see many, it means market conditions are favorable with strong trend, momentum, and volume alignment. This is a good thing! However, if literally ALL signals are ★★★, check that the Min Score filter isn't set too high.
Q: Can I change the 3 timeframes?
A: Yes. In Settings → Timeframe Settings, you can change TF 1, TF 2, and TF 3 to any timeframe (e.g., 1m, 5m, 15m, 1H, 4H, D, W). Default is 15m/4H/D for short-term/multi-day/position analysis coverage.
Q: Why must custom symbols be from the same exchange?
A: TradingView memory limits. When scanning 7 symbols × 3 timeframes (21 scans), requesting data from multiple exchanges simultaneously can exceed memory allocation and cause the indicator to fail. Presets are designed to work within these limits. For custom symbols, stick to one exchange.
Q: What does ⏳ MACD mean?
A: No MACD histogram crossover has occurred yet. The system is waiting for the histogram to cross above zero (bullish) or below zero (bearish). Other filters may be ready, but without the core MACD crossover, no signal fires.
Q: How is Entry/SL/TP calculated?
A: When a signal fires, Entry is locked at current price. SL is placed at Entry ± (ATR × SL multiplier). TP1 and TP2 are placed at Entry ± (ATR × TP multipliers). Default multipliers: SL=1.5×ATR, TP1=2.0×ATR, TP2=3.0×ATR. Adjust in Settings.
Q: Does it work on mobile?
A: Yes. Enable Mobile Mode in settings for optimized phone display: tiny text, bottom-right position, all columns visible, 7 rows shown. Perfect for quick position checks.
Q: Can I export signal data?
A: Yes, via TradingView alert webhooks. Create the alert on "Any alert() function call" and add a webhook URL. What arrives is the alert message itself as the POST body, one line of plain text: direction emoji, symbol, timeframe, bias, entry, stop and TP1. It is not JSON, and it does not carry the quality score, so parse the line if you want the fields separately.
Q: What does 🔗 mean next to the star rating?
A: Multi-timeframe confluence. The 🔗 indicator shows that the same symbol has signals in the same direction on multiple timeframes:
- 🔗 = 2 timeframes agree (e.g., 15m AND 4H both bullish)
- 🔗🔗 = 3 timeframes agree (e.g., 15m AND 4H AND Daily all bullish)
Confluence signals receive +15 or +30 bonus points, making them rank higher. These are stronger setups because they're confirmed across multiple timeframes.
Q: How do I get alerts with the actual symbol name?
A: When creating an alert, select "Any alert() function call" as the condition (not the simple alert conditions). This gives you detailed messages like:
🟢 BTC 4H BULL | Entry: 89500 | SL: 88300 | TP: 91100Instead of just "Bullish signal detected!"
Q: What's the difference between Signal Tuning settings and Filters?
A:
- Filters (Min Score): Control what is displayed in the table. The row count is set by "└ Show Rows" under Use Custom Settings, not by the Show Top N input beside Min Score, which the script does not read.
- Signal Tuning (ADX, RSI, Volume, Extension): Control how signals are DETECTED
Signal Tuning affects which signals fire in the first place. Filters affect which of those signals you see.
Q: Should I adjust Signal Tuning settings?
A: The defaults work well for most markets. Consider adjusting if:
- Too few signals: Lower ADX Minimum (15), widen RSI Range (35-65), lower Volume Spike (1.1)
- Too many rows in the bottom band: Raise ADX Minimum (25), narrow RSI Range (45-55), raise Volume Spike (1.5)
- Analyzing low-volume assets: Lower Volume Spike to 1.1
- Only want strong trends: Raise ADX Minimum to 25-30
Q: Why did my ★★ signal become ★★★?
A: Likely confluence. If another timeframe fired a signal in the same direction, the confluence bonus (+15 or +30 points) pushed the score above 95, upgrading it to ★★★. You'll see the 🔗 indicator confirming this.
✅ Knowledge Check
Question: How many total scans does Augury Grid perform simultaneously?
📋 Quick Reference Guide
Table Display Legend
| Column | Meaning |
|---|---|
| # | Rank, best score first. The table draws the top rows out of 21 scans, 7 by default. The count comes from "└ Show Rows" under Use Custom Settings, or from the preset when custom settings are off. |
| Sym | Symbol being scanned |
| TF | Which of TF 1, TF 2 and TF 3 fired it; 15m, 4H and D by default |
| Bias | Bull or Bear, followed by the star rating and any 🔗 confluence mark |
| Age | Time since the signal fired, shown as 5h, 2d and so on |
| Entry | Signal entry price |
| SL | Stop-loss level (ATR-based) |
| TP | Take-profit target (ATR-based) |
| P&L | Move since entry, capped at the stop distance below and the TP1 distance above. A row that has run past either shows ⛔ or ✅ beside the capped figure |
| ★★★ | Score 95 and above: the most factors lined up |
| ★★ | Score 85-94: several bonus factors |
| ★ | Score 70-84: the hard filters and little more |
| ⏳ MACD | MACD filter blocking signal |
| ⏳ Trend | Trend filter blocking signal |
| 💀 SL Hit | Stop-loss hit, signal dead |
| 💀 Stale | Signal too old, expired |
Symbol Presets Summary
| Preset | Focus | Total Scans |
|---|---|---|
| Crypto Majors (Binance) | BTC, ETH, SOL and the rest of the majors on Binance | 7×3 = 21 |
| Crypto Majors (Bybit) | The same seven, priced on Bybit | 7×3 = 21 |
| Altcoins (Binance) | ADA, AVAX and five more outside the top four | 7×3 = 21 |
| Meme Coins (Binance) | DOGE and six more, several as 1000x contracts | 7×3 = 21 |
| Forex Majors (OANDA) | The seven major pairs | 7×3 = 21 |
| US Indices | SPY, QQQ and five more index and sector proxies | 7×3 = 21 |
| US Tech Giants | AAPL, MSFT and five more large-cap tech names | 7×3 = 21 |
| Commodities | Gold, silver, oil and four more COMEX and NYMEX contracts | 7×3 = 21 |
| Custom | Your own 7 symbols, all from one exchange | 7×3 = 21 |
Custom Watchlist Templates
The Custom preset takes exactly seven symbols, all from one exchange, in full TradingView format. Each of these is seven, so each drops straight in:
Crypto, beyond the majors preset:
BINANCE:BTCUSDT, BINANCE:ETHUSDT, BINANCE:BNBUSDT,
BINANCE:SOLUSDT, BINANCE:LINKUSDT, BINANCE:DOTUSDT,
BINANCE:ATOMUSDT
US sector proxies, rather than seven names from one sector:
AMEX:XLF, AMEX:XLE, AMEX:XLK, AMEX:XLV,
AMEX:XLI, AMEX:XLP, AMEX:XLU
Large-cap tech:
NASDAQ:AAPL, NASDAQ:MSFT, NASDAQ:GOOGL,
NASDAQ:AMZN, NASDAQ:NVDA, NASDAQ:META,
NASDAQ:NFLX
Forex, seven crosses rather than seven dollar pairs:
OANDA:EURUSD, OANDA:GBPUSD, OANDA:USDJPY,
OANDA:AUDUSD, OANDA:USDCAD, OANDA:EURGBP,
OANDA:EURJPY
📞 Support
Technical Questions: support@signalpilot.io
Deepen your understanding with these articles from the Signal Pilot Blog:
Align your analysis across multiple timeframes
Timeframe SelectionChoose the right timeframes for your analysis approach
💬 Need Help?
Have questions about Augury Grid? Join our Discord community to get help from experienced users, share setups, and discuss approaches!
See Also
Augury Grid Guides:
- ⏱️ Timeframe Configuration Guide - Fix memory crashes, recommended setups by trading style
- 📊 Advanced Learning Guide - Correlation awareness, portfolio psychology, avoiding fake diversification
Related Pages:
- How to Use Screener - Detailed guide for using Augury Grid
- Pentarch v1.0 - Cycle timing on a symbol the grid has surfaced
- Harmonic Oscillator v1.0 - Momentum agreement on that same symbol
- Volume Oracle v1.0 - Whether volume supports the direction the grid found
- All Indicators At A Glance - Quick reference for the whole suite
Disclaimer: This indicator displays signals across 7 symbols × 3 timeframes simultaneously with quality scoring and position management. All signals represent momentum analysis based on MACD detection, trend filtering, and 0-100 quality scoring displayed as stars. Individual interpretation, application, and outcomes vary. Past signal patterns do not guarantee future results. This is not financial advice.