Pentarch - Cycle Phase Detection
Cycle phase detection indicator. Identifies market position across five distinct phases: accumulation, markup, distribution, climax, and decline.
New to Technical Analysis? Start Here
In Plain English: Markets move through phases: quiet accumulation, a push, an overextension, an exhaustion, a breakdown. Pentarch marks which of those five the structure currently matches. It reads the phase you are in, and makes no claim about the one that comes next.
What You'll See on Your Chart: Pentarch shows 5 colored labels that appear above or below price candles. Each label tells you what's happening:
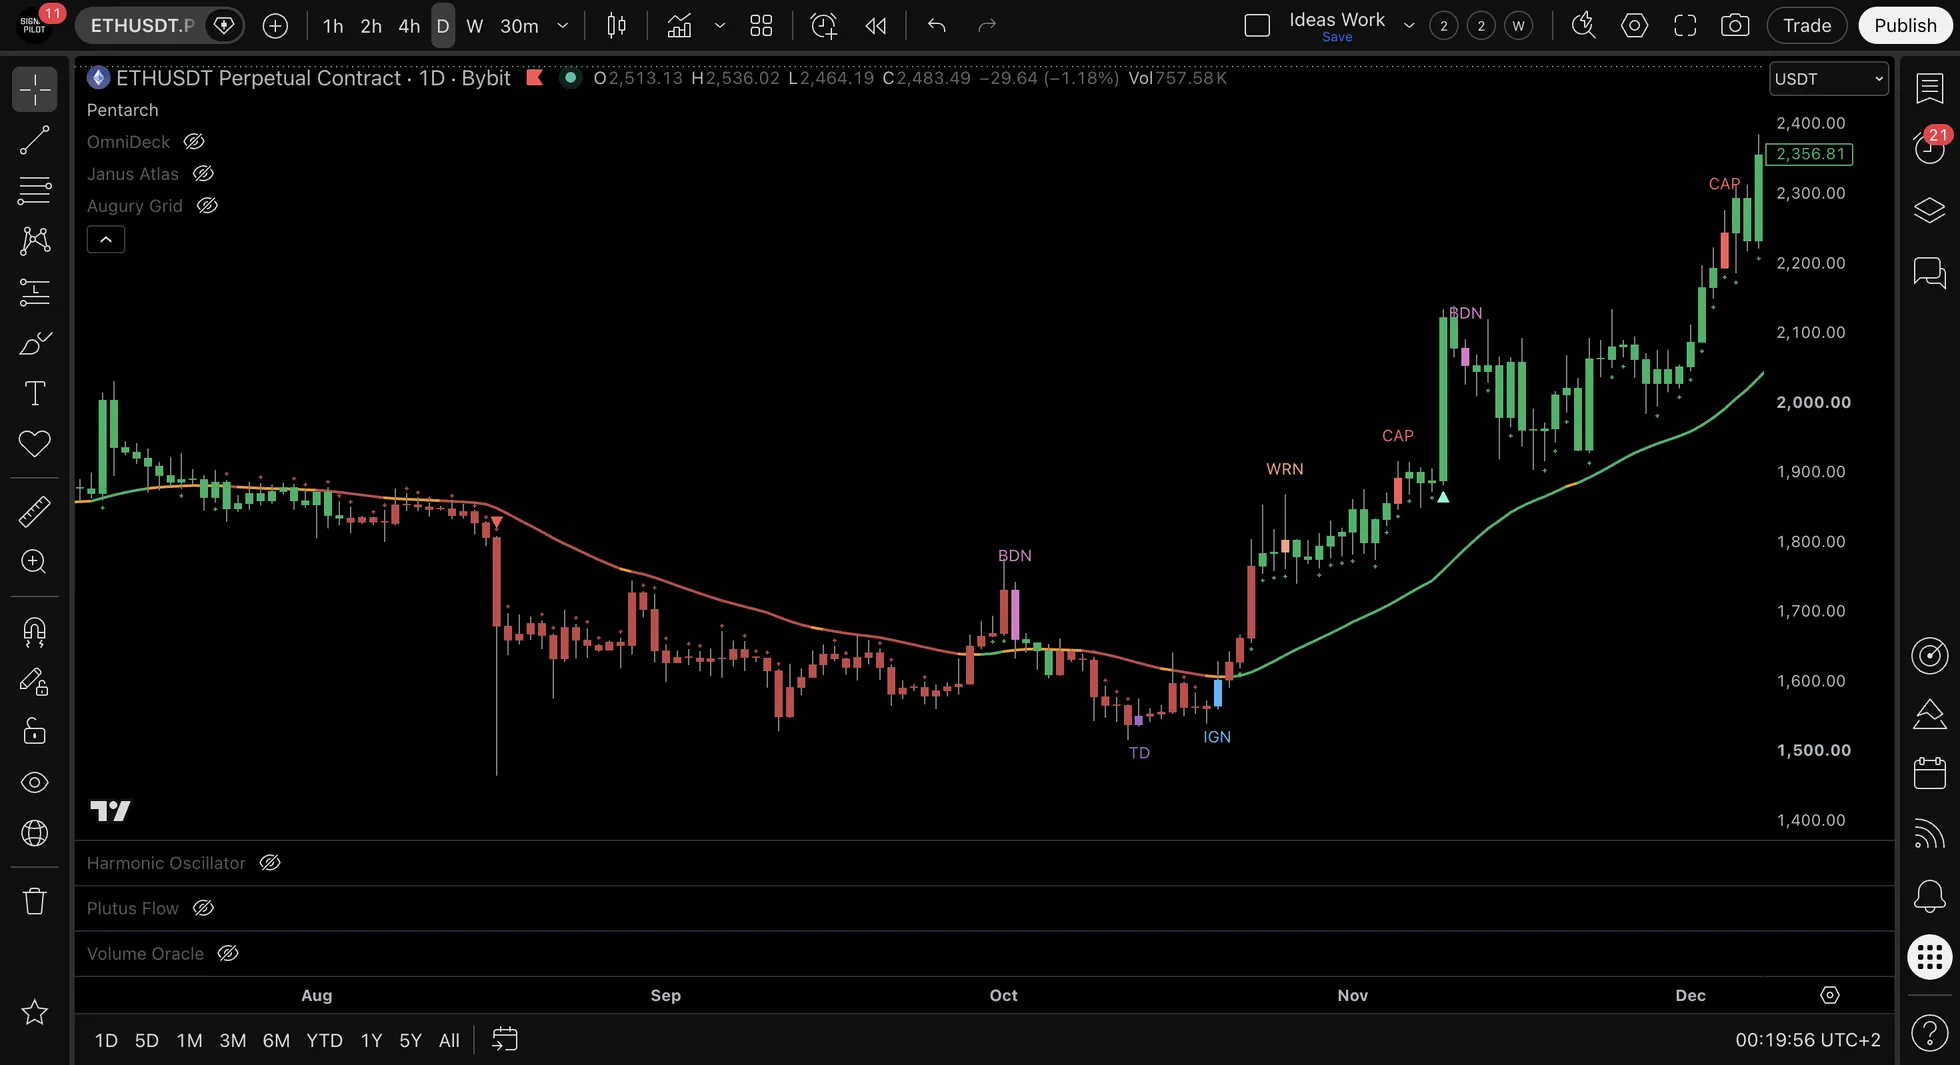
- 🟣 TD (Touchdown) = "Accumulation phase detected: downward exhaustion"
- 🩵 IGN (Ignition) = "Upward momentum is starting: markup phase beginning"
- 🟡 WRN (Warning) = "Price is getting stretched: distribution phase"
- 🟠 CAP (Climax) = "Upward exhaustion detected: climax phase"
- 🔴 BDN (Breakdown) = "Downward pressure detected: decline phase"
How It Works (The Simple Version): Pentarch checks 4 things before showing an event:
- Is the overall market mood bullish or bearish?
- Is price far from the average, or close to it?
- Is momentum building or fading?
- Did the price bar actually close (not just flicker during trading)?
Only when all 4 checks pass does a label appear. This reduces noise.
Beginner Starting Point: Just observe the events for 1-2 weeks. Notice how TD and IGN often appear during accumulation/markup phases, while WRN and CAP appear during distribution/climax phases. The patterns will start to make sense!
🎓 What are "market cycles"?
Markets don't move in straight lines: they move in repeating patterns called cycles. A typical cycle has 5 phases:
- Accumulation: Quiet buying after a decline (TD event)
- Markup: Prices start climbing as more buyers join (IGN event)
- Distribution: Selling begins near the top (WRN event)
- Climax: The peak before reversal (CAP event)
- Decline: Prices fall as sellers dominate (BDN event)
Understanding which phase you're in provides context for market conditions.
🎯 Core Functionality Beginner Friendly
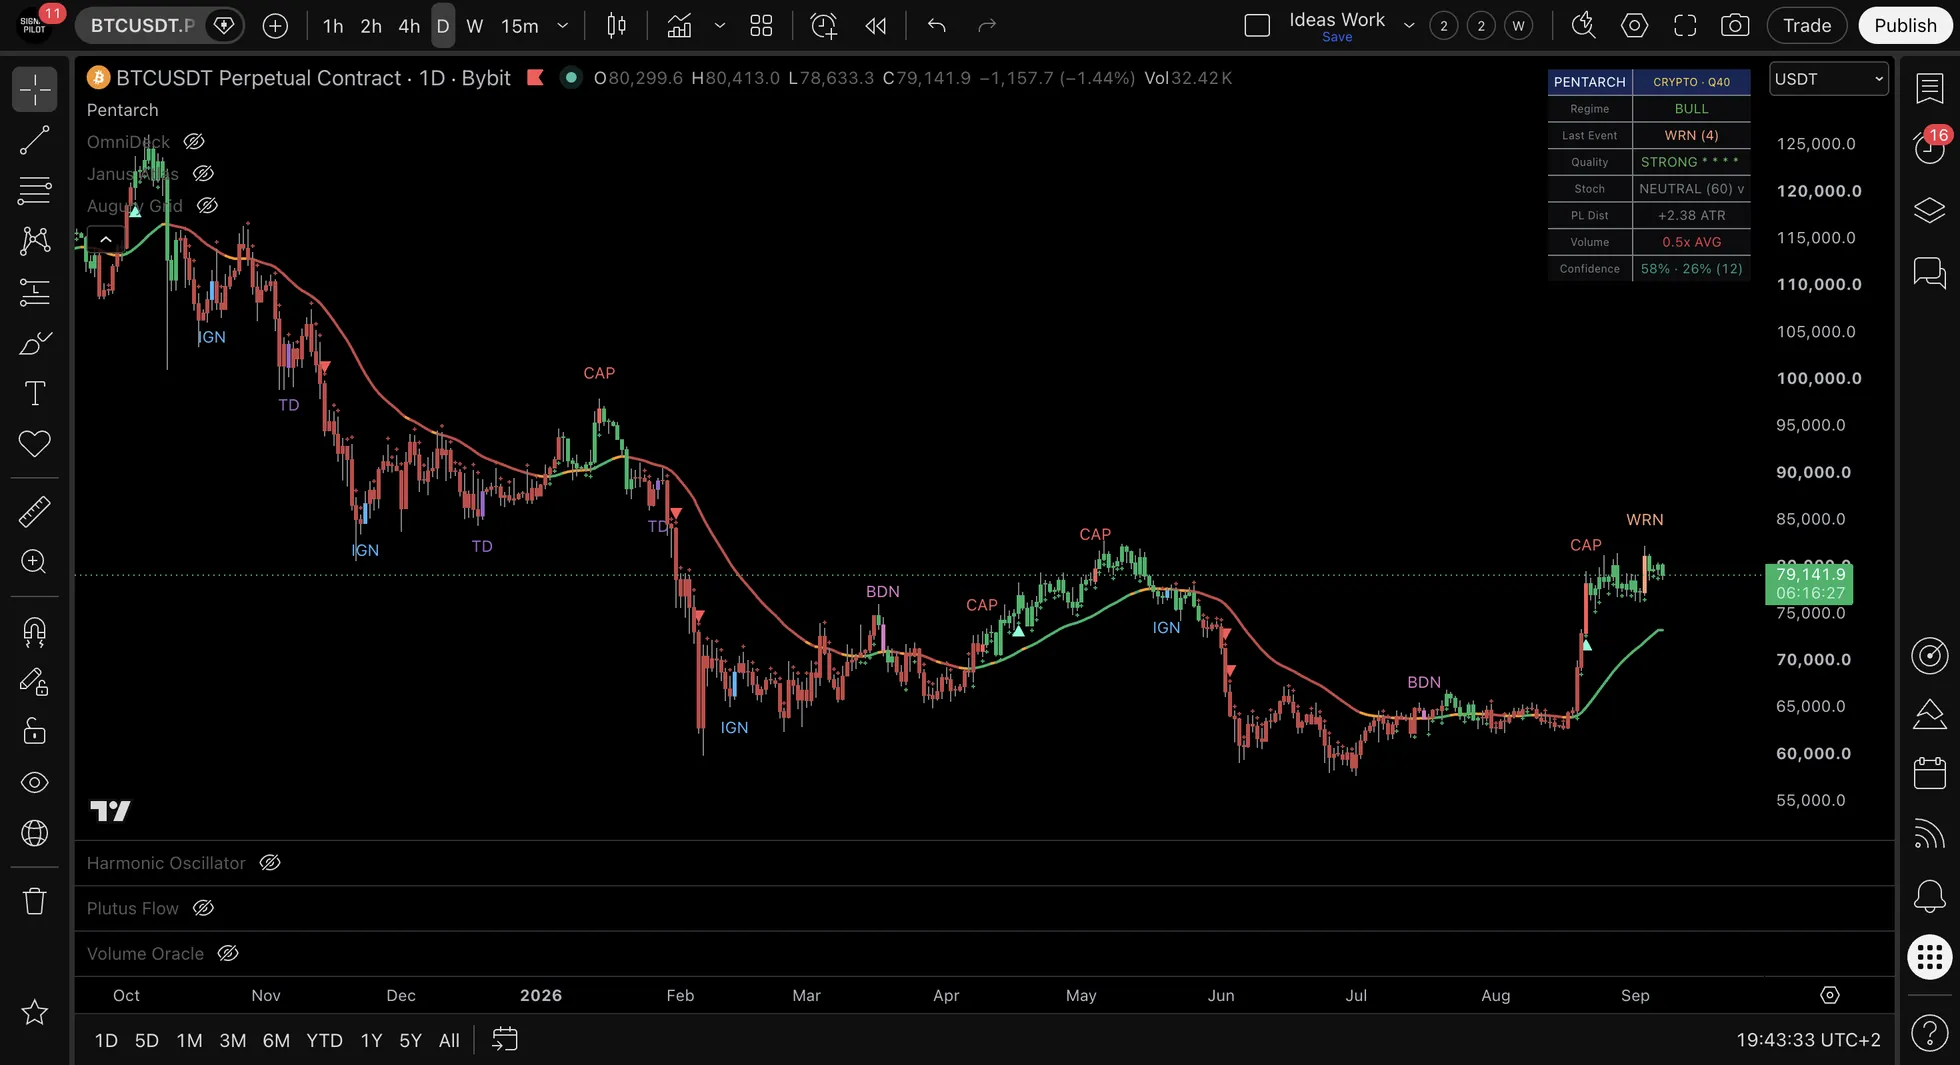
Pentarch displays event labels when four-layer detection conditions align at bar close. Five event types appear as colored labels on the chart:
- TD (Touchdown) - Label below candle
- IGN (Ignition) - Label below candle
- WRN (Warning) - Label above candle
- CAP (Climax) - Label above candle
- BDN (Breakdown) - Label above candle
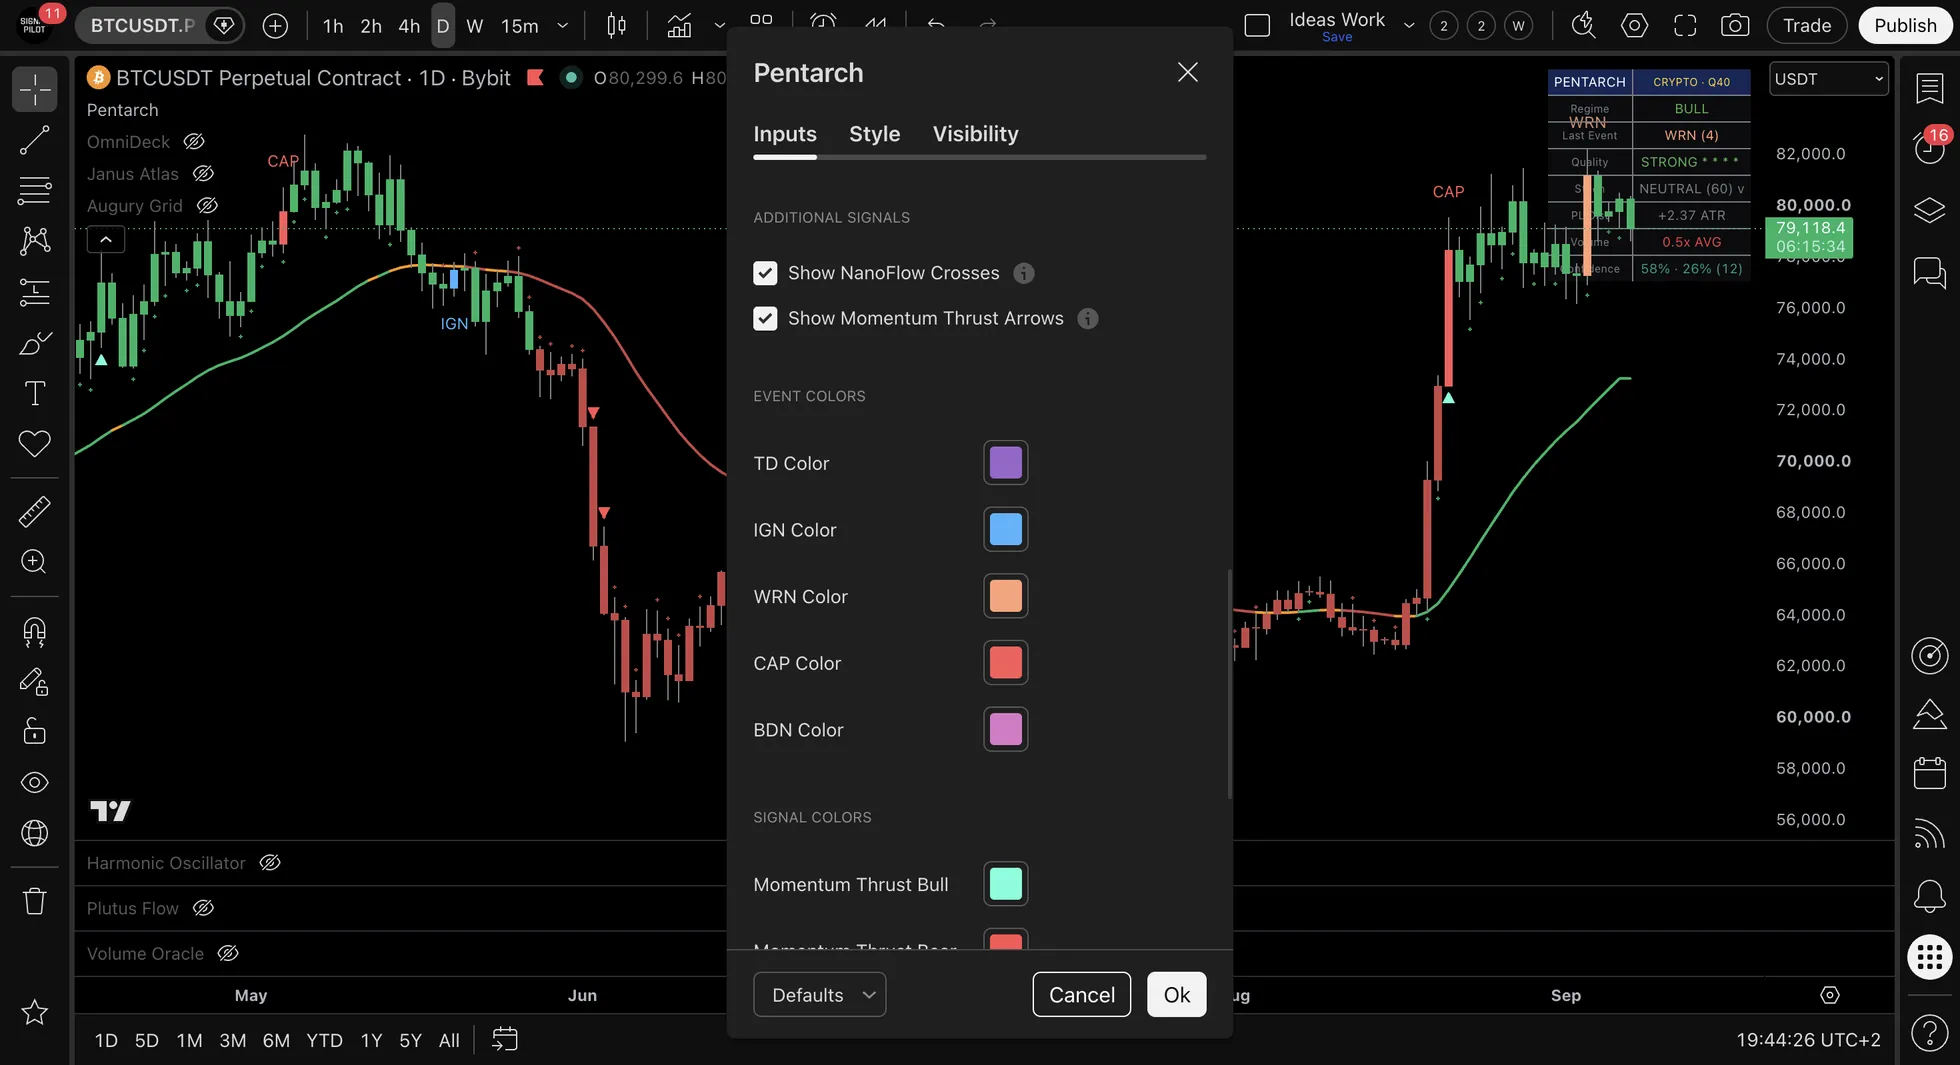
Color Customization: Each event carries its own colour field in settings. The defaults are TD purple, IGN blue, WRN salmon, CAP red and BDN pink. Any of the five can be changed on its own.
Detection Method: Four-layer confirmation system:
| Layer | What It Checks |
|---|---|
| 1. Regime classification | Which phase of the cycle is running: accumulation, markup, distribution, climax or decline |
| 2. Pilot line distance | Distance between price and the dynamic moving average baseline |
| 3. Momentum validation | Strength and direction of price movement |
| 4. Bar close confirmation | Signal confirmed only after candle closes (prevents repainting) |
Events appear only when all four layers align.
Timeframe Compatibility: Works on all timeframes.
⚙️ Settings
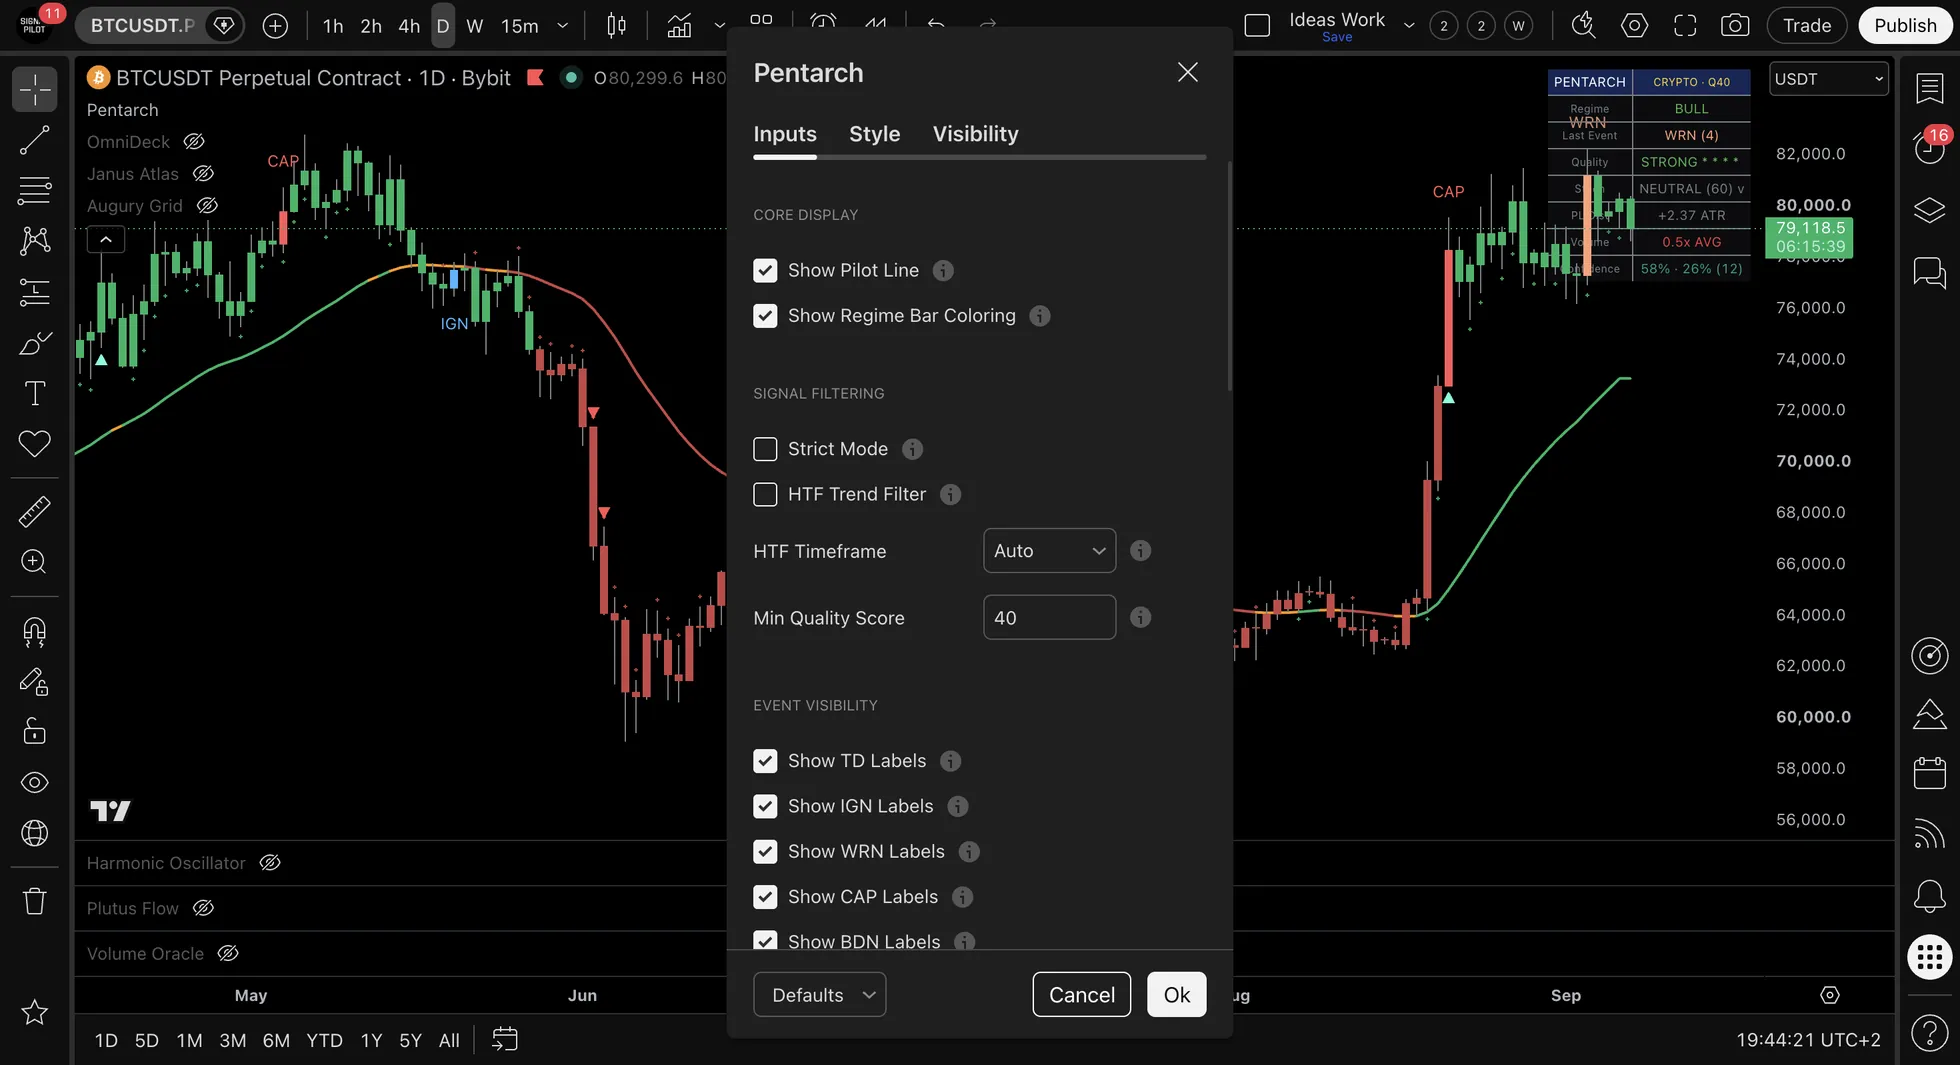
Available configuration options:
| Setting | Options | Default |
|---|---|---|
| Core Display | Show Pilot Line, Show Regime Bar Coloring | Both on |
| Signal Filtering | Strict Mode and HTF Trend Filter, each on its own, plus the HTF Timeframe the filter reads: Auto, 1H, 4H, Daily or Weekly | Both filters off, timeframe Auto |
| Min Quality Score | 0 to 85, in steps of 5. 0 turns the filter off | 40 |
| Event Visibility | Show TD, IGN, WRN, CAP and BDN Labels, each on its own | All on |
| Label Size | Tiny, Small, Normal, Large | Tiny |
| Info Panel | Show the panel, place it in one of nine positions, and switch each of its seven rows on or off | Panel on, top right, every row on |
| Additional Signals | Show NanoFlow Crosses, Show Momentum Thrust Arrows | Both on |
| Event Colors | One colour field per event | Purple, blue, salmon, red, pink |
| Alert Toggles | TD, IGN, WRN, CAP, BDN (individual on/off) | All enabled |
Note: Color customization available for all five event types in indicator settings.
🎨 Recommended Chart Styling
To match the chart appearance used in our documentation and tutorials, configure your TradingView candle settings as follows:
| Setting | Recommended Value | Notes |
|---|---|---|
| Body | Green / Red | Standard up/down colors (enable "Color bars based on previous close") |
| Borders | Off (unchecked) | Disable candle borders for cleaner appearance |
| Wick | Grey | Use neutral grey for wicks to reduce visual noise |
How to Configure:
- Right-click on your chart and select Settings (or click the gear icon)
- Navigate to the Symbol tab → Candles section
- Enable "Color bars based on previous close"
- Set Body colors to green (up) and red (down)
- Uncheck Borders to disable them
- Set Wick color to grey
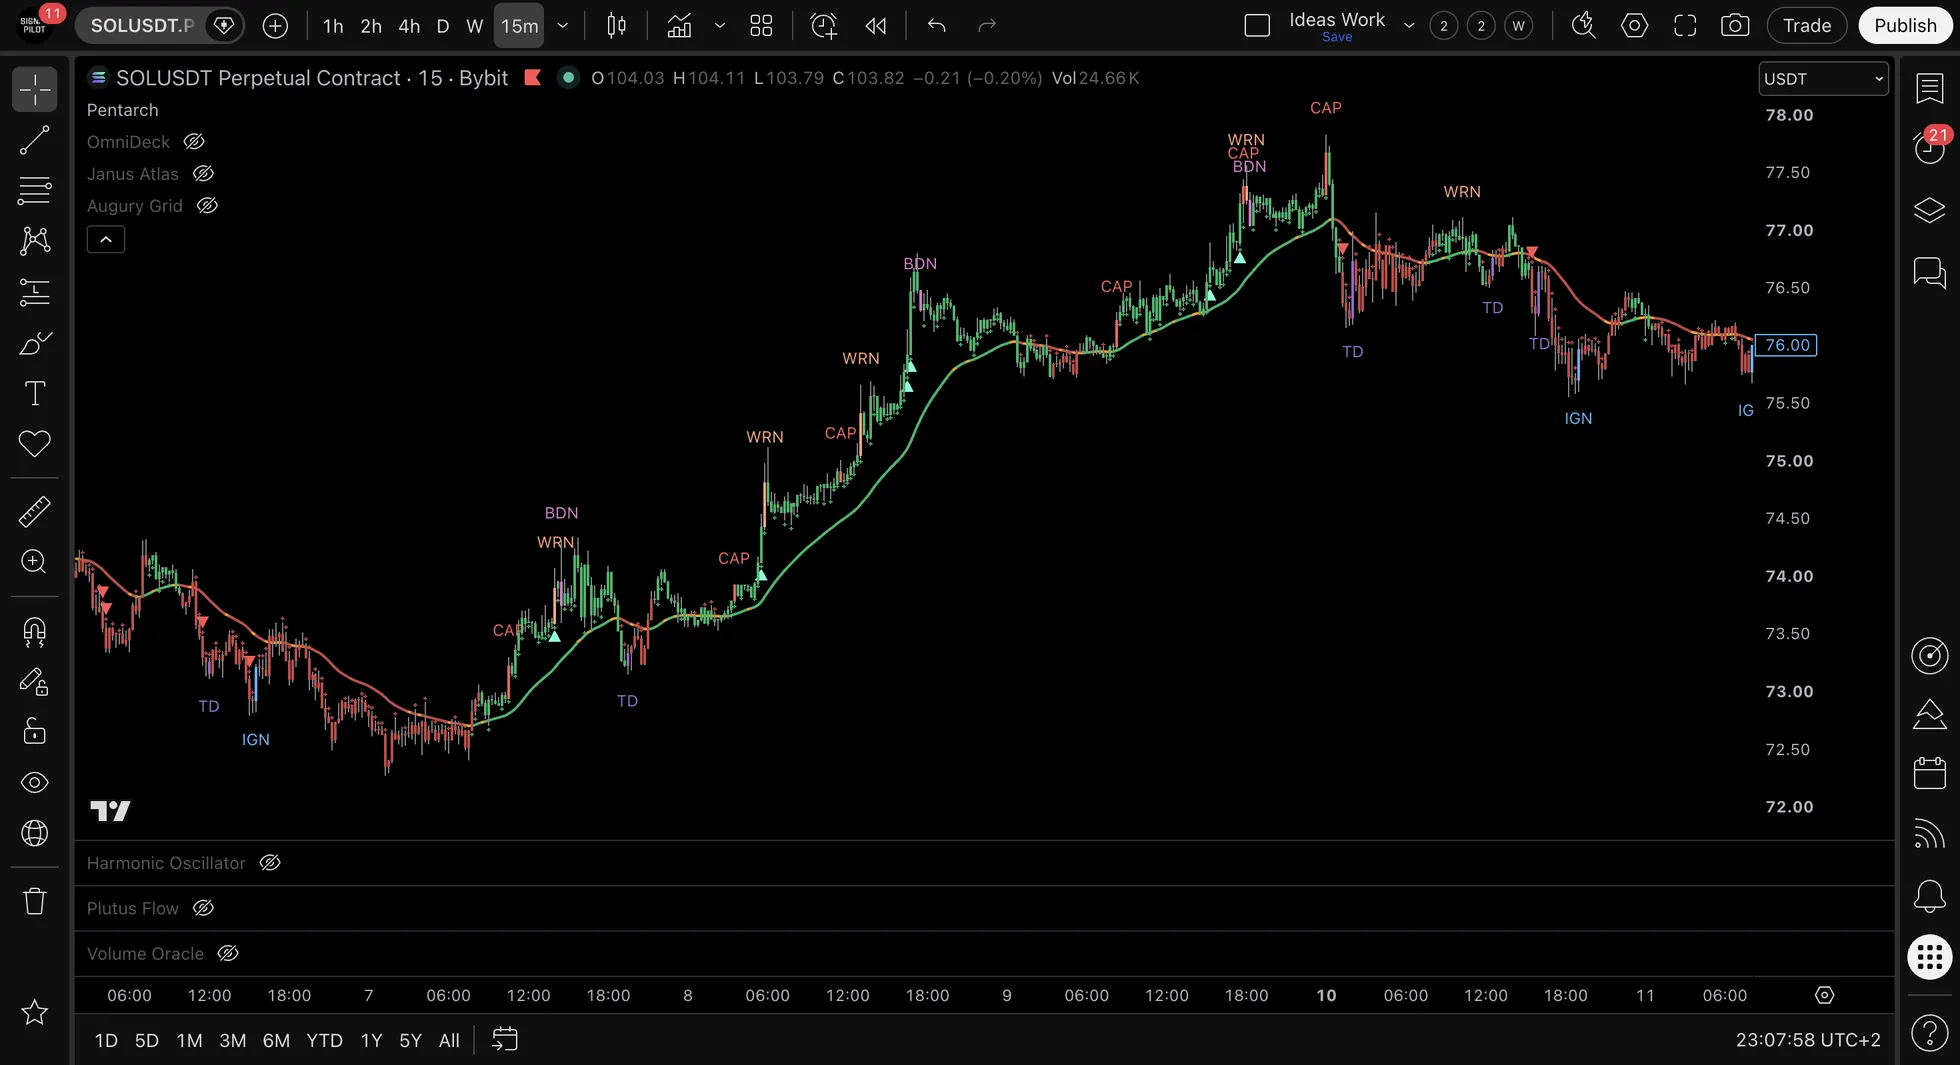
🟣 TD: Touchdown (Accumulation Phase)
| Visual Display: | "TD" label appears below candle |
| Default Color: | Purple (customizable) |
Detection Conditions:
- Price extended below Pilot Line threshold
- Oversold regime conditions present
- The NanoFlow micro-trend agrees
- All conditions confirm at bar close
Phase Indication: Accumulation phase conditions detected. Indicates potential transition from decline into accumulation.
Example: Stock declines from $100 to $85, TD event appears → Accumulation phase identified.
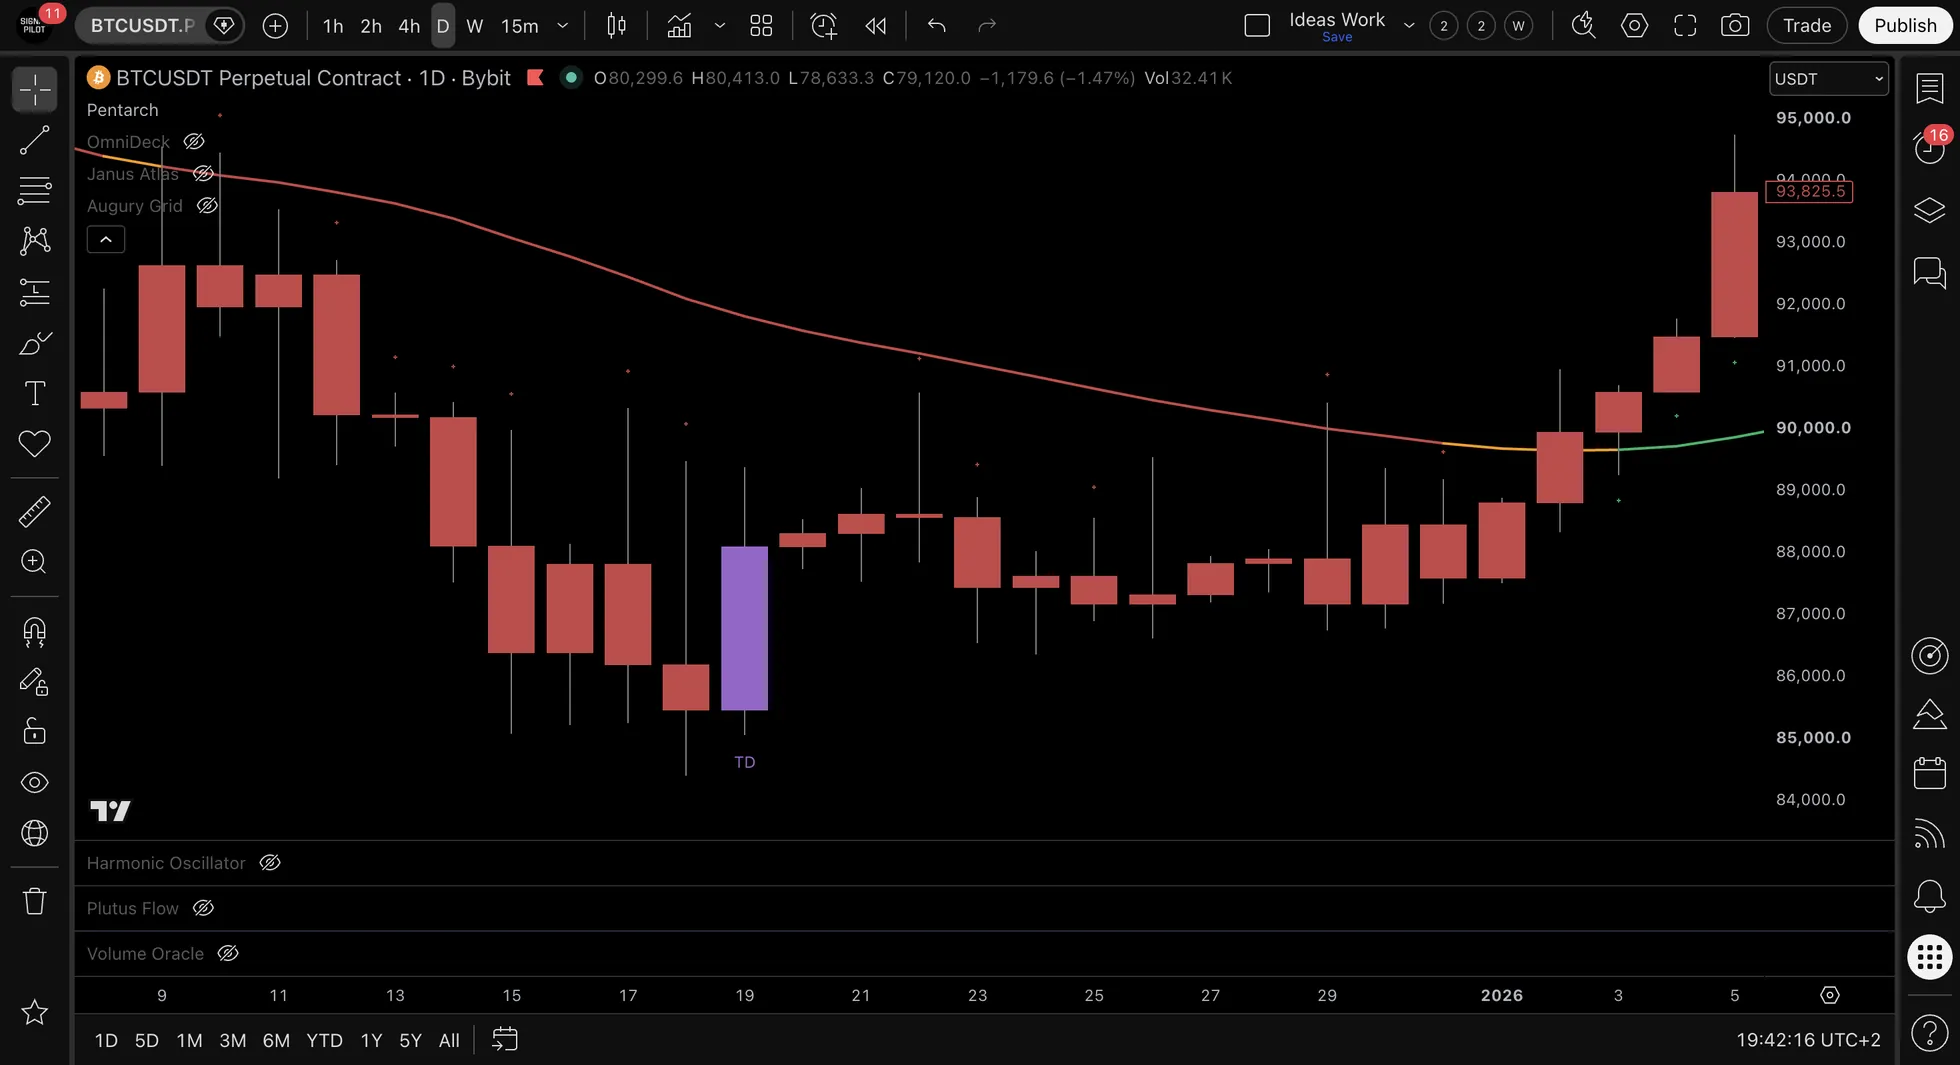
🩵 IGN: Ignition (Markup Phase)
| Visual Display: | "IGN" label appears below candle |
| Default Color: | Blue (customizable) |
Detection Conditions:
- Momentum breakout conditions met
- Bullish structure shift confirmed
- All four detection layers aligned
- Bar close confirmation
Phase Indication: Markup phase beginning detected. Indicates potential transition from accumulation into bullish momentum.
Example: After TD at $85, IGN appears at $87 → Markup phase identified.
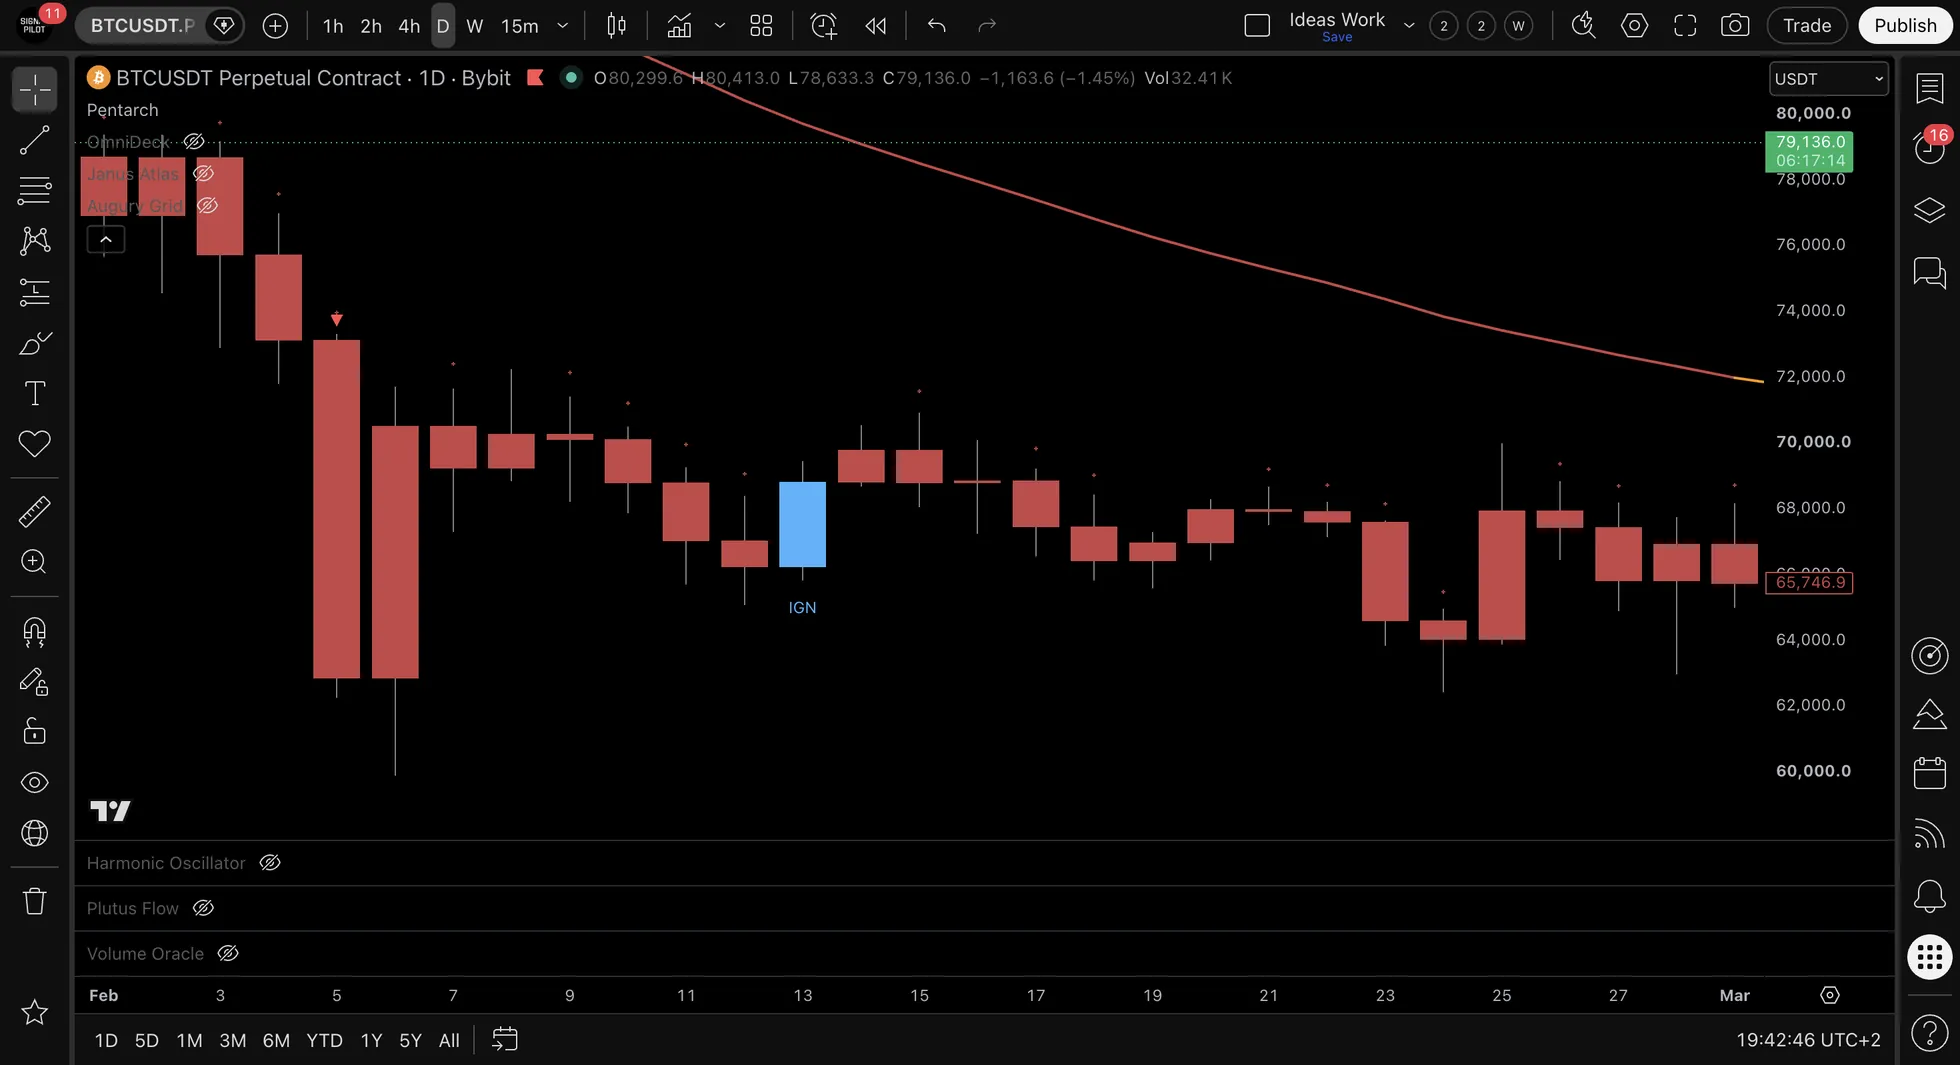
🟡 WRN: Warning (Distribution Phase)
| Visual Display: | "WRN" label appears above candle |
| Default Color: | Salmon (customizable) |
Detection Conditions:
- Price extended above Pilot Line threshold
- Overbought regime conditions present
- Momentum weakening characteristics
- Distribution phase indicators present
Phase Indication: Distribution phase conditions detected. Indicates potential transition from markup into distribution.
Example: Stock rallies to $115, WRN appears → Distribution phase identified.
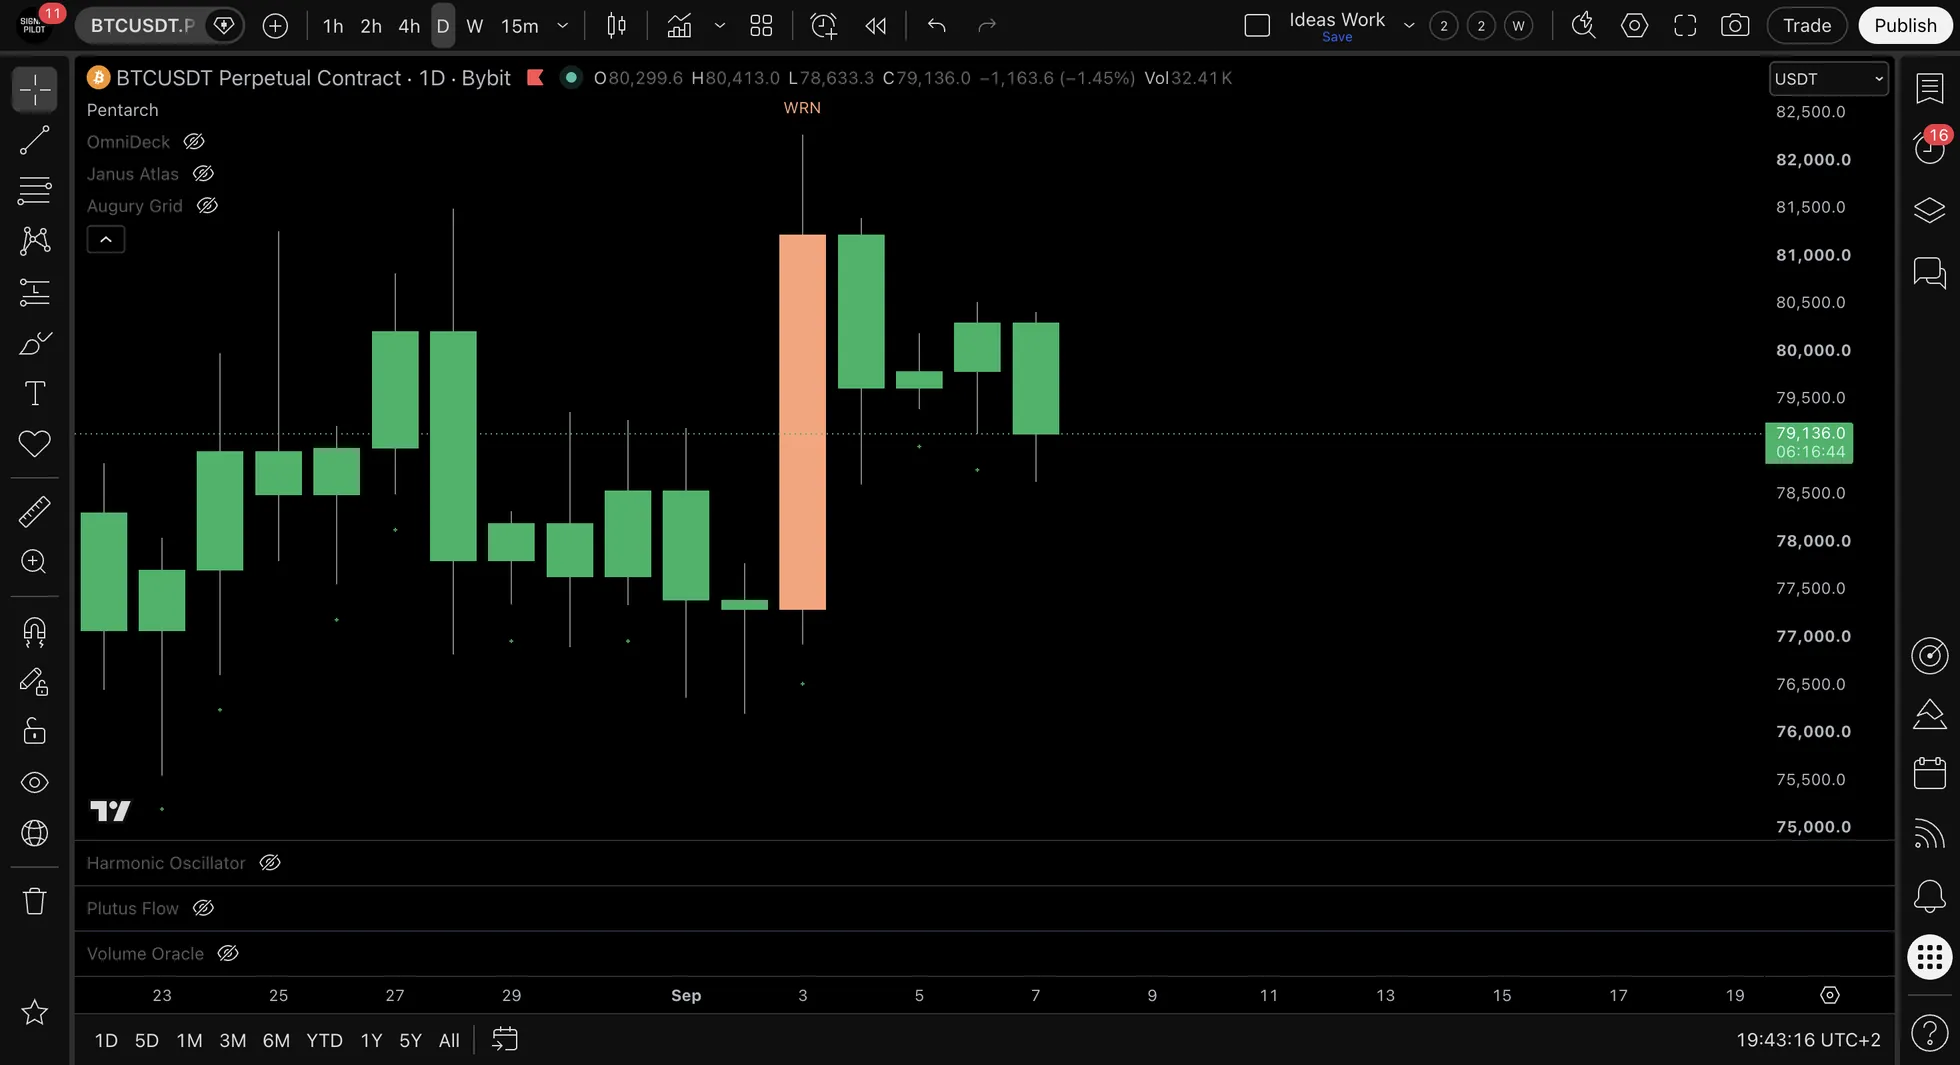
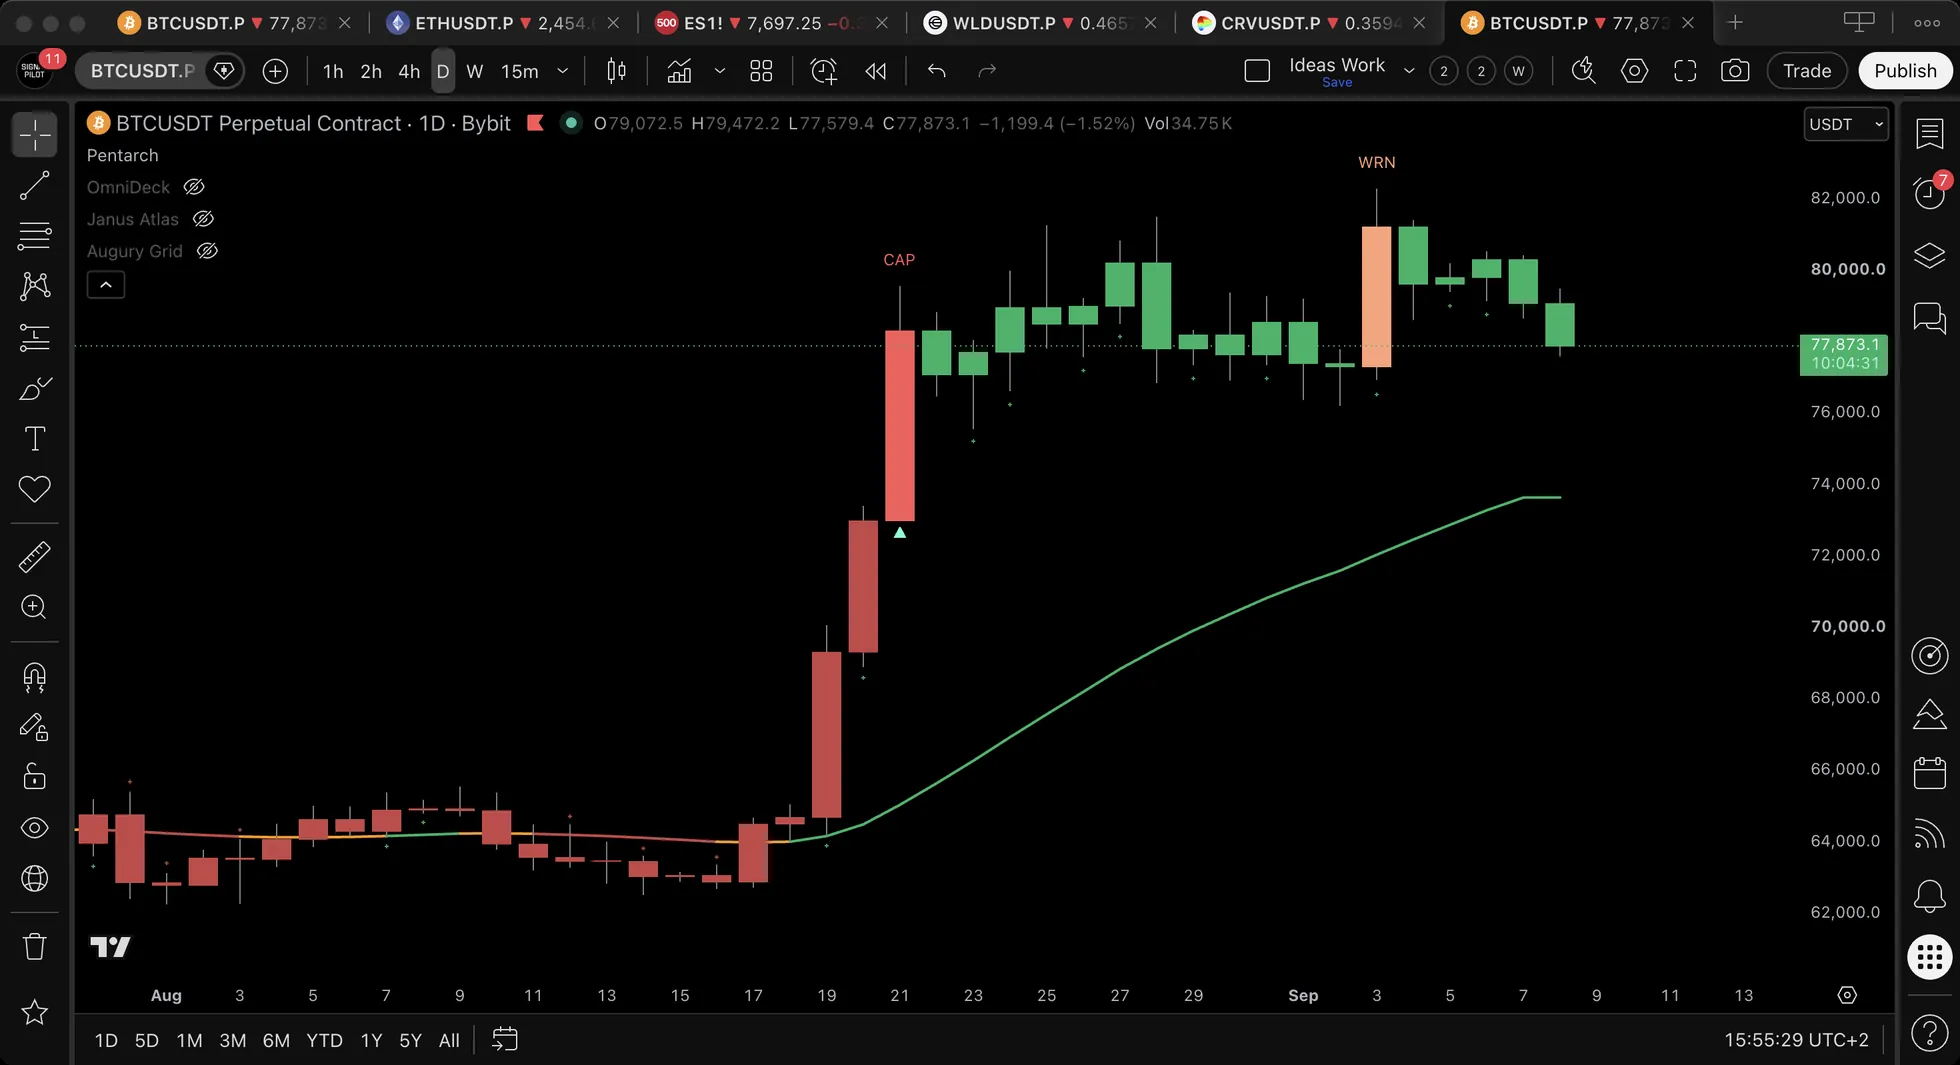
🟠 CAP: Climax (Climax Phase)
| Visual Display: | "CAP" label appears above candle |
| Default Color: | Red (customizable) |
Detection Conditions:
- Extreme extension from Pilot Line threshold
- Climax exhaustion across all layers
- Peak momentum characteristics
- Bar close confirmation
Phase Indication: Climax phase conditions detected. Indicates late-cycle exhaustion characteristics.
Example: After WRN at $115, CAP appears at $120 → Climax phase identified.
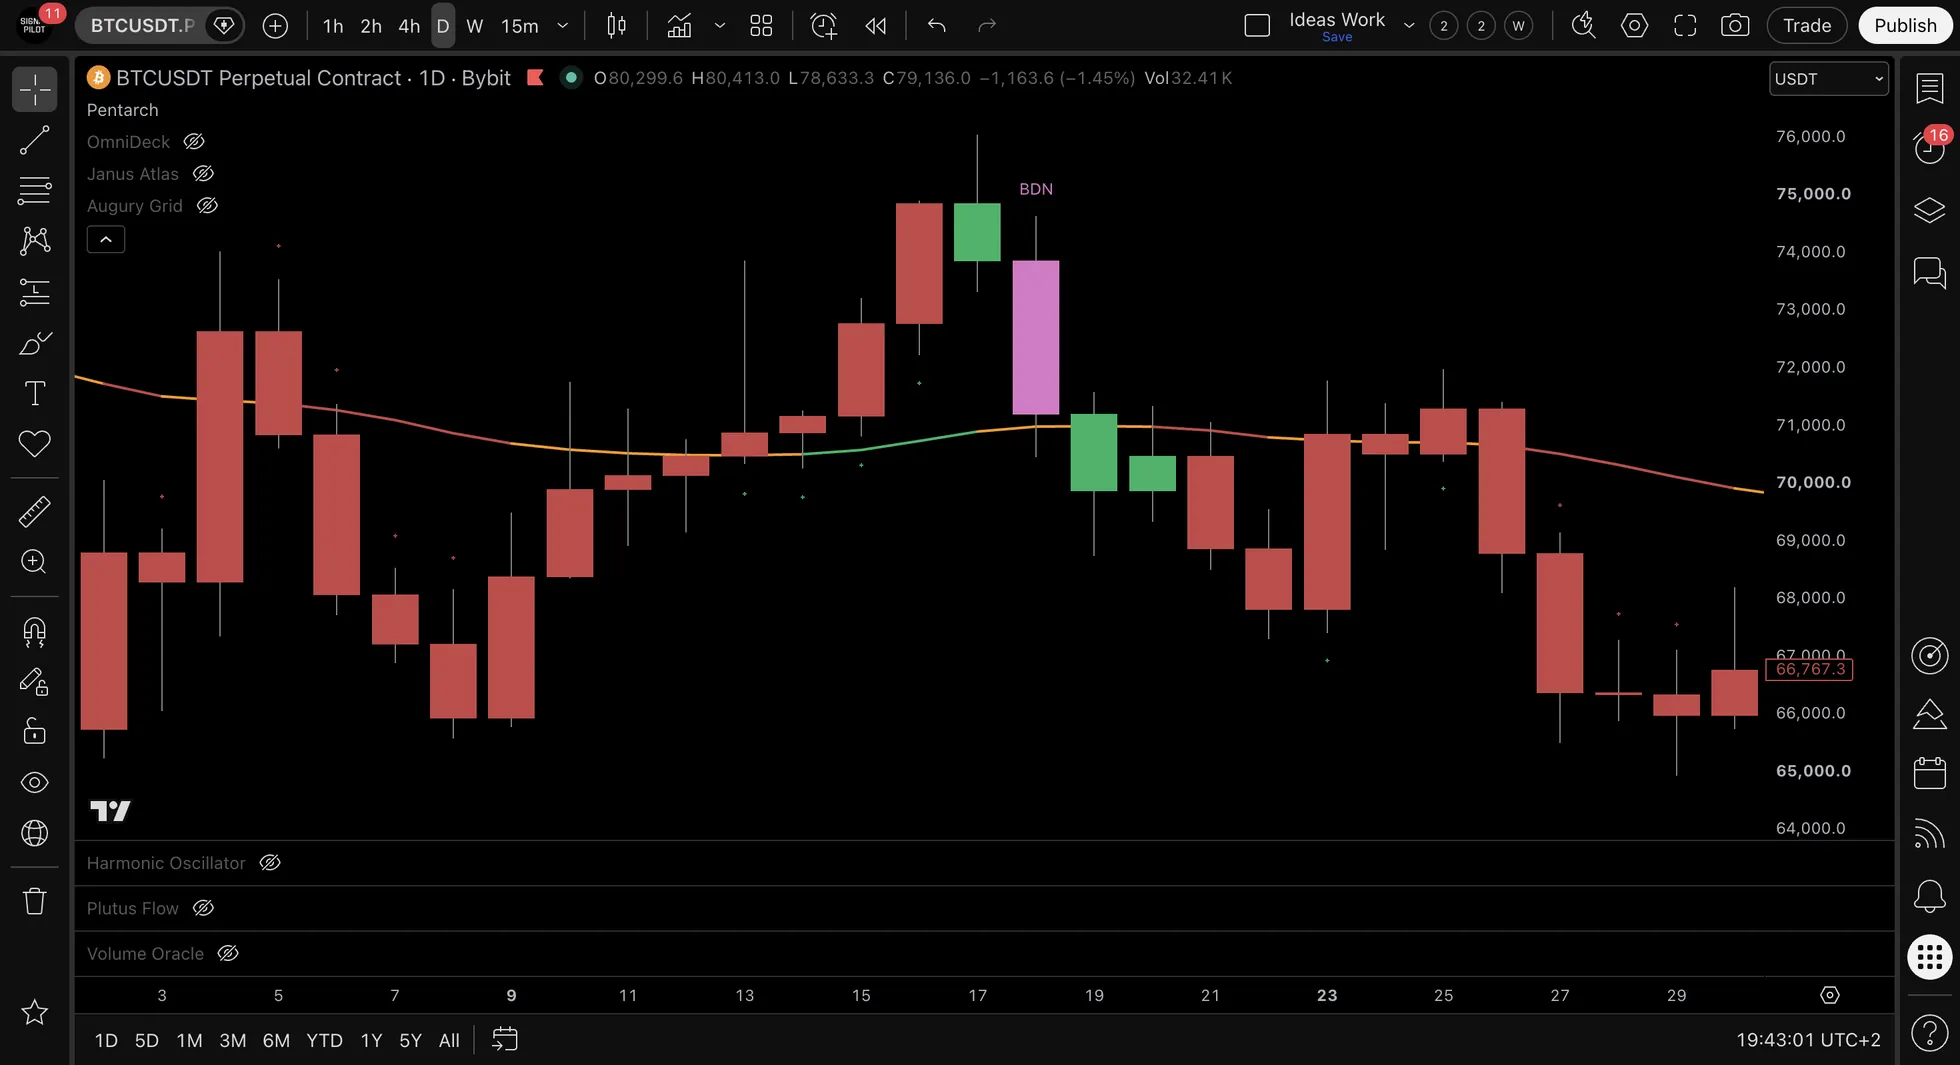
🔴 BDN: Breakdown (Decline Phase)
| Visual Display: | "BDN" label appears above candle |
| Default Color: | Pink (customizable) |
Detection Conditions:
- Bearish structure break confirmed
- Decline phase characteristics present
- Four-layer bearish alignment
- Bar close confirmation
Phase Indication: Decline phase initiation detected. Indicates transition from climax into decline cycle.
Example: After CAP at $120, BDN appears at $113 → Decline phase identified.
✅ Knowledge Check
Question: Which Pentarch events are considered "Early-Cycle" events?
📚 Event Sequence Patterns Intermediate
Pentarch displays various event sequences. Some observed patterns include:
Full Cycle Pattern:
TD → IGN → WRN → CAP → BDN
(Complete cycle: Accumulation through Decline)
Partial Cycle Patterns:
TD → IGN (Early cycle only)
WRN → CAP (Late cycle only)
IGN → WRN (Markup to distribution)
Reversal Patterns:
BDN → TD → IGN (Decline to markup reversal)
CAP → BDN → TD (Climax to accumulation)
Interpretation of these patterns varies based on individual methodology. No pattern guarantees any specific outcome.
📖 A Worked Example: A Full Cycle on a 4-Hour Chart
(An illustration with round numbers, not a record of any real period. Educational only. Not financial advice.)
4-Hour Chart: Full Cycle Observation:
| Bar | Signal | Price | Phase | Notes |
|---|---|---|---|---|
| Bar 1 | TD | 4,650 | Accumulation | Oversold conditions |
| Bar 8 | IGN | 4,685 | Markup | Momentum breakout |
| Bar 24 | WRN | 4,755 | Distribution | Extended conditions |
| Bar 29 | CAP | 4,780 | Climax | Exhaustion detected |
| Bar 37 | BDN | 4,720 | Decline | Structure break |
Observed Move: TD to CAP = +130 points, CAP to BDN = -60 points
Pattern Type: A complete five-event cycle across thirty-seven 4-hour bars.
This example demonstrates event appearance sequence. Individual interpretation and subsequent actions vary.
🎯 The Pilot Line: Trend Reference Intermediate
Visual Display: Line on chart tracking dynamic trend position
Functionality:
- Adaptive trend line adjusts to price movement
- Serves as reference for event distance calculations
- Changes color based on regime classification
- Updates continuously with each bar
Distance Measurement:
- TD events: Price extended below line
- IGN events: Price structure shifts bullish relative to line
- WRN events: Price extended above line
- CAP events: Extreme extension above line
- BDN events: Price breaks below line bearishly
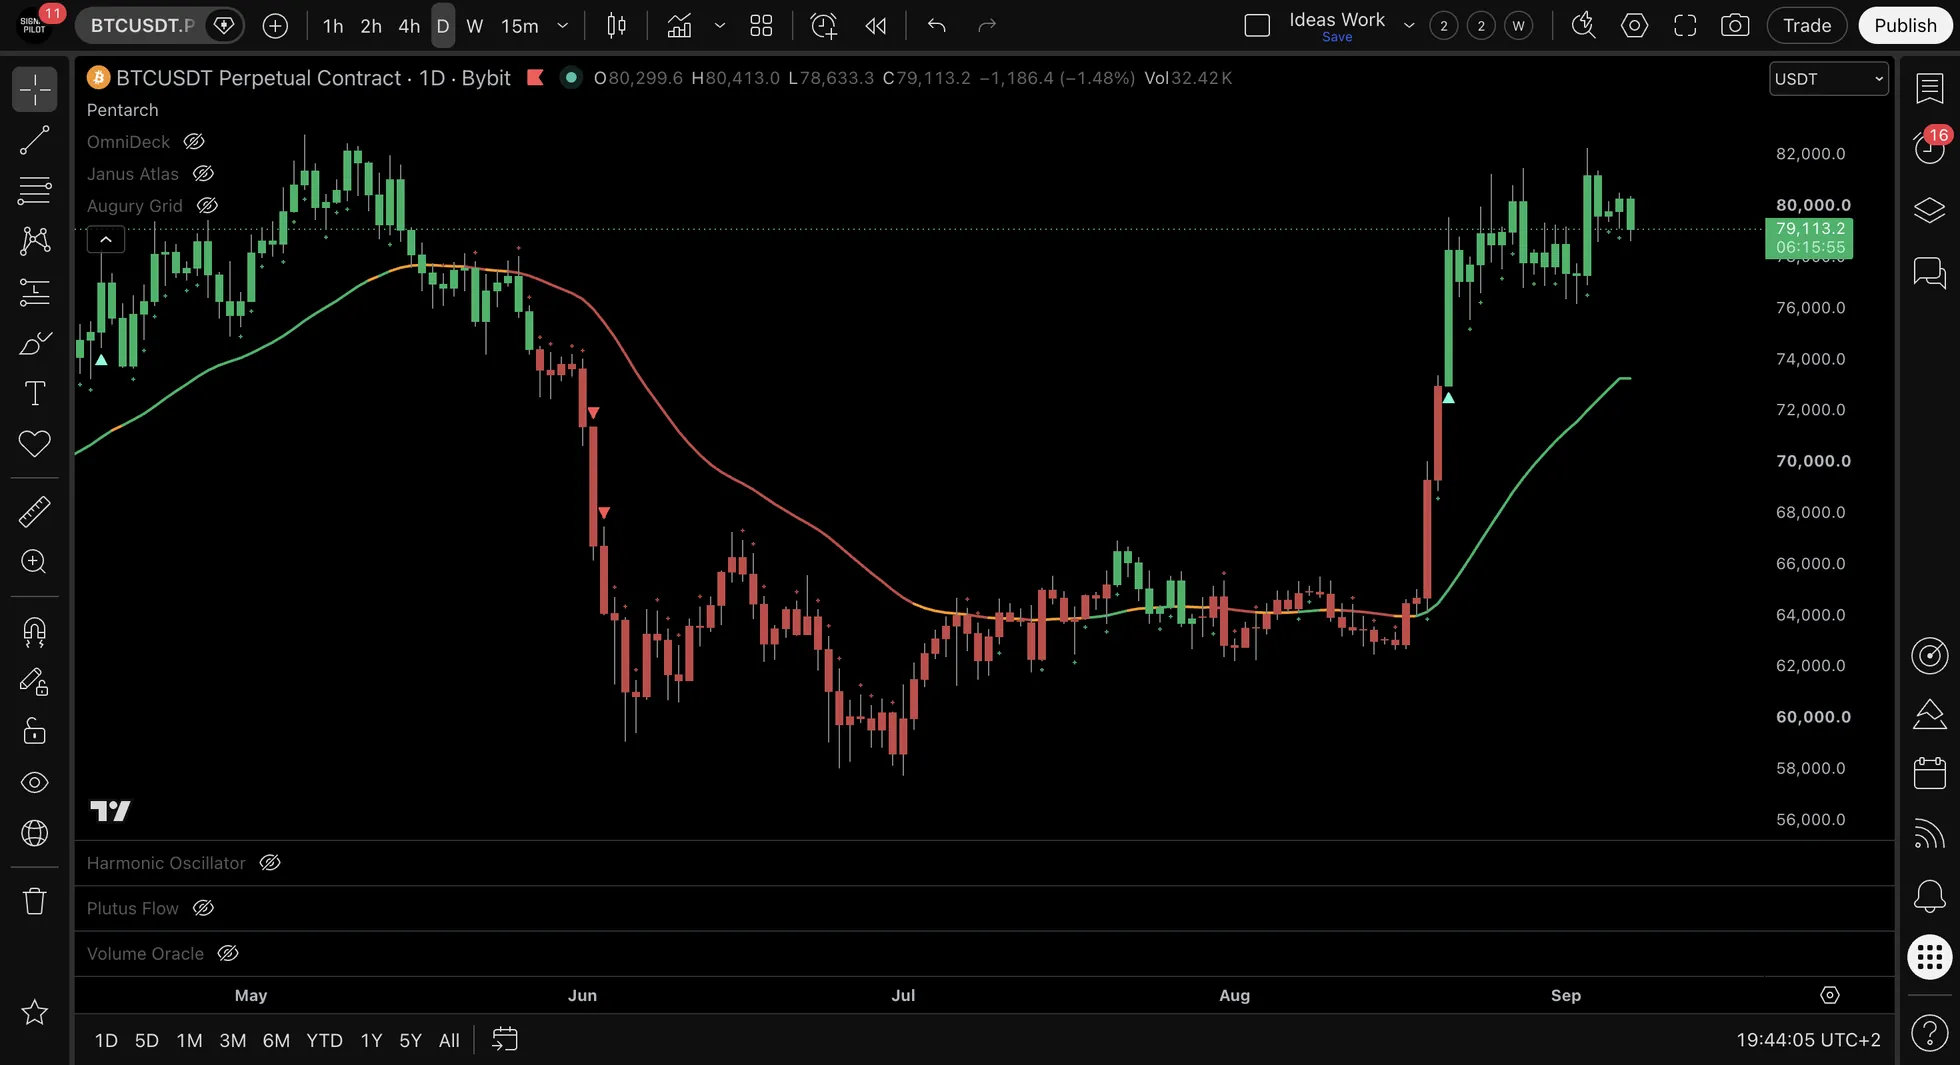
Color States:
- Blue = Bearish regime identified
- Green = Bullish regime identified
- Gray = Neutral/transitional conditions
Pilot Line provides visual reference for cycle position. Interpretation varies by individual approach.
🎨 Regime Bar Colors: Market Structure Visualization Intermediate
Visual Display: Candle body colors change based on regime classification
Color Meanings:
| Color | Regime | Conditions |
|---|---|---|
| Green | Bullish | Price structure shows bullish characteristics |
| Red | Bearish | Price structure shows bearish characteristics |
| Gray | Neutral | Transitional or unclear structure |
Functionality:
- Updates every bar based on regime analysis
- Provides visual context for event appearance
- Independent of event generation
Relationship to Events:
- IGN events appear during bullish regime transitions
- BDN events appear during bearish regime transitions
- TD/WRN/CAP can appear in various regimes
Regime colors provide structure context. Individual interpretation varies.
Remember: Gray (neutral) regime bars indicate transitional periods where event reliability decreases. TD and IGN events during clear green/red regime bars have more context than events during gray choppy periods. Regime clarity provides better context for analysis.
⚡ NanoFlow: The Micro-Trend Crosses Intermediate
Visual Display: Cross marks drawn on the candles themselves
Functionality:
- Reads the micro-trend, the direction of the move bar by bar
- Marks each bar as leaning up or leaning down
- Green for a bullish micro-trend, red for a bearish one
- Updates each bar
Event Relationship:
- IGN needs the micro-trend to be bullish
- BDN needs the micro-trend to be bearish
- TD, WRN and CAP each need the micro-trend in a particular state
Reading the crosses:
- A green cross marks a bar leaning with the buyers
- A red cross marks a bar leaning with the sellers
- Where the colour changes, the micro-trend has turned
NanoFlow is a reading in its own right, not a gate. No event is accepted or rejected on it, and it carries its own two alerts.
🔄 Four-Layer Detection System Advanced
Price → L1: Regime → L2: Pilot → L3: Extension → L4: Confirm → Event or Wait
⚡ Layer Priority: Layer 1 (Regime Classification) is the most critical filter. If Layer 1 fails, the event is rejected regardless of other layers. All 4 layers must confirm for event to fire.
Technical Methodology:
Layer 1: Regime Classification
- Analyzes price structure patterns
- Identifies bullish, bearish, or neutral conditions
- Provides foundational context for events
Layer 2: The Credential Gate
- Looks back over a window that widens with the timeframe
- Requires the stochastic to have reached the opposite extreme inside it
- Stops a top event firing where no top was built, and a bottom event where no bottom was
Layer 3: Extension and Participation
- Measures how far price sits from the Pilot Line, in ATR
- Checks volume against its own average
- Both thresholds are set per timeframe and adjusted for the asset class
Layer 4: Bar Close Confirmation
- All conditions must hold at bar close
- Prevents mid-bar false events
- Ensures stability before event display
Event Generation: All four have to hold at the same bar close. No mid-bar events occur.
Two more filters stand between a qualified event and one you see. A cooldown, plus a reset rule that keeps the same event from firing again until the stochastic has returned to neutral. And an exclusivity ladder: at most one event is drawn per bar, ranked CAP, then WRN, then BDN, then IGN, then TD. Because TD sits last, a touchdown that qualifies on the same bar as a climax or a warning is never drawn. Two hollow markers below the bar now say when a TD or an IGN was outranked, and three alert conditions report it, so the suppression is visible rather than silent.
NanoFlow is not one of the layers. It is drawn from the same fast moving averages the layers use, and it has its own two alerts, but no event is accepted or rejected on it.
✅ Knowledge Check
Question: How many detection layers must confirm simultaneously for a Pentarch event to appear?
🧭 How Pentarch Calibrates Itself Advanced
Three mechanisms sit underneath the four layers and move the thresholds those layers test against. None of them is a setting you switch on. All three run from the first bar, and together they are why the same Min Quality Score behaves differently on EURUSD than on BTCUSDT.
Asset class scaling
Pentarch reads the instrument's class from TradingView and scales seven dimensions by it. Crypto is the baseline at 1.00, because the per-timeframe arrays were tuned on crypto. Every other class is expressed relative to that.
| Dimension | Crypto | Stock | Forex | Futures | Index, fund |
|---|---|---|---|---|---|
| Overbought level | 1.00 | 0.96 | 0.88 | 0.96 | 0.92 |
| Oversold level | 1.00 | 1.05 | 1.15 | 1.05 | 1.10 |
| Volume threshold | 1.00 | 0.85 | 0.45 | 0.90 | 0.55 |
| Distance from the Pilot Line | 1.00 | 0.75 | 0.55 | 0.80 | 0.70 |
| Body ratio | 1.00 | 0.88 | 0.60 | 0.85 | 0.82 |
| Cooldown length | 1.00 | 1.15 | 0.90 | 1.10 | 1.15 |
| Cycle tempo baseline | 1.00 | 1.20 | 1.40 | 1.15 | 1.20 |
Forex moves furthest from the baseline, and for reasons you can read off the row. Its volume figure is a tick count rather than traded size, so the volume threshold falls to 0.45. Its ranges compress, so the overbought level comes down and the oversold level goes up. Its bars carry proportionally more wick, so the body requirement drops to 0.60. Stocks and futures gap between sessions, so their cooldowns lengthen. An instrument whose class TradingView does not report falls back to the crypto column.
Strict Mode multiplies on top of this, a flat 1.5 applied to the already scaled values.
Adaptive calibration
Asset class scaling knows what kind of instrument this is. Adaptive calibration measures what this particular instrument has been doing on this particular timeframe.
The measuring window is anchored to two hundred daily bars and rescaled for the chart's timeframe, with a floor of 50 bars and a ceiling of 200. From one minute to four hours it sits at the ceiling. On weekly and monthly charts it sits at the floor, which is roughly a year of weekly bars and four years of monthly ones.
| Measured | Statistic | Feeds |
|---|---|---|
| Stochastic | 90th and 10th percentile | the overbought and oversold levels |
| Distance from the Pilot Line | 90th and 10th percentile | the extension thresholds |
| Volume against average | 95th percentile | the volume spike threshold, clamped to 1.3 and 2.5 |
| Candle body ratio | median | the minimum body a bar has to show |
| Bar range against ATR | 95th percentile | the big bar threshold |
| Cycle tempo | mean bars between stochastic crossings of 50 | the cooldowns and several timing windows |
A measured value never replaces the static one. It is blended in at 40 percent once the window is full, against a 60 percent floor of the hand-tuned setting, and the blend ramps up from zero across the first window so an instrument with little history is not calibrated off noise.
The blend only ever loosens. Every dimension is wrapped in a guard that permits a threshold to relax and refuses to let it tighten. The overbought level can only come down, the oversold level can only go up, the body minimum can only fall, the big bar threshold can only fall, and the reset rule can only get easier to satisfy. An instrument the static arrays already fit is left alone. One whose stochastic compresses beyond what the arrays expect gets levels it can actually reach.
Cycle tempo is the exception in kind rather than in direction. It is a ratio clamped between 0.7 and 1.3 that multiplies the five cooldowns and several timing windows, so a market cycling faster than its timeframe baseline gets shorter cooldowns and one cycling slower gets longer ones.
Accuracy feedback
The third mechanism watches what happened after each event and feeds it back into the next one.
When an event prints, Pentarch records the price and the ATR at that bar, then follows the running extreme for a fixed number of bars. The window is 20 bars on low timeframes, 15 on mid, 10 on high, 8 on position and 6 above that, scaled by the same cycle tempo ratio, with a floor of 4.
| Event | Counted as a hit when |
|---|---|
| TD | price reached one ATR above the event bar |
| IGN | price reached one and a half ATR above the event bar |
| WRN | price fell half an ATR, or sat below the event bar when the window closed |
| CAP | price fell one ATR below the event bar |
| BDN | price fell one ATR below the event bar |
WRN is the only one with partial credit. A drop of half an ATR scores full marks, and merely stalling below the event bar when the window closes scores three quarters. Every other event is a plain hit or miss.
Each result folds into a running figure for that event type, weighted three quarters old and one quarter new, so the last four or so events dominate. Every type starts at 0.5, the neutral value, and nothing changes until three events of that type have been evaluated. After that, two things do.
- The quality score of that event type moves by up to fifteen points in either direction.
- The effective Min Quality Score for that type shifts by up to about ten points, downward when the type has been running accurate and upward when it has not.
The Confidence row in the info panel shows the two combined, sixty percent quality against forty percent tracked accuracy. Until three evaluations exist the confidence figure is the quality score on its own and the row reads "learning".
All three mechanisms run left to right across the chart on confirmed bars only. Change the timeframe or the symbol and every measurement restarts from that chart's own history.
🔔 Alert Configuration Beginner Friendly
Pentarch declares 16 alerts. The five cycle events are sent through Pine's dynamic alert, so each one carries a full readout rather than a fixed string. The other eleven are ordinary alert conditions you pick from TradingView's list, and three of those eleven report a suppressed event rather than a fired one.
The five cycle events
| Alert | Fires when |
|---|---|
| Alert: Touchdown (TD) | A TD survives the ladder and the quality gate, at bar close |
| Alert: Ignition (IGN) | An IGN survives the ladder and the quality gate, at bar close |
| Alert: Warning (WRN) | A WRN survives the ladder and the quality gate, at bar close |
| Alert: Climax (CAP) | A CAP survives the ladder and the quality gate, at bar close |
| Alert: Breakdown (BDN) | A BDN survives the ladder and the quality gate, at bar close |
Each has its own checkbox in the Alerts settings group, all five on by default. The message is not a one-liner. It opens with the event name, the symbol and the price, then gives the quality label with its stars, a short list of what did and did not support the reading, and a details block with the stochastic, the distance from the Pilot Line in ATR, the volume ratio and the body size. The label reads STRONG from 70, GOOD from 55, MODERATE from 40 and WEAK below that, on a score out of 100. The stars run one to five off the same score: five from 85, four from 70, three from 55, two from 40 and one below that. Label and stars part company in one place only, at the top, where STRONG covers both four stars and five.
The eleven condition alerts
| Alert | Fires when |
|---|---|
| NanoFlow Bullish | A bullish NanoFlow cross prints under the bar |
| NanoFlow Bearish | A bearish NanoFlow cross prints above the bar |
| Momentum Thrust Bullish | Price clears the recent range upward with widening ATR |
| Momentum Thrust Bearish | Price breaks the recent range downward with widening ATR |
| Pilot Line Cross Bullish | Close crosses above the Pilot Line |
| Pilot Line Cross Bearish | Close crosses below the Pilot Line |
| Regime Flip to Bull | The regime turns bullish |
| Regime Flip to Bear | The regime turns bearish |
| TD SUPPRESSED | A TD qualified on this bar and the ladder drew something else |
| IGN SUPPRESSED | An IGN qualified on this bar and the ladder drew something else |
| BOTTOM PHASE SUPPRESSED | Either of the two above, on one condition |
What the ladder hides. At most one of the five events is drawn per bar, ranked CAP, then WRN, then BDN, then IGN, then TD. TD is last, so a touchdown that qualifies on the same bar as a climax or a warning is never drawn. Two hollow circles below the bar mark a suppressed TD and a suppressed IGN, and three alert conditions report them: one for each, plus a third that fires on either. So the absence of a TD label is reported rather than merely inferred.
🔗 Integration with Other Indicators
While Pentarch provides powerful cycle phase detection on its own, combining it with other Signal Pilot indicators creates confluence analysis. Here are common integration workflows:
Pentarch + Janus Atlas (Levels Confluence)
Workflow:
- TD or IGN event appears → Check if price is near a key Janus Atlas level (Daily Low, Weekly High, POC, VWAP, etc.)
- Level confluence = stronger context → Event at key support/resistance level provides additional confluence
- Expected outcome: Reversal events that align with structural levels have more confluence
Example: TD event fires while price touches Janus Atlas Daily Low = support confluence detected
Pentarch + Volume Oracle (Regime Confirmation)
Workflow:
- TD or IGN event appears → Check Volume Oracle regime for volume confirmation
- Regime alignment → Bullish Pentarch event + Accumulation regime (green) = volume flow confirms cycle phase
- Expected outcome: Pentarch events aligned with Volume Oracle regime have confluence
Example: IGN event fires while Volume Oracle shows Accumulation regime (green, 75%) = markup phase confluence detected
Pentarch + OmniDeck (Multi-System Validation)
Workflow:
- IGN event appears → Check OmniDeck Regime Box for trend context
- OmniDeck shows bullish regime → IGN event aligned with broader trend = confluence detected
- OmniDeck shows conflicting regime → Trend context conflict noted
Example: IGN reversal event with OmniDeck showing bullish regime box = trend-aligned confluence
Pentarch + Harmonic Oscillator (Momentum Confirmation)
Workflow:
- TD or IGN event appears → Check if Harmonic Oscillator prints TRENDING▲ or BIAS▲
- Momentum alignment → Pentarch reversal event + momentum shift = confluence detected
- Expected outcome: Event + momentum agreement provides additional context
Example: IGN event fires while Harmonic Oscillator transitions from Bear to Bull = momentum confluence detected
Pro Tip: The Trinity Workflow
For maximum confluence, combine Pentarch (timing) + Janus Atlas (levels) + Volume Oracle (regime confirmation). Look for IGN/CAP events that occur at key levels with aligned regime (Accumulation for bullish events, Distribution for bearish events). This triple-confluence approach identifies the strongest confluence zones.
See also: Complete Analysis Workflow Guide for detailed multi-indicator strategies.
⚠️ Common Mistakes to Avoid
These mistakes are frequently made by new Pentarch users. Avoid them to improve your results:
Mistake #1: Ignoring Market Context
The Problem: Not all events have equal context. TD/IGN events in choppy, ranging markets have less confluence. Analyzing events without considering market context reduces analysis quality.
The Fix:
- Confirm trend context first (use OmniDeck Regime Box or Pilot Line direction)
- Higher timeframe events (4H, Daily) generally have cleaner context than 5-minute events
- Look for confluence with other indicators (Janus Atlas levels, Volume Oracle regime)
- Events during low-volume, narrow-range conditions have less context
Remember: An event with a level and a volume reading behind it is a different reading from the same event alone. The difference is on screen.
Mistake #2: Ignoring Event Sequence Position
The Problem: BDN event without prior CAP/WRN events = late-cycle event. Early-cycle events (TD → IGN) have different context than late-cycle events (BDN after extended move).
The Fix:
- Note TD and IGN events (early-cycle indicators)
- Standalone BDN events indicate late-cycle conditions
- Complete sequences (TD → IGN → WRN → CAP → BDN) are rare but significant
- Partial sequences (TD → IGN) are more common
Remember: Early events (TD/IGN) indicate different cycle phase than late events (BDN).
Mistake #3: Using Excessively Low Timeframes
The Problem: 1-minute and 5-minute charts produce many events, but noise increases and context clarity decreases.
The Fix:
- Start with 15-minute or 1-hour timeframes to learn event behavior
- 4-hour and Daily timeframes provide clearest event context
- Lower timeframes have more noise and less clarity
- Higher timeframe context helps filter lower timeframe events
Remember: Higher timeframes = cleaner events, lower noise, clearer context.
Mistake #4: Ignoring Risk Context
The Problem: Not all Pentarch events result in immediate reversals. Events indicate phase conditions, not guaranteed outcomes.
The Fix:
- Janus Atlas levels provide structural reference points
- IGN events: Note nearby support levels for context
- CAP events: Note nearby resistance levels for context
- Risk management is essential for any analysis methodology
Remember: Events provide phase identification. Risk management is separate from event detection.
Mistake #5: Treating All Five Events as Identical
The Problem: TD and WRN are "warning" events (early/late cycle warnings), while IGN and CAP are "confirmation" events (phase transitions). Each event serves a different purpose.
Understanding each event:
- TD (Touchdown): Early cycle warning - accumulation phase detected
- IGN (Ignition): Momentum confirmation - markup phase detected
- WRN (Warning): Late cycle warning - distribution warning detected
- CAP (Climax): Exhaustion event: climax phase detected
- BDN (Breakdown): Breakdown event: decline phase detected
Note: TD and WRN are early/late cycle warnings. IGN, CAP, and BDN indicate phase transitions.
Mistake #6: No Level Context
The Problem: Analyzing events without knowing nearby structural levels provides incomplete context.
The Fix:
- Identify nearby support and resistance from the levels in Janus Atlas
- Watch for opposite-direction events (IGN → then watch for WRN or CAP)
- Note cycle progression through event sequence
- Use Pilot Line and swing levels as structural references
Remember: Pentarch identifies cycle phases. Level context provides structural framework.
Additional Resources
For more best practices, see Best Practices & Pro Tips. For risk management guidance, see Analysis Workflow Guide.
🌫️ When This Doesn't Work Well
Pentarch events show reduced context clarity in certain market conditions. Recognizing these environments helps set appropriate expectations:
Choppy, Sideways Markets
The Condition: When price moves sideways in a tight range with no clear directional bias, events fire more frequently but context clarity diminishes. Gray (neutral) regime bars often cluster during these periods.
What Happens: TD/IGN events may fire multiple times in alternating directions without sustained moves. Event-to-noise ratio decreases.
Context: This isn't a flaw: it reflects actual market behavior. Sideways consolidation produces ambiguous momentum patterns that generate valid but lower-context events.
Extremely Low Volume Periods
The Condition: During holidays, overnight sessions, or illiquid trading hours, volume drops significantly below average levels.
What Happens: Price moves lack significant volume participation. Events may fire on small moves that quickly reverse. Context becomes less clear.
Context: Pentarch detects momentum shifts, but low volume means those shifts lack the "fuel" (buying/selling pressure) to sustain moves. Combine with Volume Oracle to identify these conditions.
Major News Events & Earnings Releases
The Condition: During Federal Reserve announcements, earnings reports, or major geopolitical events, price action becomes driven by news rather than technical patterns.
What Happens: Events may fire immediately before/after news, but price can gap or reverse violently regardless of event. Technical patterns temporarily lose relevance as fundamental news dominates.
Context: Pentarch analyzes price and momentum: it doesn't "know" about external catalysts. Events remain technically valid but compete with stronger fundamental forces during these windows.
Very Low Timeframes (1-Minute, 5-Minute)
The Condition: On 1m and 5m charts, market microstructure noise (bid-ask spreads, algos, spoofing) becomes significant relative to price moves.
What Happens: Event frequency increases dramatically, but many events represent noise rather than meaningful momentum shifts.
Context: Pentarch works on all timeframes, but very low timeframes amplify noise faster than they amplify event quality. Higher timeframes (15m+, 1H, 4H, Daily) filter out microstructure noise and improve event-to-noise ratio.
Extended Trends Without Clear Exhaustion Signals
The Condition: During strong trending markets (especially parabolic moves), counter-trend signals may fire but price continues trending without reversal.
What Happens: CAP or TD events appear indicating reversal conditions, but momentum remains so strong that price only pauses briefly before continuing the original trend. Counter-trend events may occur during persistent momentum.
Context: Markets can remain overbought or oversold longer than technical indicators suggest. Pentarch detects exhaustion patterns, but extraordinary trends (driven by strong narratives or momentum cascades) can persist beyond typical cycle lengths. Confirm with OmniDeck regime strength and Volume Oracle exhaustion patterns.
Recognizing Reduced Reliability Environments
Practical Identification:
- Gray regime bars clustering: Signal of choppy conditions: wait for regime clarity
- Volume bars consistently below average: confirm low participation with Volume Oracle
- Calendar awareness: Check economic calendars for major scheduled events
- Event frequency spiking: If you see 5+ events in rapid succession alternating directions, you're likely in chop
- Timeframe comparison: If 5m shows events but 1H doesn't, the lower timeframe is likely noise
Remember: Pentarch doesn't "fail" in these conditions: it accurately reflects that the market itself is ambiguous or driven by non-technical factors. Recognising the conditions the detection is not built for is part of reading it.
❓ Frequently Asked Questions
Q: When do events appear?
A: Events appear when all four detection layers confirm simultaneously at bar close. No mid-bar events occur.
Q: Can events repaint?
A: No. All events confirm at bar close and do not change retroactively.
Q: How many events appear on average?
A: Event frequency varies by asset, timeframe, and market conditions. Some periods show frequent events, others show sparse events.
Q: Do all five events always appear?
A: No. Partial cycles occur more often than complete cycles. Complete five-event cycles appear less often than partial sequences.
Q: What timeframes work?
A: All timeframes supported. Event characteristics may vary across different timeframe selections.
Q: Can multiple events appear on same bar?
A: No. Only one event type appears per bar close.
Q: What if I miss an event?
A: Events remain on chart after appearance. Historical events visible on past bars.
Q: How do I customize colors?
A: Open indicator settings and go to the colour section. There is one colour field per event, so each of the five can be set independently.
Q: Does Pentarch work on futures/forex/crypto?
A: Yes. Compatible with all asset types available on TradingView.
Q: Can I use Pentarch with other indicators?
A: Yes. Pentarch can be combined with other analysis tools. Compatibility with entire Signal Pilot suite available.
📋 Quick Reference Guide
Event Quick Reference
| Event | Position | Default Color | Phase | Key Characteristics |
|---|---|---|---|---|
| TD | Below candle | Purple | Accumulation | Oversold, below Pilot Line |
| IGN | Below candle | Blue | Markup | Momentum breakout, structure shift |
| WRN | Above candle | Salmon | Distribution | Extended, momentum weakening |
| CAP | Above candle | Red | Climax | Extreme extension, exhaustion |
| BDN | Above candle | Pink | Decline | Structure break, bearish shift |
Note: These are the default colours. Each one can be changed in indicator settings.
Component Quick Reference
| Component | Location | Function |
|---|---|---|
| Event Labels | On chart | Show cycle phase detection |
| Pilot Line | On chart | Dynamic trend reference |
| Regime Colors | Candle bodies | Structure visualization |
| NanoFlow | On the candles | Micro-trend crosses |
Common Signal Sequences
Early Cycle:  TD → IGN
Full Cycle:   TD → IGN → WRN → CAP → BDN
Late Cycle:   WRN → CAP → BDN
Reversal:     BDN → TD → IGN
📞 Support
Technical Questions: support@signalpilot.io
Deepen your understanding with these articles from the Signal Pilot Blog:
Master market timing using Pentarch's five-cycle detection system
Why Markets Move in CyclesUnderstand the rhythmic patterns driving price action
Cycles Within CyclesDiscover how multiple timeframe cycles interact and confirm
💬 Need Help?
Have questions about Pentarch? Join our Discord community to get help from experienced users, share setups, and discuss approaches!
See Also
Related Pages:
- Janus Atlas v1.0 - Combine cycle timing with key structural levels
- OmniDeck v1.0 - Ten systems on one chart, read alongside Pentarch rather than in place of it
- Pentarch Quick Reference - One-page signal cheatsheet
- How to Set Up Alerts - Get the event when it becomes readable
- Analysis Workflow - How Pentarch fits into complete analysis system
Disclaimer: This indicator provides cycle phase detection based on technical analysis methodology. All signals represent historical condition detection. Individual interpretation, application, and outcomes vary. Past signal patterns do not guarantee future results. This is not financial advice.