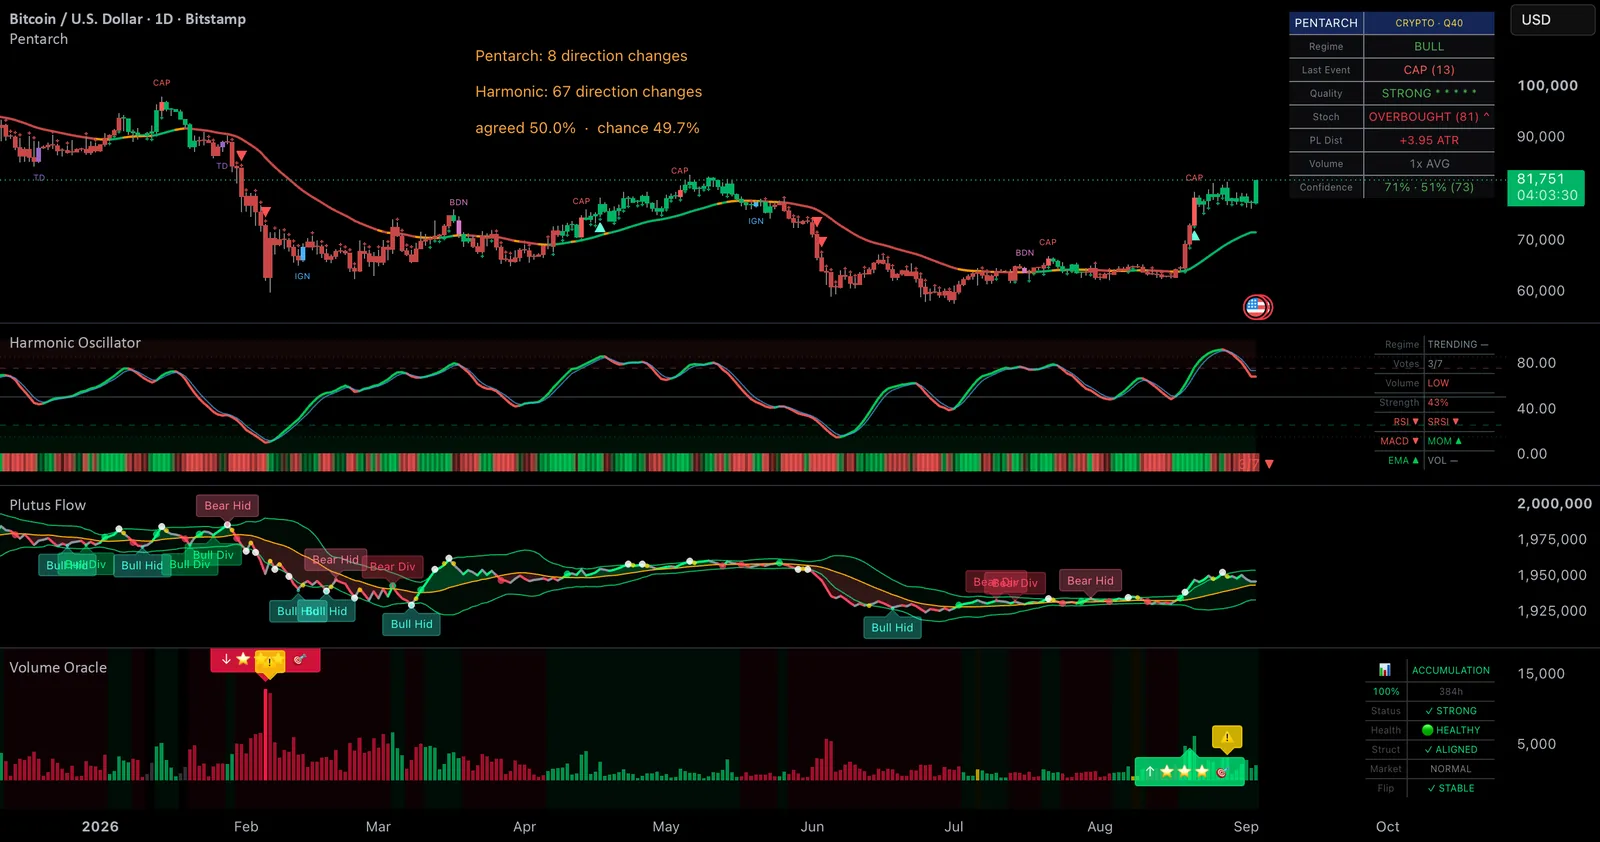
Published as a TradingView Idea on BTCUSD. View the chart on TradingView
Most people stack indicators until the screen is full, then treat it as confirmation when they all point the same way.
Sometimes that is five opinions agreeing. Sometimes it is one opinion in five costumes, and you have talked yourself into a position using a single piece of evidence you counted five times.
There is a way to tell which, and it takes about twenty minutes with a spreadsheet.
Why "they agree a lot" proves nothing
In a trending market almost everything agrees, because there is a trend. That is the market talking, not your indicators corroborating each other.
So raw agreement is useless on its own. What you need is agreement measured against how often they would have agreed by chance.
The three numbers
Reduce each indicator to one thing per bar: bullish or bearish. One field per indicator, chosen once, used everywhere. This matters more than it looks and we will come back to it.
Observed agreement. The percentage of bars where two indicators pointed the same way.
Chance agreement. If A is bullish 36% of the time and B is bullish 50%, then with no relationship at all they would both be bullish on roughly 18% of bars and both bearish on 32%, agreeing about 50% of the time by luck.
The gap. Observed minus chance, scaled so 0 means no better than luck and 1 means identical. That is Cohen's kappa. It is decades old and any spreadsheet can compute it.
Worked through on BTCUSD
Five instruments, daily, 300 bars from November 2025 to September 2026. One directional field each, fixed before looking at any result. Those five publish 168 named outputs between them, so which field you choose is a real decision, not a formality.
| pair | agree | chance | kappa | 95% interval |
|---|---|---|---|---|
| Pentarch / OmniDeck | 86.3% | 53.5% | 0.705 | +0.42 to +0.87 |
| Plutus Flow / Volume Oracle | 83.6% | 50.3% | 0.670 | +0.47 to +0.81 |
| Volume Oracle / OmniDeck | 78.8% | 53.4% | 0.546 | +0.25 to +0.72 |
| Pentarch / Volume Oracle | 75.9% | 52.0% | 0.498 | +0.20 to +0.68 |
| Plutus Flow / OmniDeck | 74.7% | 52.1% | 0.471 | +0.21 to +0.63 |
| Pentarch / Plutus Flow | 67.6% | 49.7% | 0.356 | +0.03 to +0.61 |
| Harmonic / Volume Oracle | 65.9% | 49.9% | 0.319 | +0.22 to +0.46 |
| Harmonic / Plutus Flow | 63.4% | 50.0% | 0.269 | +0.17 to +0.39 |
| Harmonic / OmniDeck | 54.1% | 49.9% | 0.084 | −0.03 to +0.21 |
| Pentarch / Harmonic | 50.0% | 49.7% | 0.005 | −0.12 to +0.16 |
Pentarch and Harmonic Oscillator agreed on exactly the share of bars that chance predicts. The interval straddles zero and never leaves plus or minus 0.17. Those two are carrying genuinely separate information.
At the other end, Pentarch and OmniDeck agreed on 86% of bars where chance predicted 54%. On this symbol, in this window, OmniDeck told us least that Pentarch had not already said. Plutus Flow and Volume Oracle came out similar.
One pair beautifully independent, two pairs overlapping enough to question. If we only published the first row we would be doing precisely what this article argues against.
Why the independent pair is independent
Count how often each instrument changed its mind across the 300 bars.
| instrument | direction changes |
|---|---|
| Harmonic Oscillator | 67 |
| Plutus Flow | 27 |
| Volume Oracle | 24 |
| OmniDeck | 9 |
| Pentarch | 8 |
Harmonic changed direction 67 times. Pentarch changed 8.
One is a slow regime call, the other a fast momentum vote. They are independent because they operate on different clocks, and that is the thing worth looking for when you choose what goes on a chart. Not more indicators. Indicators running at different frequencies.
Two tools that both answer "is the trend up" will overlap no matter how differently they are drawn.
The trap, which nearly got us
Which single field you pick to represent "bullish or bearish" changes the answer completely, and it is very easy to pick the flattering one without realising.
While preparing this, the same lead-lag question was measured three times using different but equally defensible fields, and produced three different answers. Vote counts said one thing. Crossover alerts said another. A regime flag said a third.
Pick one field per indicator. Write down which one. Use it everywhere. If you change it, redo the entire table.
The sample is smaller than it looks
300 bars is not 300 independent observations. Pentarch only changed its mind 8 times, so most of those rows are the same call repeated.
Every interval above comes from a block bootstrap, resampling in 20 bar blocks to respect that. It is why the independent pair holds up at minus 0.12 to plus 0.16, and why Pentarch against Plutus Flow, at 0.356 with an interval from +0.03 to +0.61, is barely a finding at all.
That second interval is the honest output. A single number without one would have looked far more convincing and told you considerably less.
What to do with the answer
Run it on your own chart. Reduce each indicator to one directional field, count agreement, compare against chance.
Any pair up near 0.8, you are carrying two of something. Keep the one you understand better and take the other off the screen, because the second is not confirming, it is echoing.
Any pair near 0, keep both. Those are doing work.
And one thing this does not measure: kappa tells you whether two indicators say different things. It says nothing about whether either is right. Two perfectly independent indicators can both be wrong at the same time, all week.
Published as a TradingView Idea on BTCUSD. View the chart on TradingView
Past chart behaviour and measurement, described after the fact. Nothing here is a recommendation or an indication of future results.