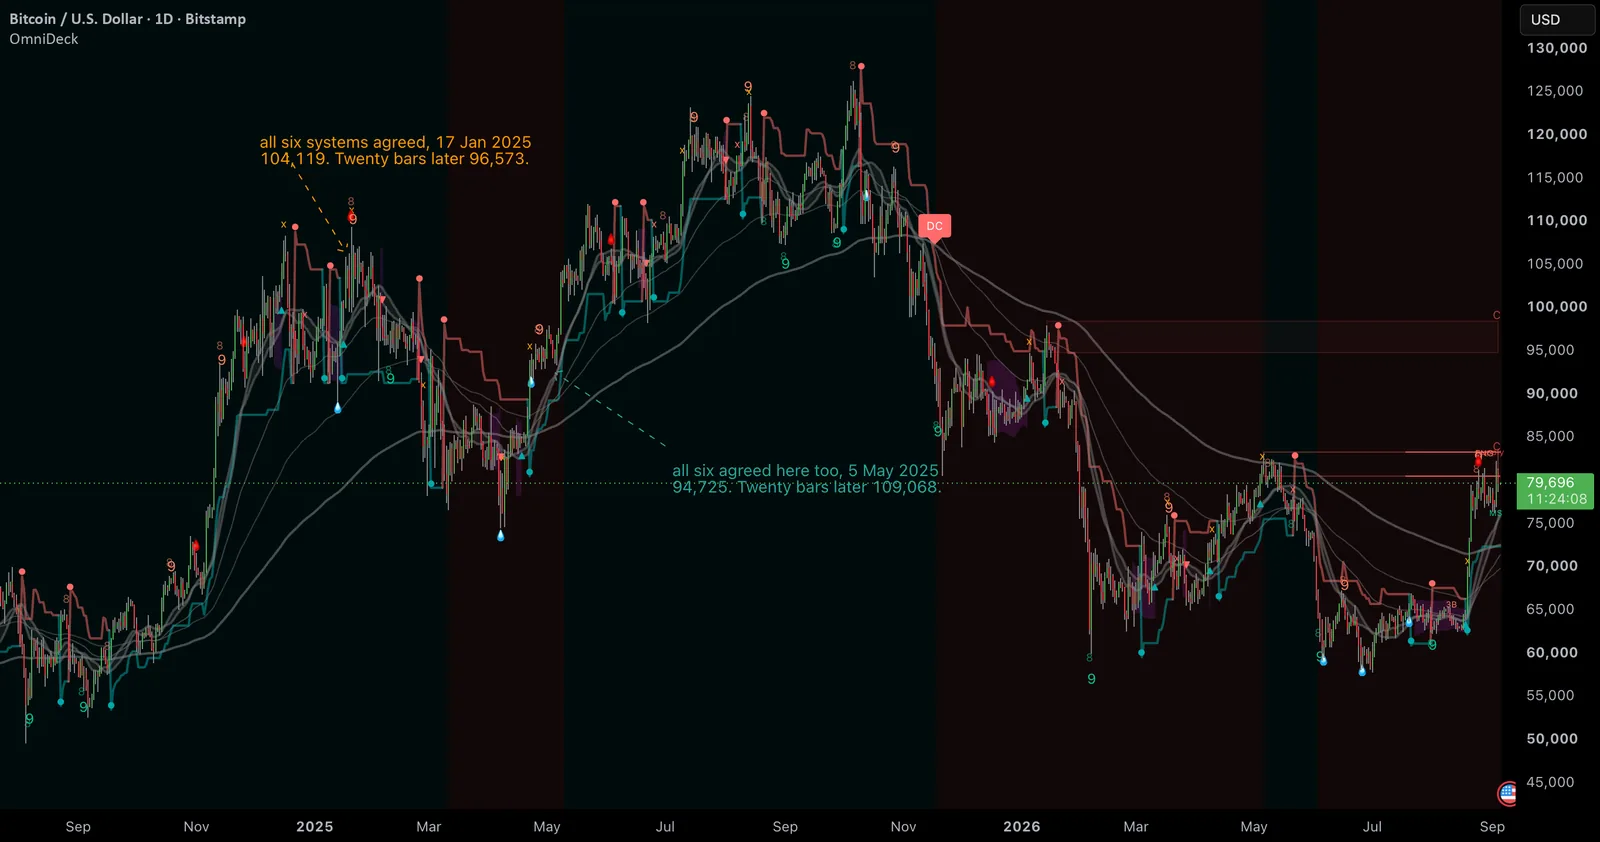
Published as a TradingView Idea on BTCUSD. View the chart on TradingView
Open any trading chart belonging to someone who has been at it a while and you will find several indicators stacked on top of each other. The reasoning is intuitive. One tool might be wrong. Four tools agreeing are harder to argue with.
That reasoning has never sat comfortably, and it turns out to be testable.
What "confirmation" actually means
Reduce each tool to one thing per bar: is it bullish or bearish. Now on any given day you can count how many of them agree.
Some days they all point the same way. Some days they are split. The belief being tested is that the days where they all agree are better days, in the sense that price subsequently does more of what they were pointing at.
Why the obvious test fails
You might compare the all-agree days against ordinary days and see which produced bigger moves.
That comparison is broken, and it flatters the indicators badly.
Indicators agree during trends. That is not a coincidence, it is arithmetic: they are all reading the same price, and during a sustained move there is only one thing to say about it. So the days when everything agrees are disproportionately trending days, and trending days have bigger forward moves regardless of what your chart says.
Compare all-agree days to ordinary days and you have measured the trend. You have learned nothing about your indicators.
The fix, which is the whole article
Shuffle them.
Take each indicator's sequence of bullish and bearish readings and shuffle it in blocks, so it keeps its own character. Something bullish 60% of the time stays bullish 60% of the time. Something that stays put for weeks still stays put for weeks.
What the shuffle destroys is the relationship between them. They still agree sometimes. That agreement is now meaningless by construction.
Then run the identical measurement on the shuffled version. Whatever your real indicators score above the shuffled ones is what your stacking is actually worth.
What we found
We ran it on our own OmniDeck, using six of its systems, on 22 instruments across futures, indices, stocks, crypto, currencies and commodities. About 25,900 daily bars.
| correlation between agreement and the next 20 bars | |
|---|---|
| our real indicators | −0.002 |
| the same indicators, shuffled | +0.052 |
The shuffled version did better.
Instrument by instrument, the real version beat its own shuffled control on 6 of 22. Pure chance would give about 11. Six is roughly two standard deviations the wrong side of luck.
How often does everything actually agree
Less often than the word confluence implies, and less independently.
Of our 22 instruments, 14 never had all six systems agree on a single day, across roughly 1,200 days each. Not the S&P futures, not the Nasdaq futures, not Apple, Microsoft, Nvidia or Tesla.
And where it did happen, it came in runs. META produced 17 such days, which sounds like 17 separate occasions until you notice they were consecutive, a single episode from 10 June to 3 July 2024. Bitcoin's 10 days were two episodes, January and May 2025.
That matters for anyone counting signals. A bar count is not an event count, and treating one as the other will make any rare condition look far more frequent, and far better tested, than it is.
The mistake we made first, because it is the one you will make
We ran this initially on eight instruments and got a clear positive result. More agreement, better outcomes, exactly as expected. We were fairly pleased.
It was wrong. Adding fourteen more instruments reversed it completely.
The reason is worth internalising. We had roughly 9,000 bars, which sounds like plenty, but consecutive daily bars are not independent observations. Today's readings are mostly yesterday's readings. The real number of independent data points was perhaps a few dozen per instrument, and at that size you can find almost anything.
The measurement that survived was not a bigger correlation. It was counting how many separate markets pointed the same way, because separate markets genuinely are separate observations.
Counting the same thing twice
One more result, and it is the practical one.
OmniDeck publishes both a SuperTrend line and SuperTrend event flags. It publishes both an EMA stack and the golden and death crosses that stack produces. Those pairs are the same system described twice.
We ran the test again with the duplicates added back in. Eight votes instead of six, and the score got worse.
That is the part to take to your own chart. Two moving average tools are one tool. An oscillator and its crossover alert are one tool. When they agree that is not confirmation, it is an echo, and adding it does not just fail to help, it dilutes the components that were carrying information.
What we are not saying
The numbers are small. Correlations around 0.05 are weak relationships and we are not claiming a large effect. The claim is about direction and consistency, not size.
It is daily bars, one indicator's components, and one way of turning each system into a vote. The TradingView Idea this post accompanies shows how changing those definitions moves the numbers.
And this measures a statistical relationship between agreement and subsequent price movement. It is not advice, and there is nothing here to act on.
Why we published it
Because we sell a tool that scores confluence, and this is a test of whether confluence scores anything. It came back negative on our own product.
The method is the part worth taking. Reduce your tools to one vote each, count the agreement, then shuffle them and count it again. It takes an afternoon, it works on anything, and the answer belongs to you rather than to whoever sold you the indicator.
Published as a TradingView Idea on BTCUSD. View the chart on TradingView
Past chart behaviour and measurement, described after the fact. Nothing here is a recommendation or an indication of future results.