The problem
Ten indicators on one chart is not ten times the information. Past a point the chart stops being readable and every new tool costs you more than it adds.
The usual answer is to run fewer tools. The better answer is to have them coordinate.
What it shows
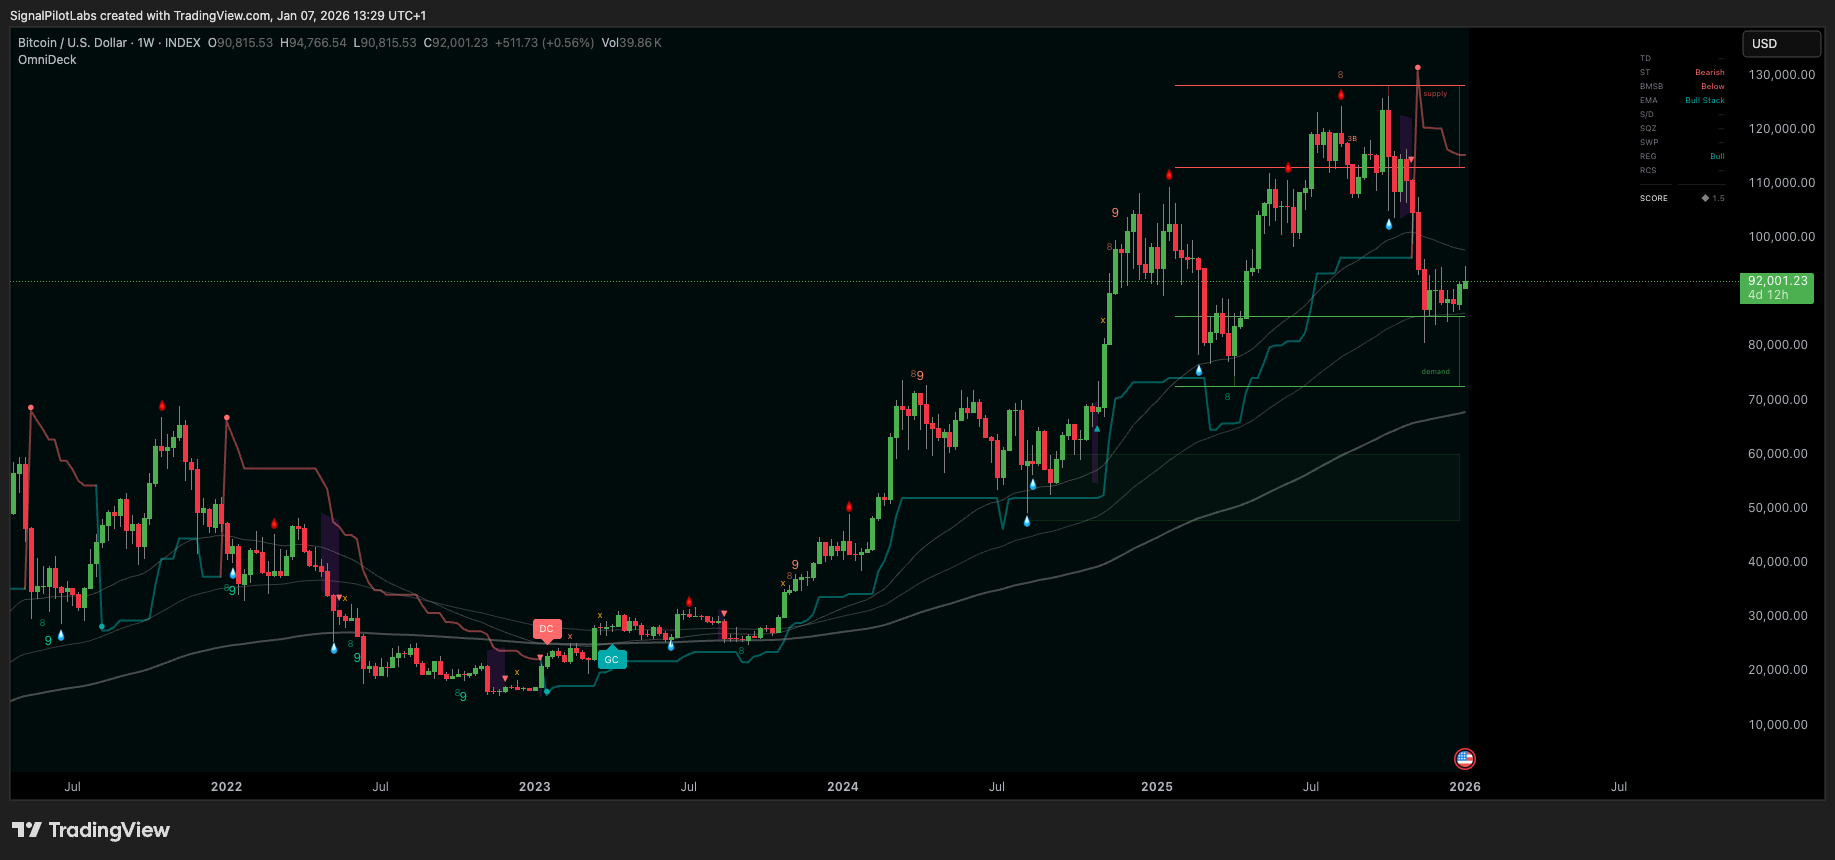
OmniDeck runs ten systems on one overlay with a shared confluence score, so they inform each other instead of competing for space.
| System | Function |
|---|---|
| Exhaustion Counter | Counts 1 to 9 to identify exhaustion into reversals |
| Squeeze Detector | Volatility breakouts, Bollinger Bands against Keltner |
| Liquidity Sweeps | Stop-hunt detection |
| EMA Trio | 50, 100, and 200 period averages |
| SuperTrend | Adaptive trend-following ribbon |
| BMSB | Bull Market Support Band, the 20 SMA with 21 EMA |
| Regime Box | Background colour reflecting the current structure |
| Supply / Demand Zones | Key levels with quality ratings, non-repainting |
| Candlestick Patterns | Sixteen recognised patterns |
| Meta Tools | The integration layer coordinating the other nine |
One score across ten systems
The confluence score is the part that matters. Ten systems agreeing and two systems agreeing look very different, and the panel makes that difference explicit.
Non-repainting, and what that means here
Every marker is confirmed at bar close and stays where it printed. What you see in history is exactly what you would have seen live, and that is the only way a backtest of your own eyes means anything.
What it isn’t
A high confluence score describes agreement between systems. It is not a probability, and OmniDeck does not present it as one.
Who it’s for
Traders whose charts have accumulated tools over the years and who want the same coverage without the clutter.
On a real chart
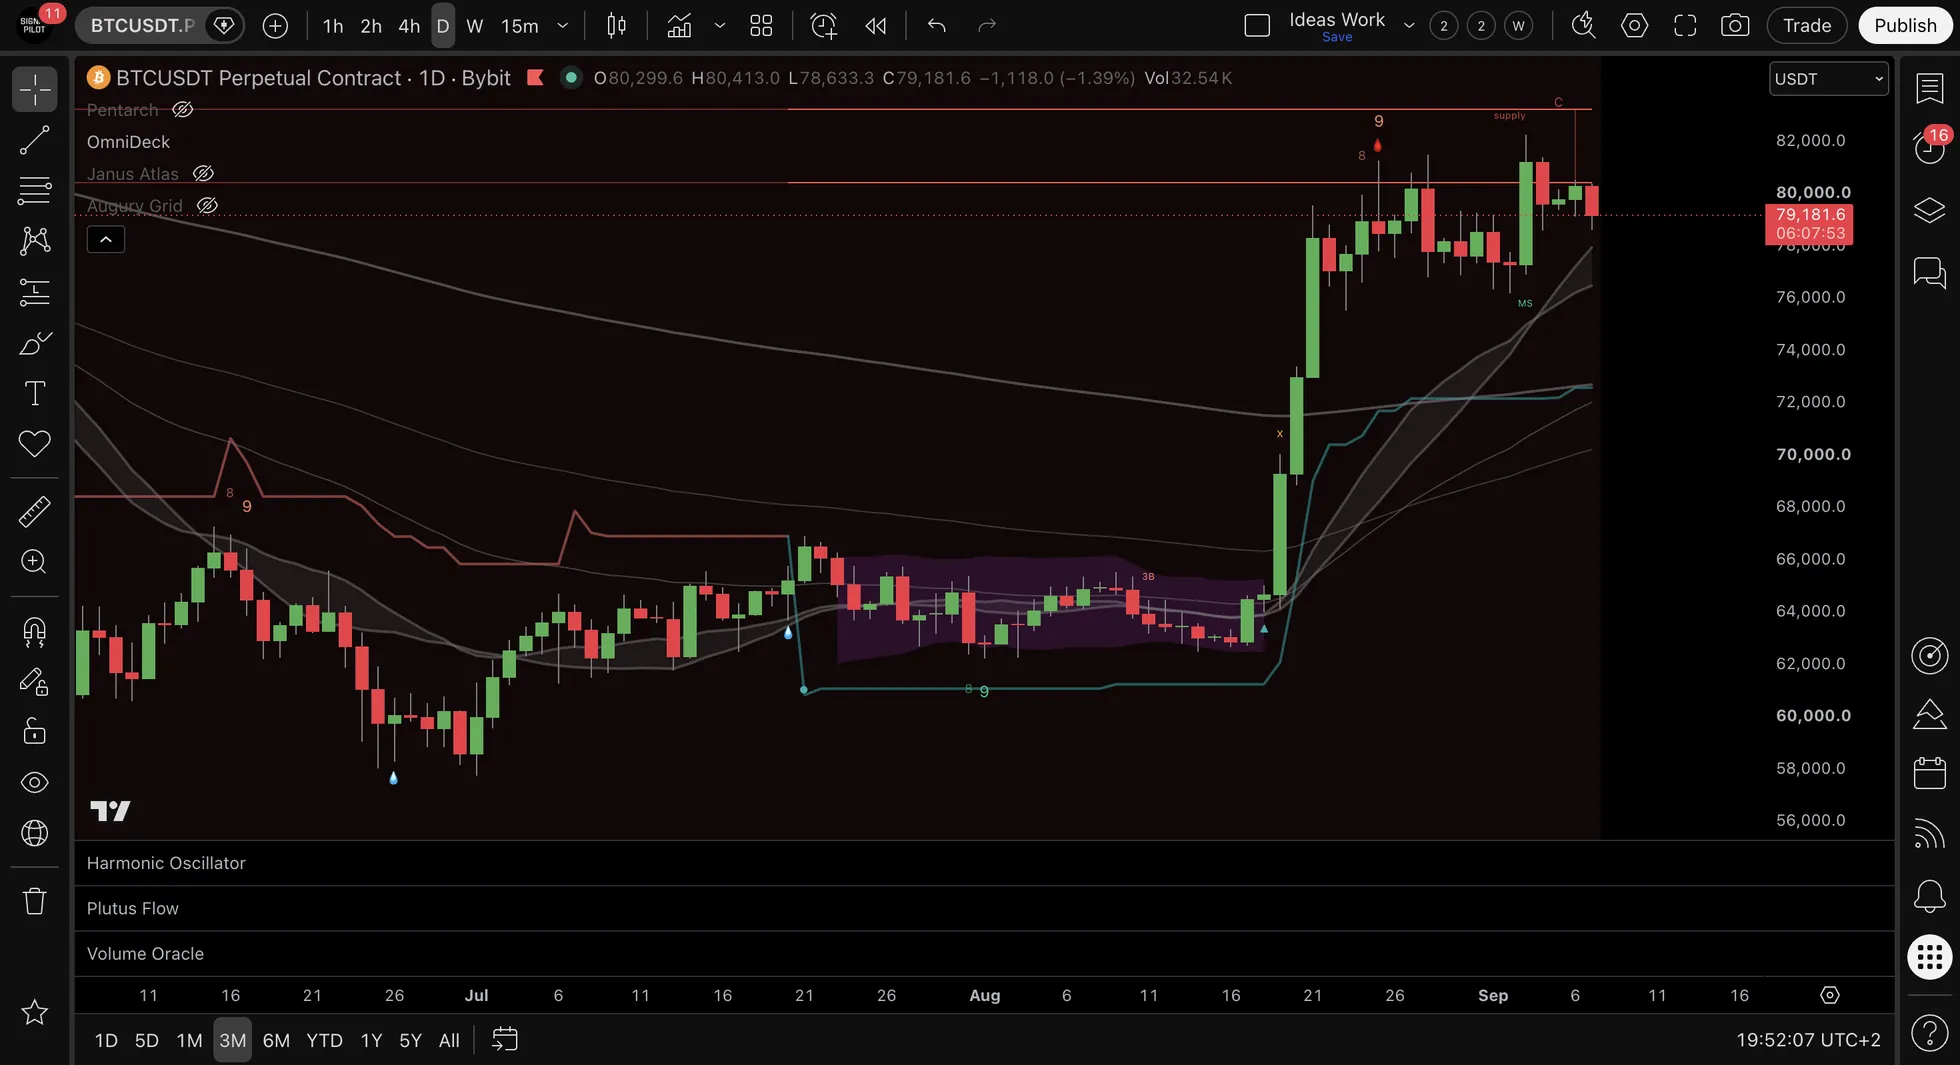
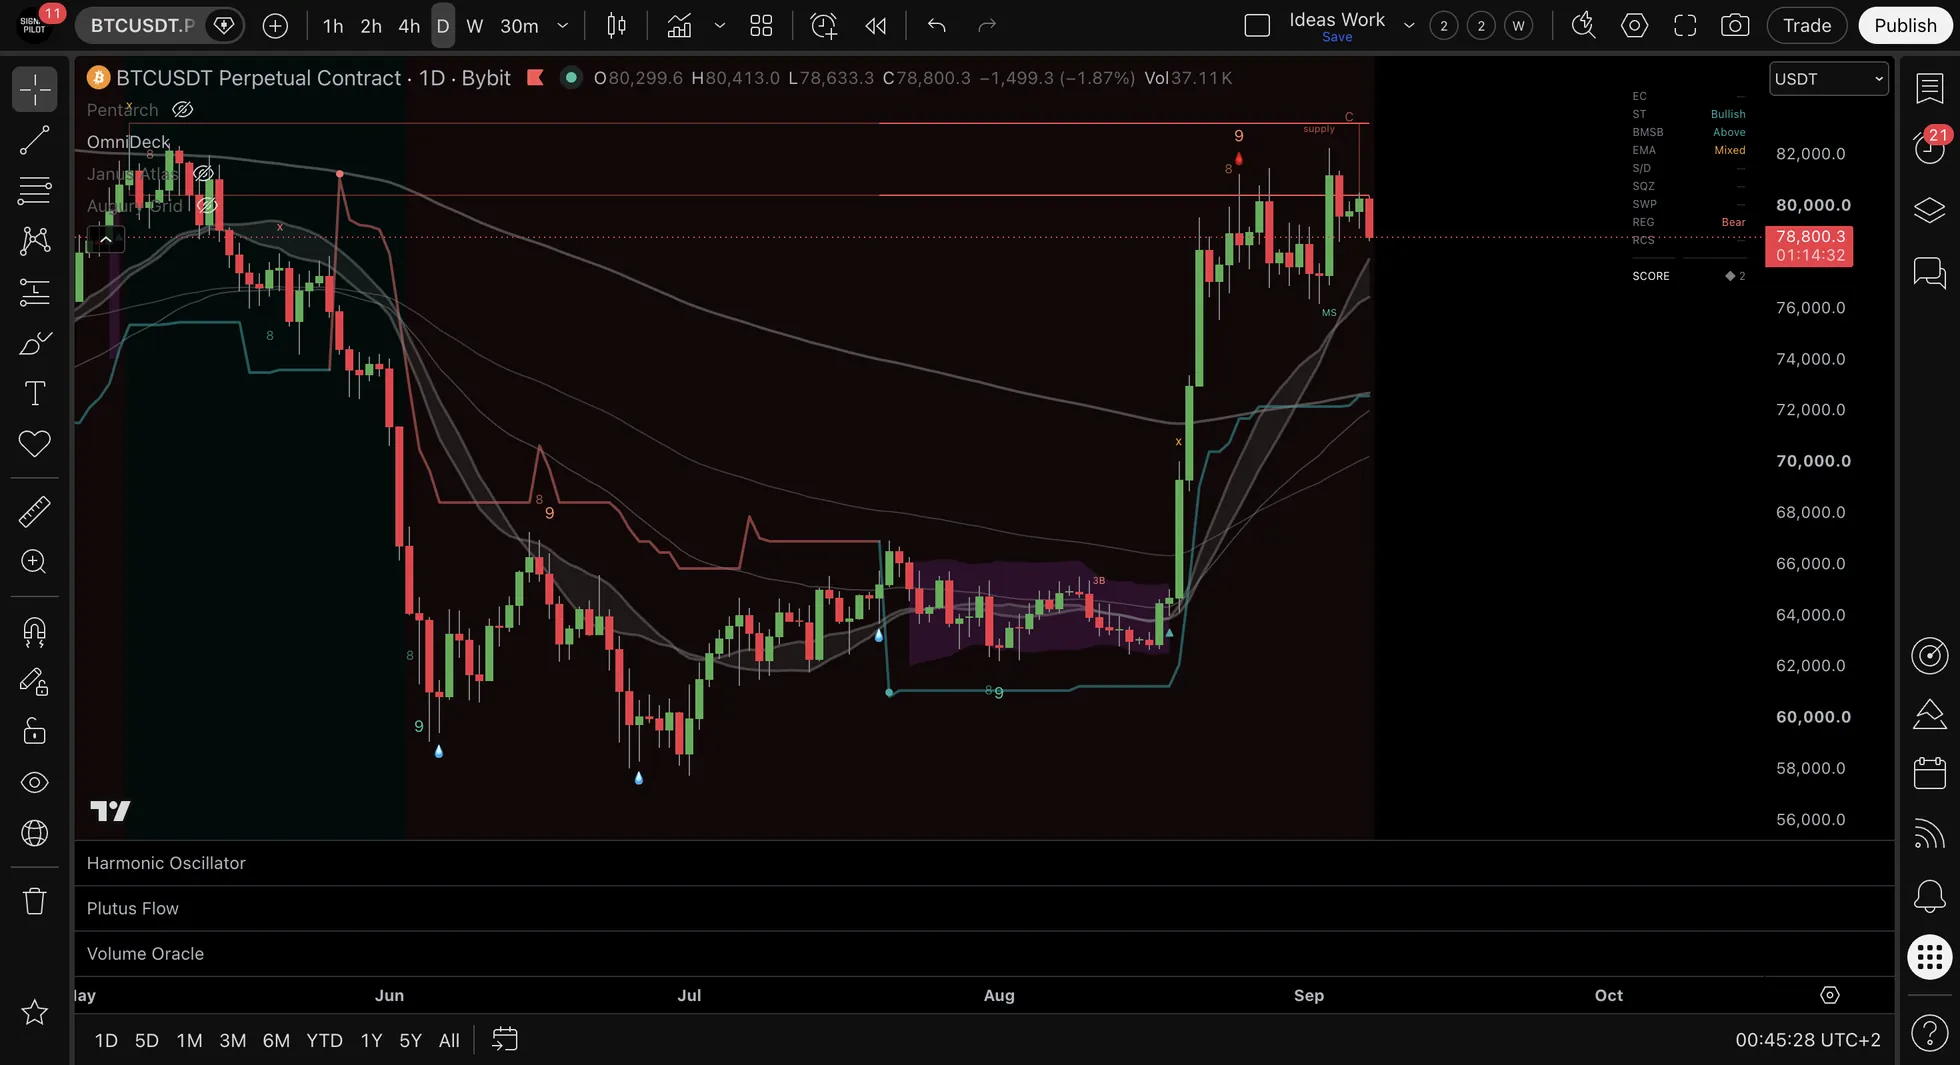
Every setting, every output and every panel is documented in the reference for this indicator.
What we tested
We publish our own measurements of this indicator, including the ones that did not go our way.
- Are half your indicators saying the same thing?
- We shuffled our own indicators and they worked slightly better
Try OmniDeck
7-day free trial, no credit card. 7-day money-back guarantee. All future updates included, plus 100 free lessons in the education hub.
Part of The Elite Seven. More on cycle structure in Insights and the Chronicle.