The problem
You can usually tell a trend is over once it is obviously over. The hard part is the middle: the stretch where a pullback and a top look identical, and the difference only becomes clear two weeks later.
Most cycle tools solve this by redrawing. The marker slides onto the exact high once enough bars have closed for the answer to be obvious. The chart ends up describing a decision nobody could have made in real time.
What it shows
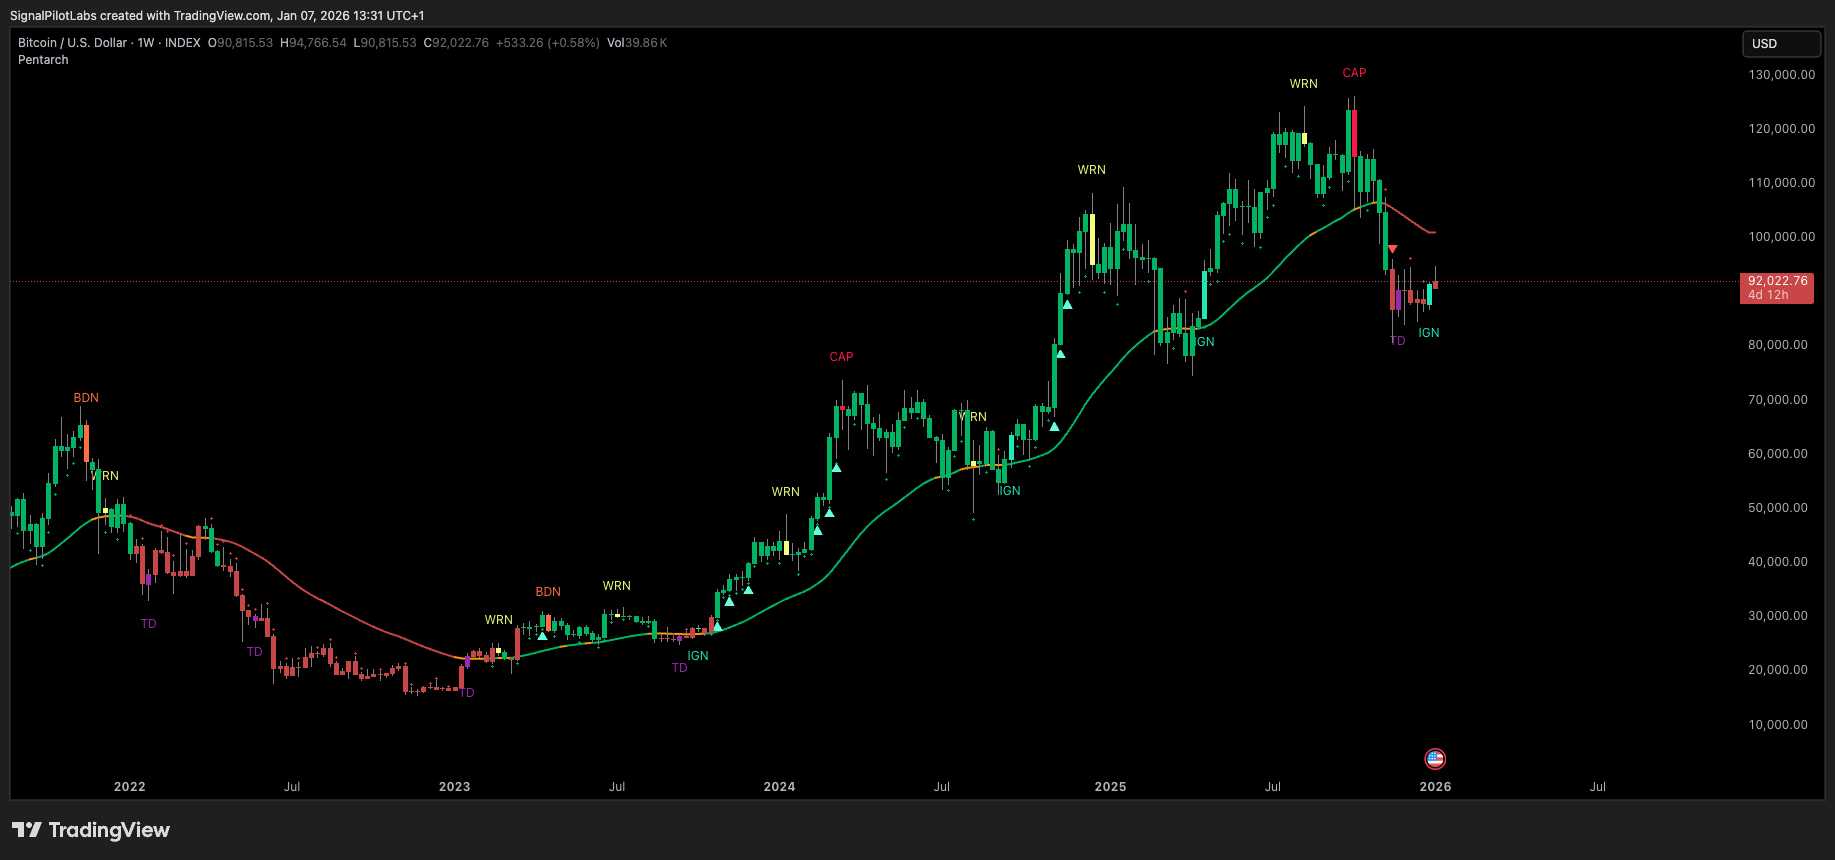
Pentarch marks five cycle events directly on the candles, each one confirmed at bar close and fixed permanently once printed.
| Event | Phase | What it marks |
|---|---|---|
| TD (Touchdown) | Accumulation | Early-cycle reversal on selling exhaustion |
| IGN (Ignition) | Markup | Breakout confirmation with conviction behind it |
| WRN (Warning) | Distribution | Early weakness appearing inside an uptrend |
| CAP (Climax) | Climax | Late-cycle exhaustion with volume spikes |
| BDN (Breakdown) | Decline | Bearish structure break |
Four layers, all of which must agree
A cycle event only prints when all four agree at the close of the bar. Fewer marks on the chart, and the ones that appear stay where they appeared.
On the chart
Non-repainting, and what that means here
Every marker is confirmed at bar close and stays where it printed. What you see in history is exactly what you would have seen live, and that is the only way a backtest of your own eyes means anything.
What it isn’t
Pentarch does not tell you where price is going. It tells you which phase of the cycle the structure is currently in. What you do with that is your decision, on your risk.
Who it’s for
Traders who keep entering late because they wait for confirmation that only arrives after the move, and want the phase change marked when it happens rather than in hindsight.
On a real chart
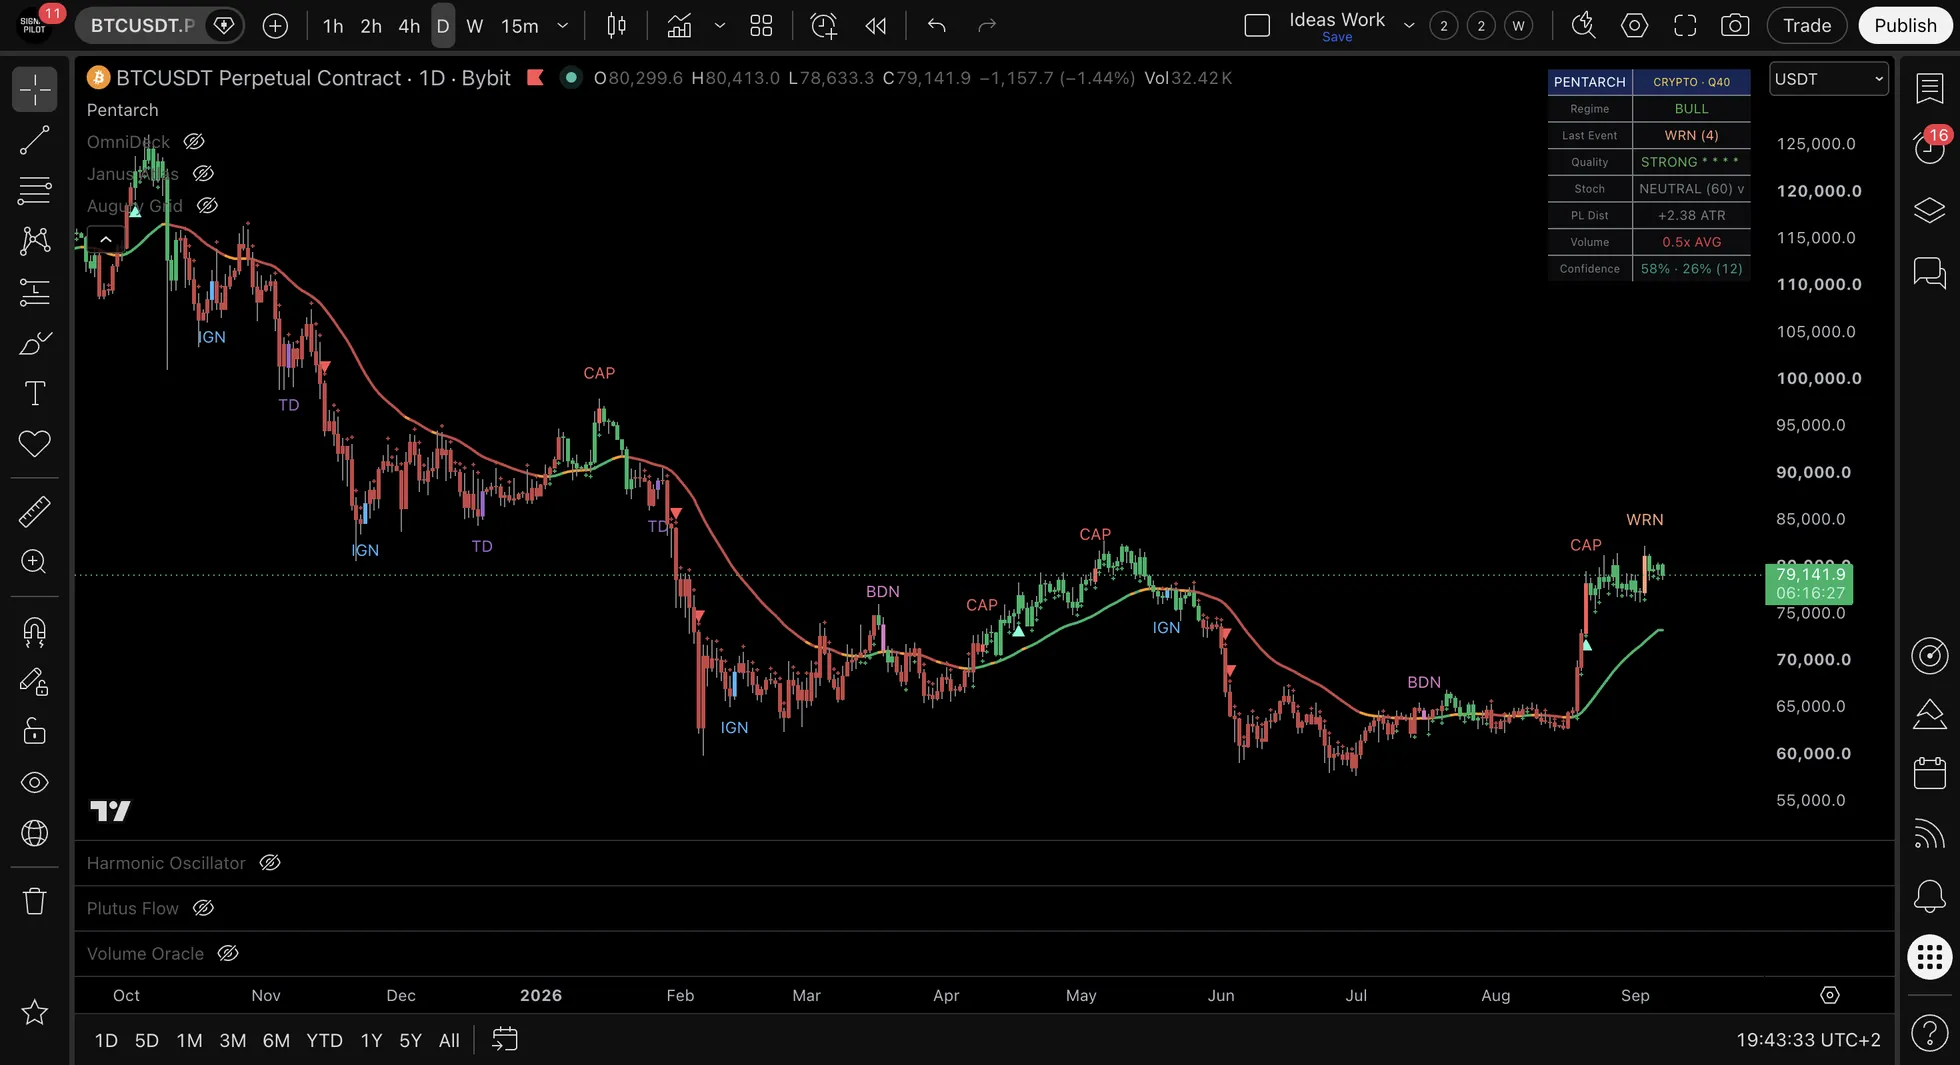
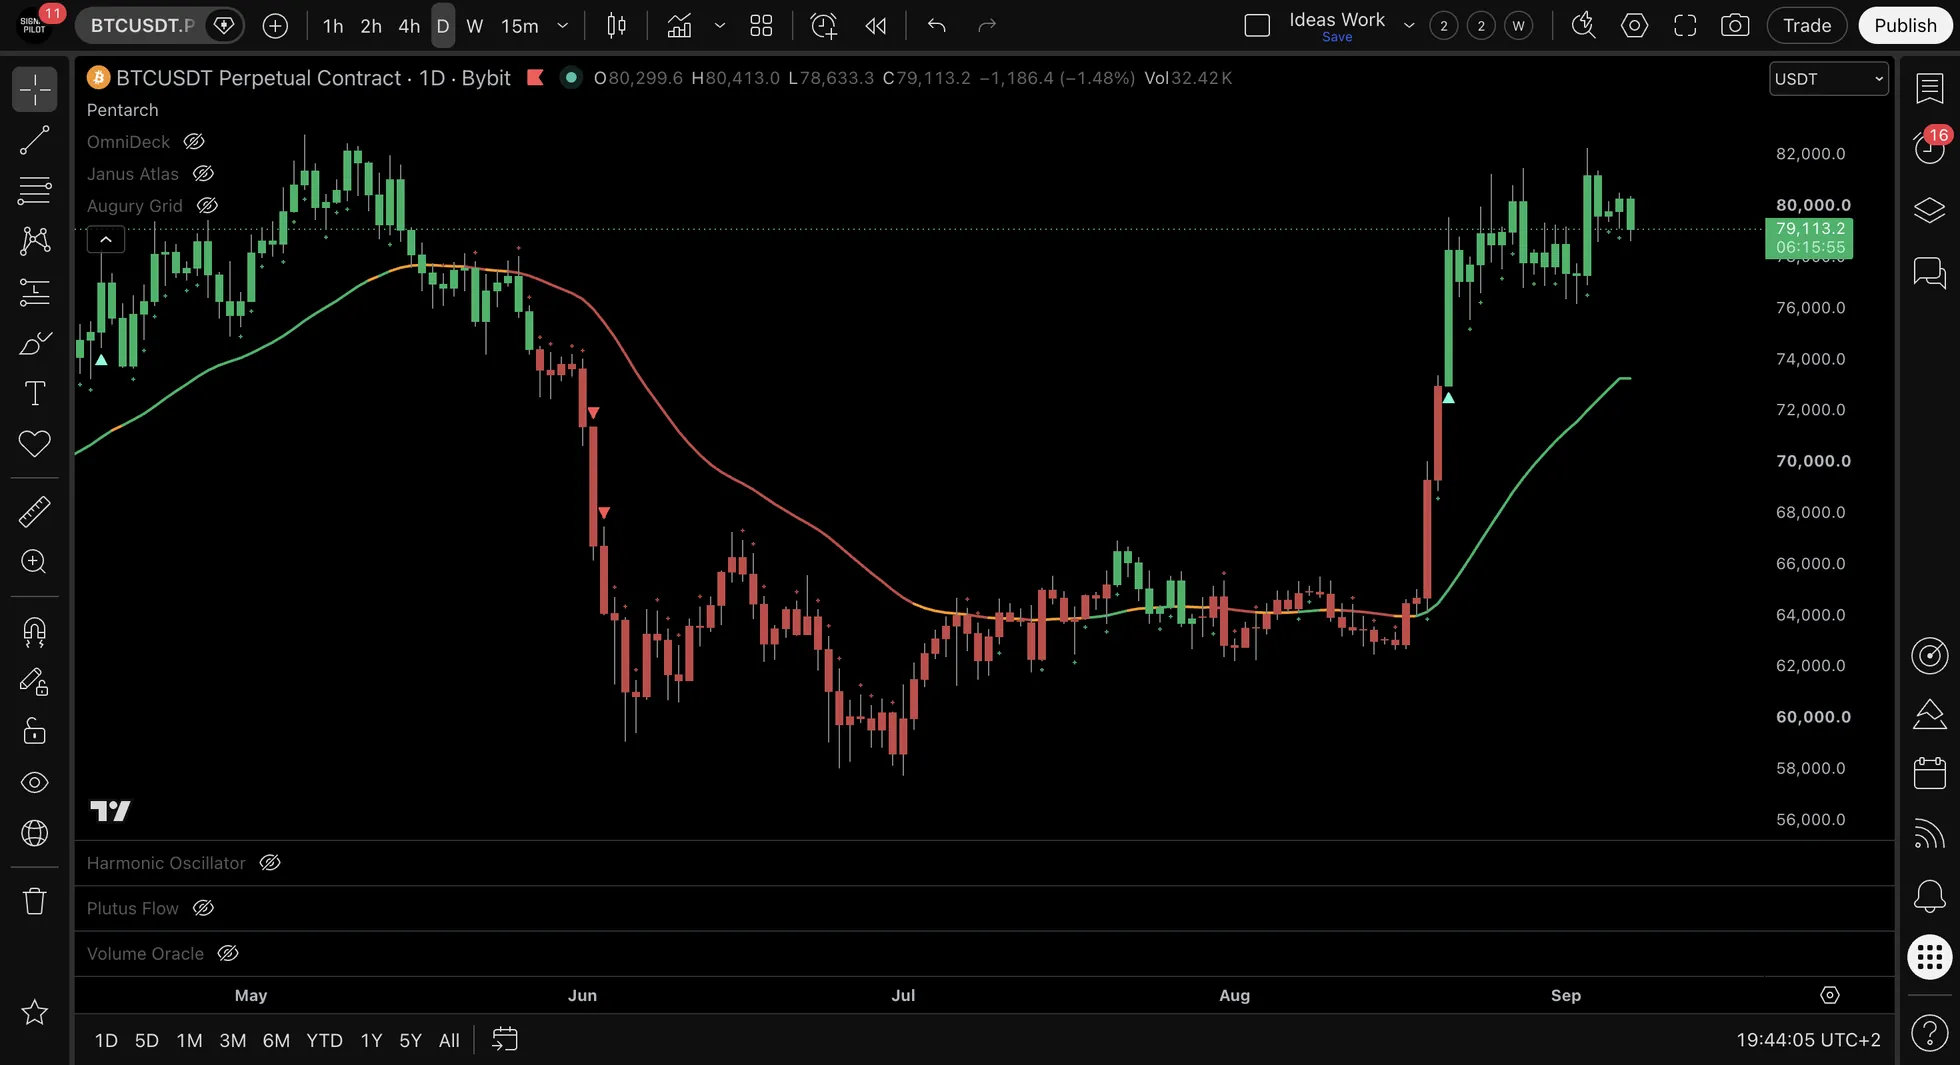
Every setting, every output and every panel is documented in the reference for this indicator.
What we tested
Measurements and worked examples that use this indicator, published in full.
- The easy mark and the hard one: NVDA, May to August 2026
- Judge an indicator by its misses: ETH, June and August 2026
- Are half your indicators saying the same thing?
- What waiting for confirmation actually costs
Try Pentarch
7-day free trial, no credit card. 7-day money-back guarantee. All future updates included, plus 100 free lessons in the education hub.
Part of The Elite Seven. More on cycle structure in Insights and the Chronicle.