Published as a TradingView Idea on ES1!. View the chart on TradingView
"Wait for confirmation" is the most repeated advice in trading and one of the least examined. Confirmation from what, measured how, and at what price?
All three are answerable on any chart you already own, in about twenty minutes.
The method
One field per instrument, chosen before you look at any result. Most indicators publish dozens of outputs and they do not agree with each other. Which one you pick decides your answer, so pick first and write it down.
Find a turn, and note the exact bar each instrument flipped. Not the week. The bar.
Read the price at the first flip and the price at the last. That difference is the cost of your definition of confirmation, expressed in the only unit that matters.
Worked through: the April 2026 low in ES1!
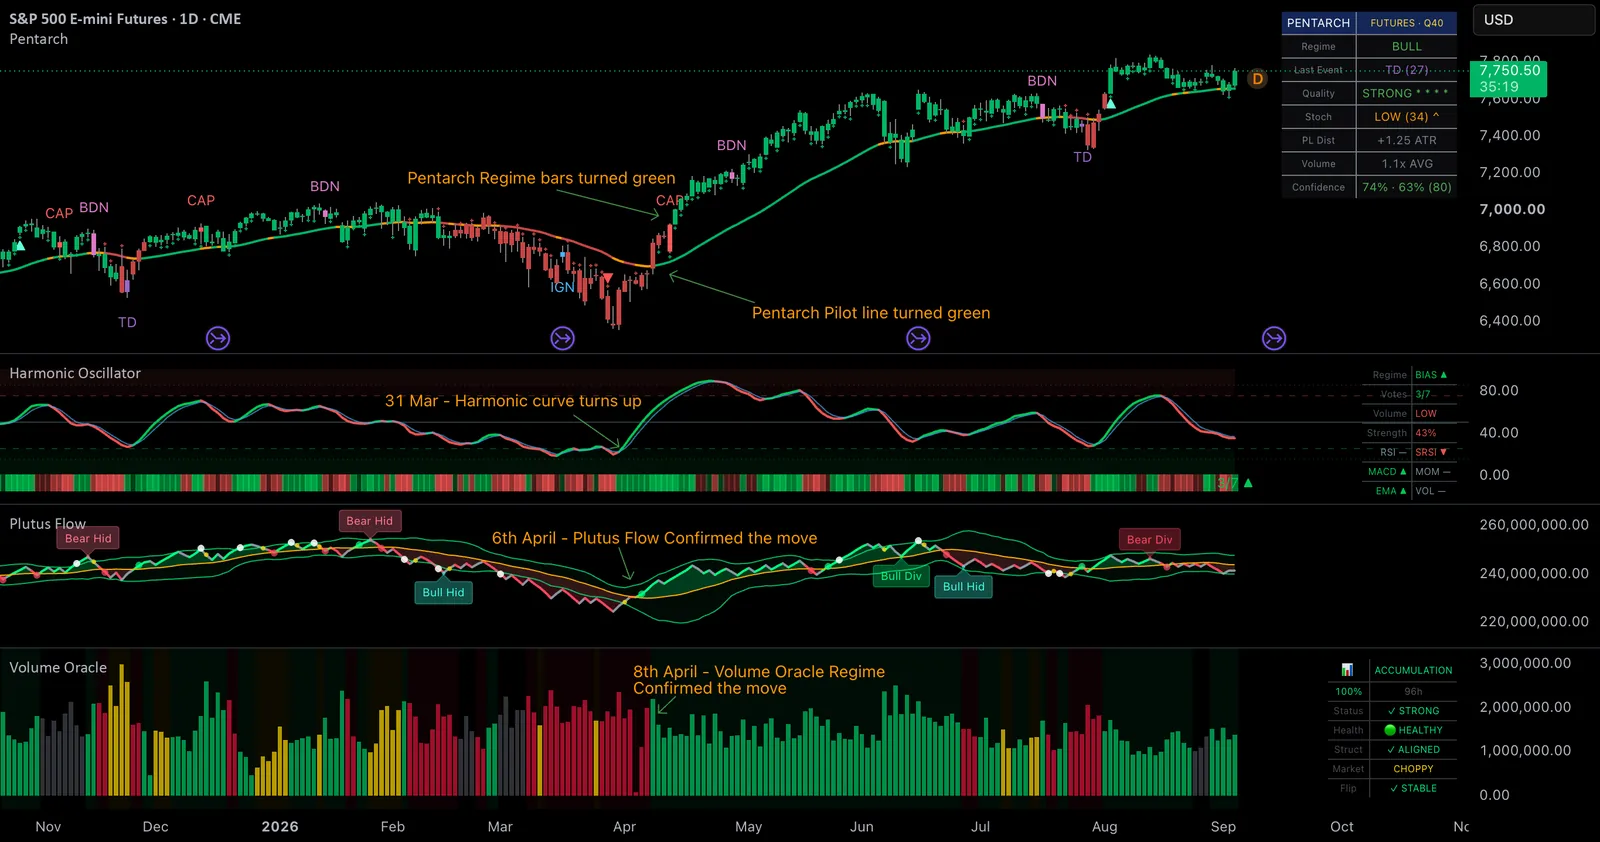
S&P 500 futures bottomed around 6,550 in early April 2026 and closed at 7,754 on 2 September. Four instruments turned bullish through that low, across five separate outputs, and they did it one at a time:
| date | instrument | field | ES1! |
|---|---|---|---|
| 31 Mar | Harmonic Oscillator | composite crossed above signal | 6,617.75 |
| 6 Apr | Plutus Flow | cumulative volume above its basis | ~6,700 |
| 8 Apr | Pentarch | price crossed the pilot line | 6,823.75 |
| 8 Apr | Volume Oracle | regime flipped to accumulation | 6,823.75 |
| 12 Apr | Pentarch | regime bars turned | 6,922.75 |
Twelve days. Three hundred and five points of ES between the first output and the last.
That gap is the whole decision
Acting on the first output meant acting while the other four had not moved. That is not being early, it is being alone, and being alone is usually just being wrong with better timing.
Waiting for all five meant paying 305 points and entering after the move was already established, which leaves less distance between your entry and the level that would prove the idea wrong.
Neither option is free, and neither is obviously correct. What is unusual is being able to see the size of the bill before choosing, rather than arguing about it afterwards.
The complication worth publishing
On that same 31 March bar, Harmonic's regime field printed bearish.
Same indicator, same bar, opposite readings. Its crossover turned bullish and its regime turned bearish, and both are real, documented, published outputs.
So "the first instrument turned on 31 March" is not a fact until you say which part of it turned. Had we used Harmonic's regime field instead of its crossover, the sequence would start on 8 April and the measured cost of confirmation would have been less than half as large.
That is not a defect in the indicator. A crossover and a regime read are answering different questions and are supposed to move at different speeds. It is a defect in any sentence that says "it turned bullish" without naming which output did.
It is also the reason the method begins by writing the field down. Choose after the fact and you will choose the flattering one without noticing.
Run it on yours
Take a turn you remember well. List your instruments. Fix one field each. Find the exact bar each one flipped, and read the price at the first and the last.
You will end up with a number instead of an opinion, and the number is specific to your chart, your instruments and your definition.
What this does not establish
One turn, one chart, one toolkit. A different symbol, timeframe or field selection produces a different spread.
And it prices confirmation without judging it. Three hundred and five points is cheap if waiting saves you from three failed entries, and expensive if it does not. This measures the bill, not whether it is worth paying.
Published as a TradingView Idea on ES1!. View the chart on TradingView
Past chart behaviour and measurement, described after the fact. Nothing here is a recommendation or an indication of future results.