The problem
On-balance volume is one of the oldest ideas in technical analysis and one of the least used well. The raw line is noisy, a single outlier bar can distort it for weeks, and spotting divergence by eye means staring at two charts and hoping.
Which is why most traders glance at OBV, see a squiggle, and go back to price.
What it shows
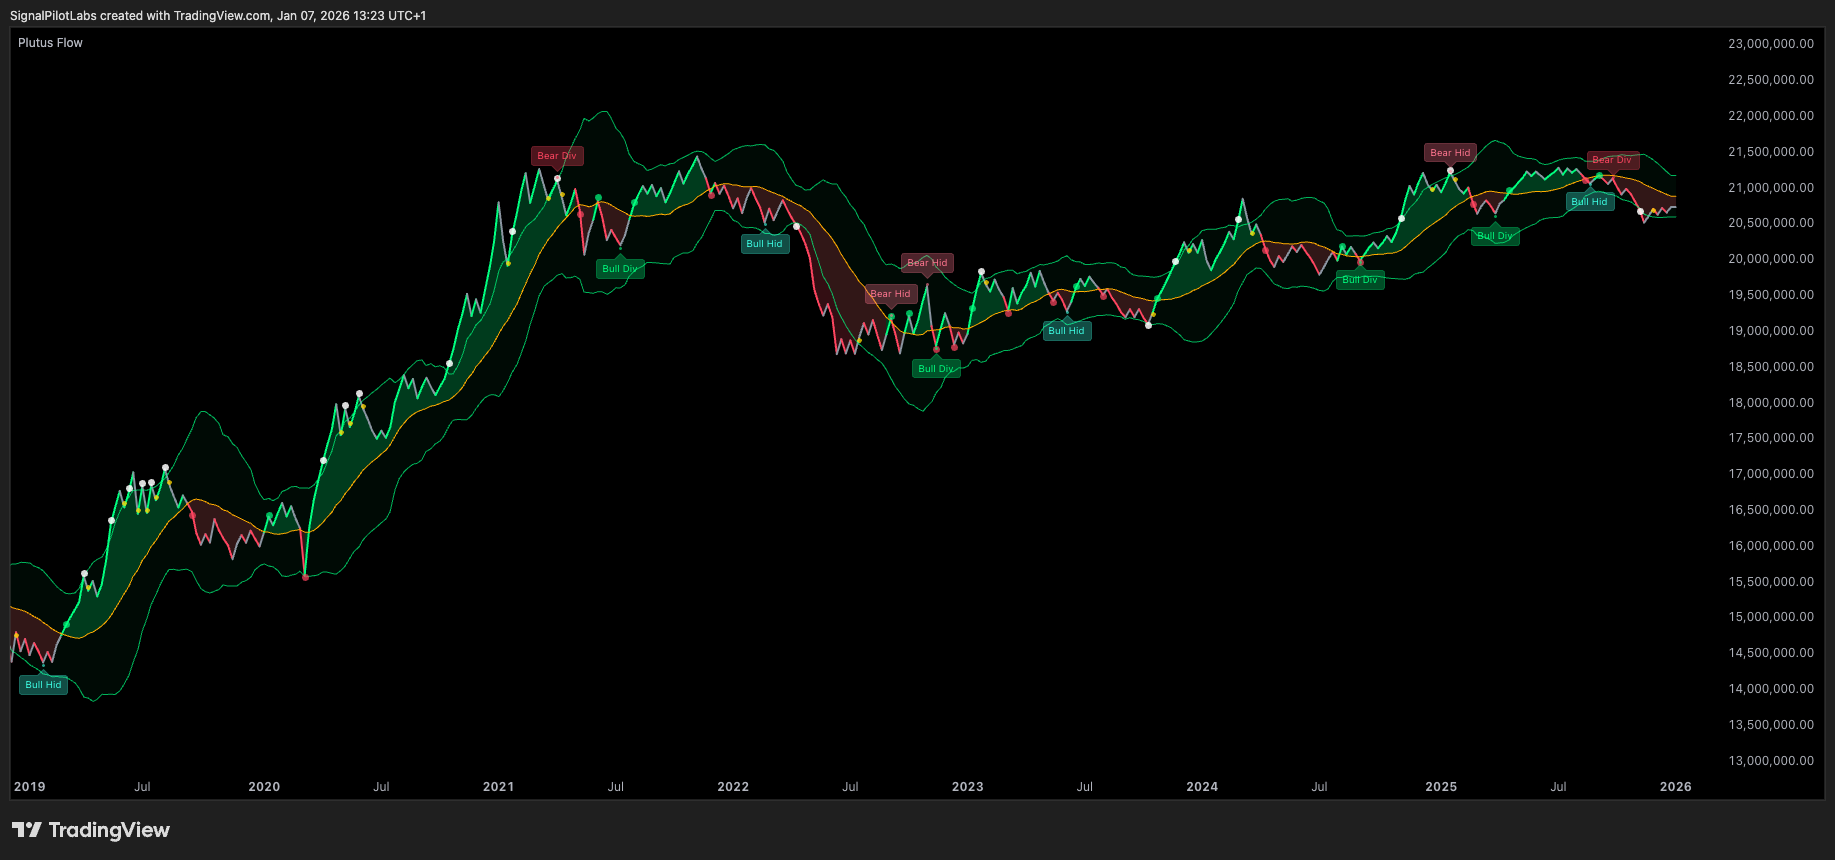
Plutus Flow puts four layers over on-balance volume so the disagreement between price and volume becomes visible rather than inferred.
| Divergence | Pattern | Reading |
|---|---|---|
| Bullish | Price lower low, OBV higher low | Selling pressure fading beneath a falling price |
| Bearish | Price higher high, OBV lower high | Buying pressure fading beneath a rising price |
| Hidden bullish | Price higher low, OBV lower low | Continuation within an uptrend |
| Hidden bearish | Price lower high, OBV higher high | Continuation within a downtrend |
Four layers over the raw line
Extreme zone entries and exits are marked with dots, which makes the reversion visible without watching the panel continuously.
Non-repainting, and what that means here
Every marker is confirmed at bar close and stays where it printed. What you see in history is exactly what you would have seen live, and that is the only way a backtest of your own eyes means anything.
What it isn’t
Divergence is not a timing tool and Plutus Flow does not treat it as one. Price and volume can disagree for a long time before anything happens, and sometimes nothing does.
Who it’s for
Traders who want volume analysis with a defined statistical basis rather than a line they eyeball and interpret generously.
On a real chart
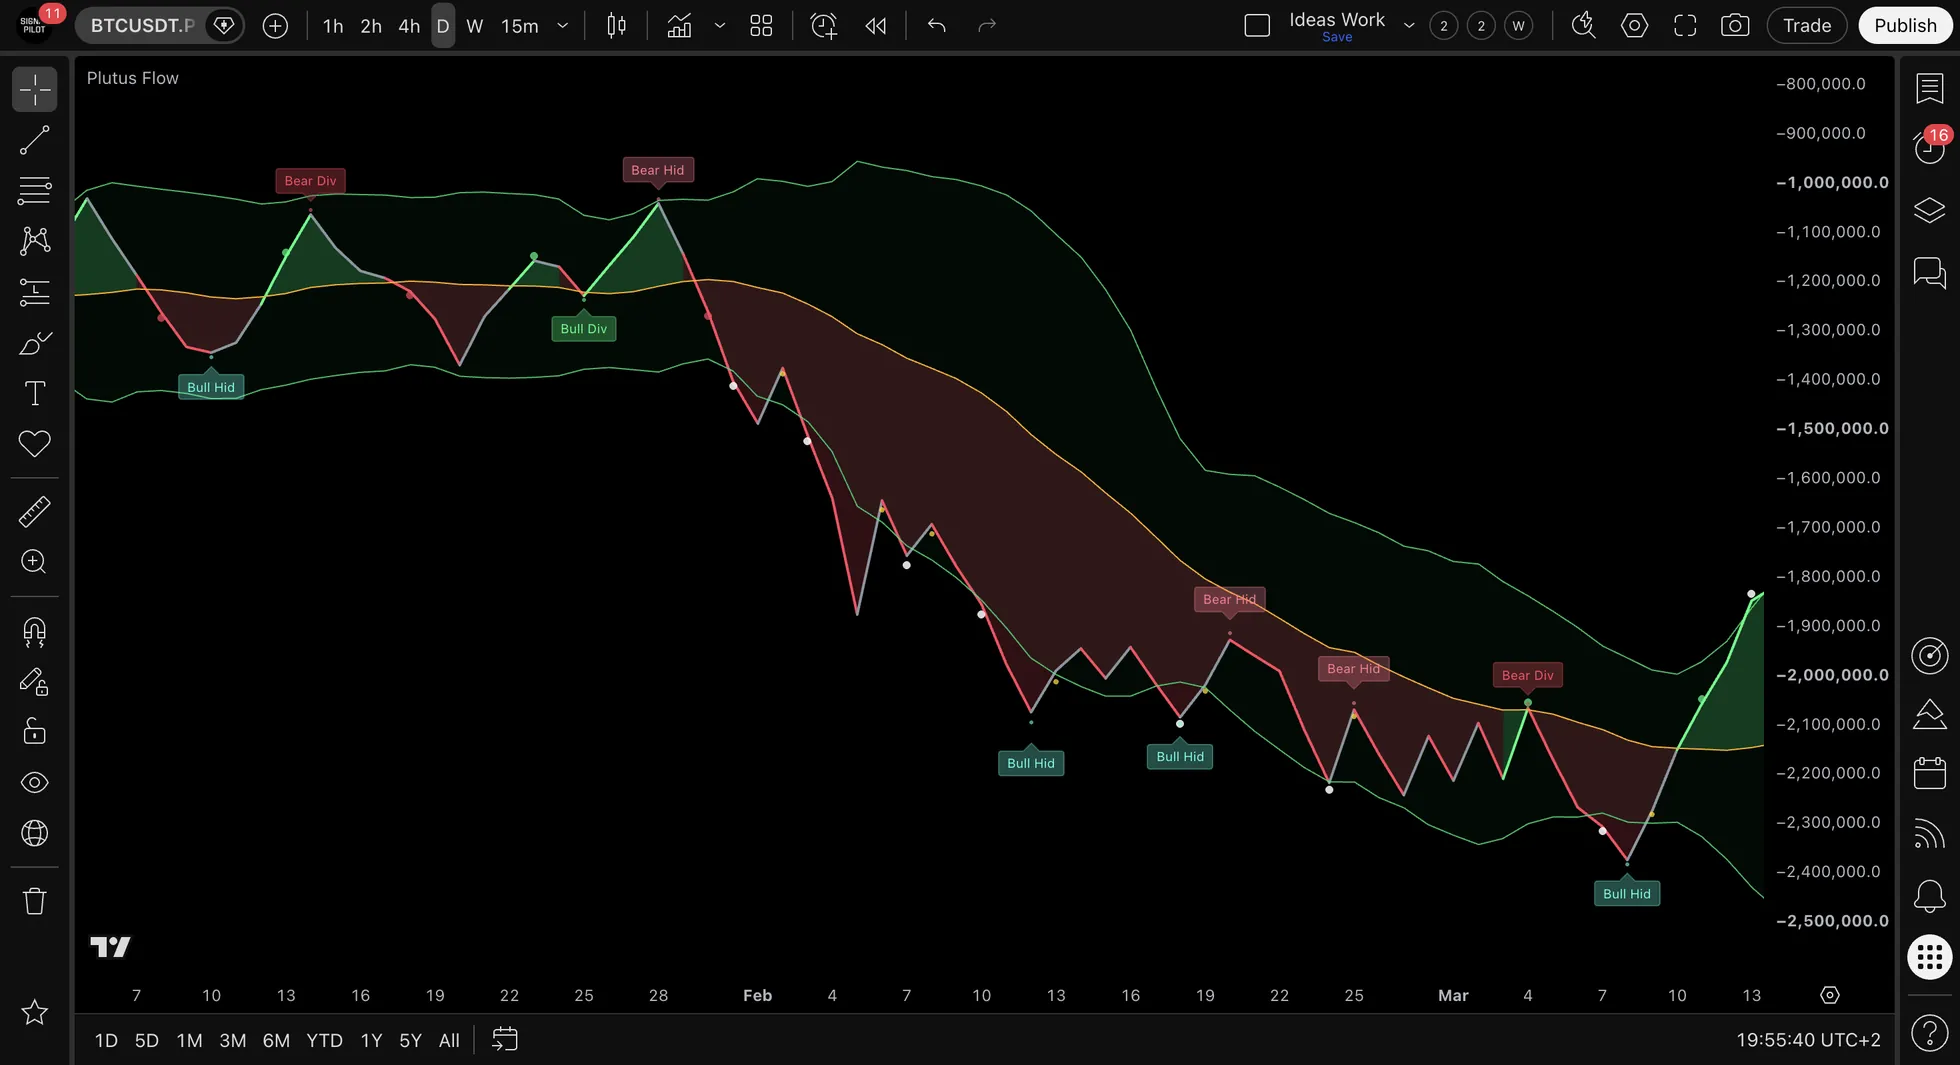
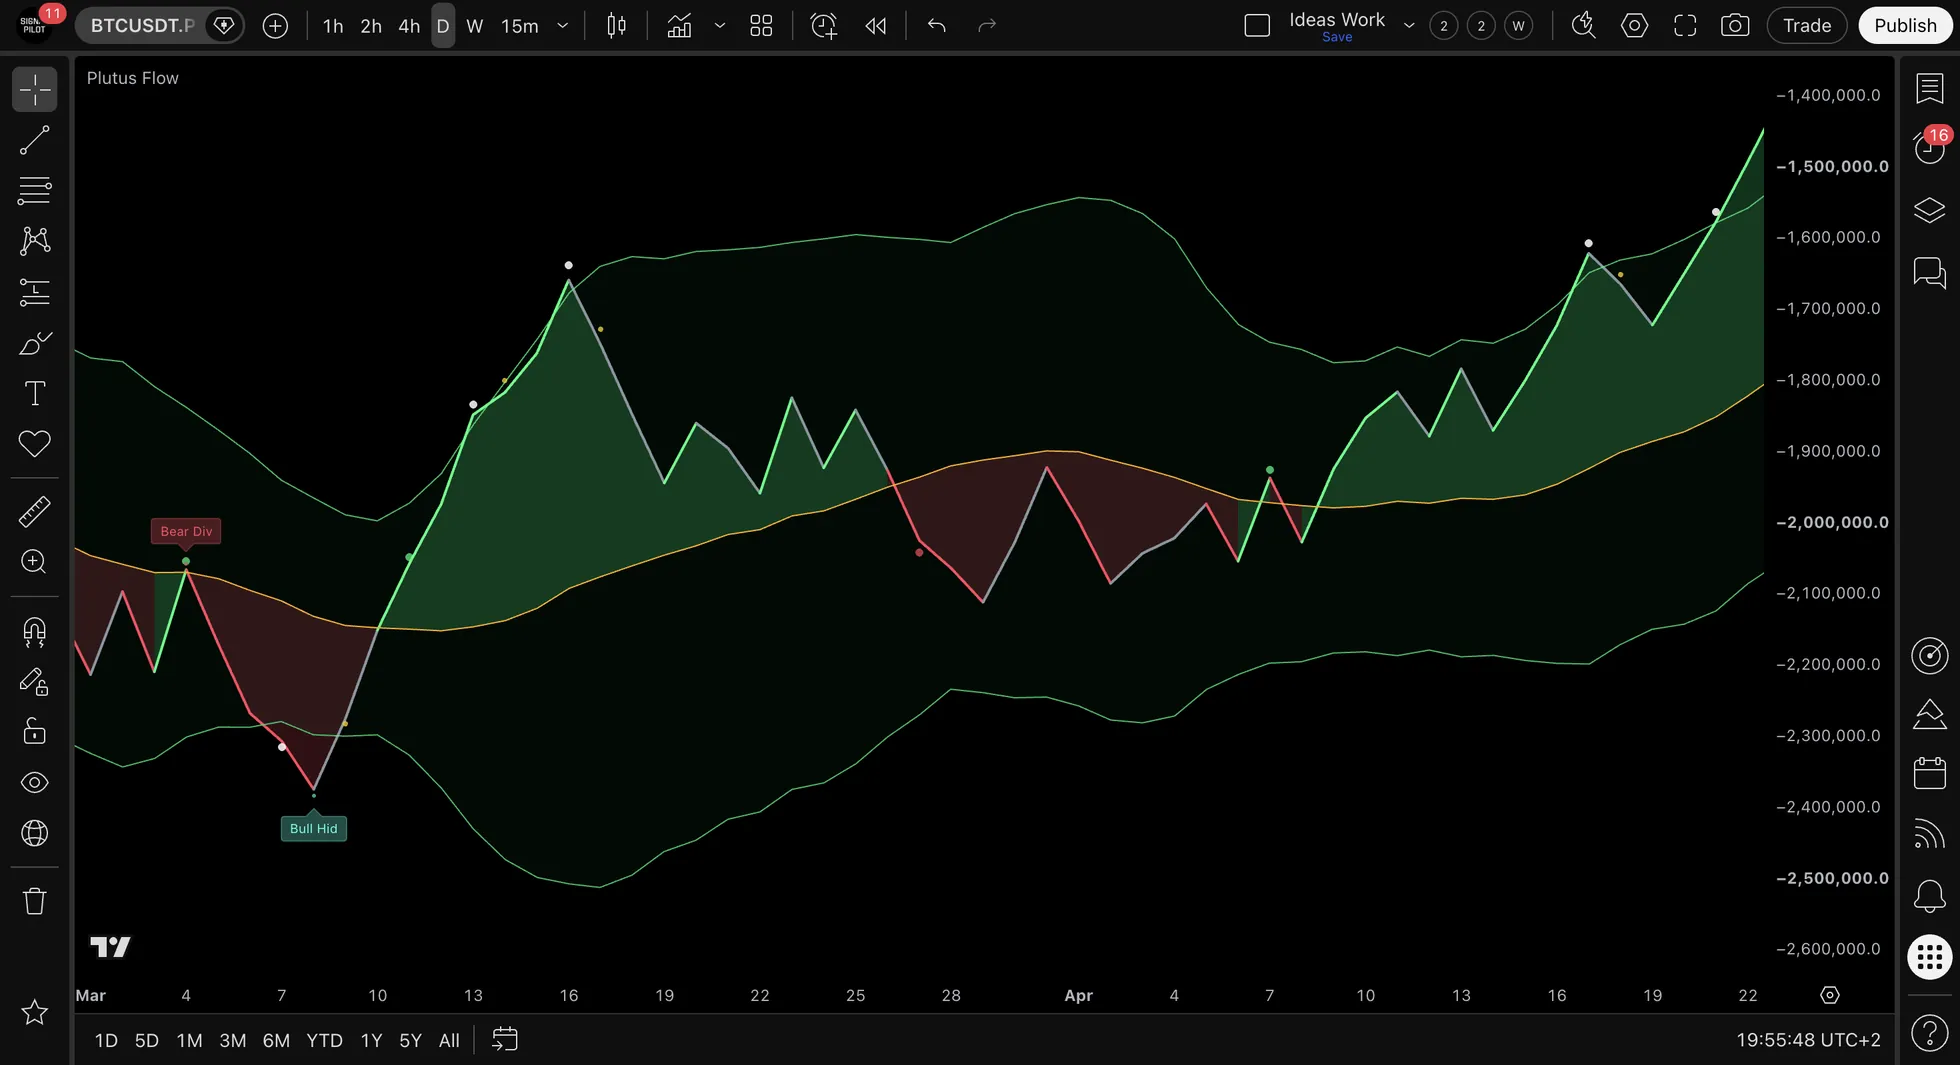
Every setting, every output and every panel is documented in the reference for this indicator.
What we tested
Measurements and worked examples that use this indicator, published in full.
- The easy mark and the hard one: NVDA, May to August 2026
- Judge an indicator by its misses: ETH, June and August 2026
- Are half your indicators saying the same thing?
- What waiting for confirmation actually costs
Try Plutus Flow
7-day free trial, no credit card. 7-day money-back guarantee. All future updates included, plus 100 free lessons in the education hub.
Part of The Elite Seven. More on cycle structure in Insights and the Chronicle.