Published as a TradingView Idea on NVDA. View the chart on TradingView
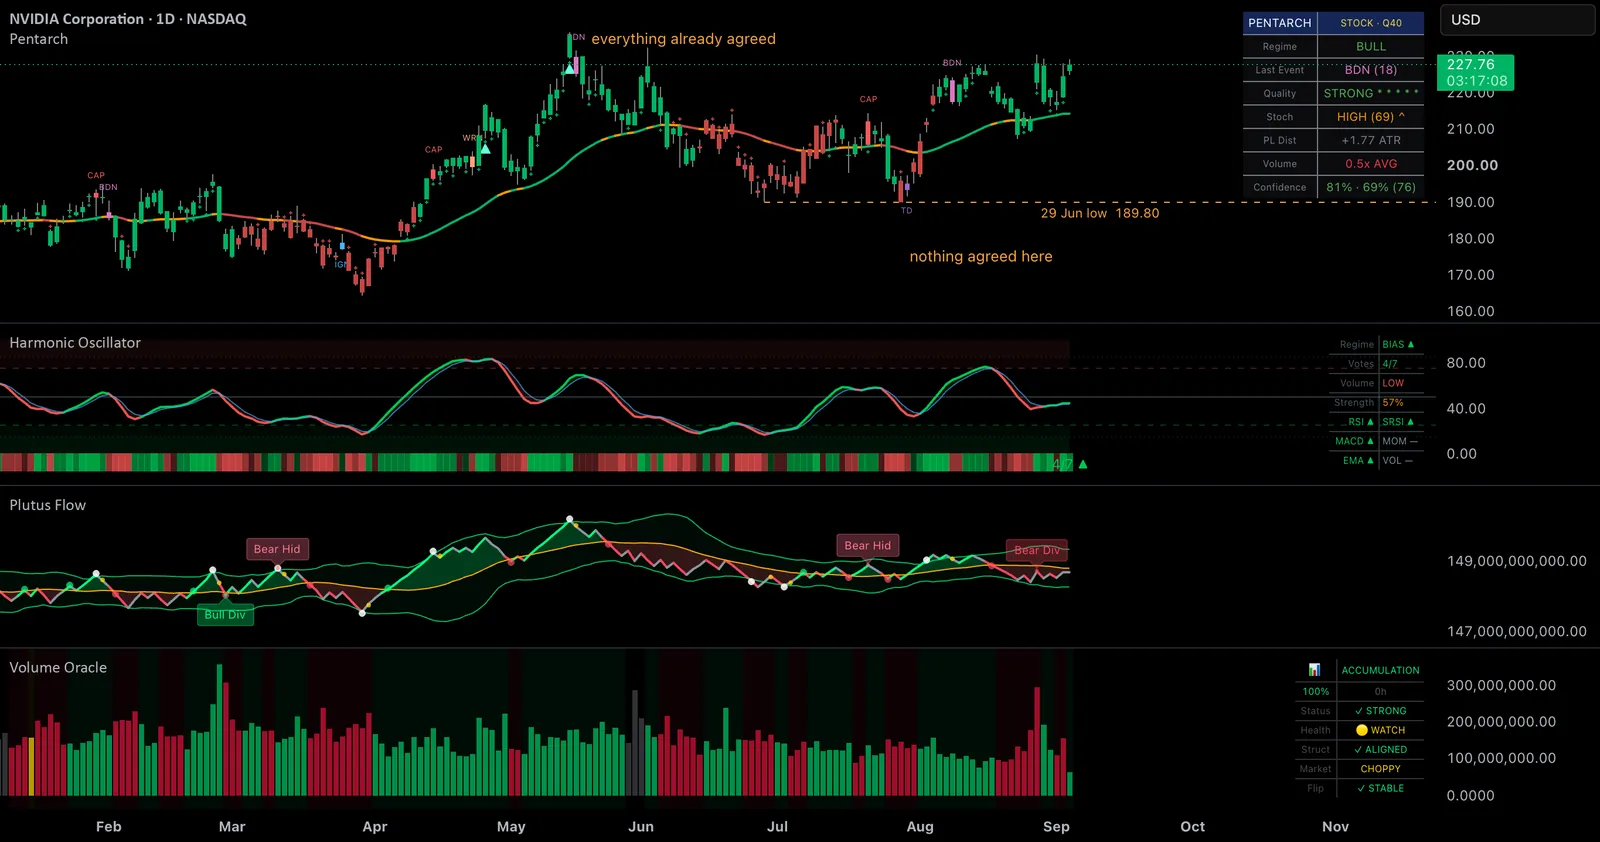
Two marks printed on NVDA's daily chart this summer, at opposite ends of the same swing.
One of them was easy to believe. The other was not. The difference between them is the useful part, and it says more about how these tools are meant to be read than any single call does.
May: the easy one
On Friday 15 May, Pentarch printed BDN, its breakdown mark, at 231.50 on the high of the bar.
There was nothing contrarian about it. The momentum layer had already rolled over on that same bar, having been firmly positive the session before. Volume Oracle, which tracks whether volume is being accumulated or distributed, had been flagging fading momentum since 11 May. Plutus Flow, which follows cumulative buying against selling pressure, dropped out of its extended zone that day.
Every layer pointed the same direction at the same time.
The following Monday opened at 229.87 and closed at 222.32. By 29 June price had reached 189.80, which is 18% below the high of the BDN bar.
Then forty five sessions of nothing
Between 15 May and 22 July, Pentarch printed no marks at all.
That silence deserves as much attention as the signals do. Anything that fires all the way down a trend is not identifying turns, it is following price and calling the echo a signal. The empty stretches are where a cycle layer either earns its place or gives itself away, and this one stayed quiet through the entire decline.
July: the hard one
The low was 189.80 on 29 June. Price rallied from there into 22 July, where Pentarch printed CAP at 214.39 on that bar's high, and five sessions later the close was 10.4% lower.
That pullback set a higher low. On 30 July, Pentarch printed TD, its touchdown mark, at 191.52 on the low of the bar.
One correction worth making before anyone else does: the TD did not mark the low of the decline. June's 189.80 was lower. What it marked was the low that held, which is a more useful thing, but it is not the same thing and it should not be sold as one.
This time nothing agreed with it. The momentum layer was reading four to nothing bearish. Volume Oracle still had the stock in distribution and was flagging fading momentum on that exact bar. Cumulative flow had turned down three days earlier, and the structural layer had lost its trend support the same day.
Why one was easy and one was not
A breakdown call and falling momentum point the same direction. In May, the cycle layer and everything around it were answering different questions and arriving at the same answer, so the mark cost nothing to believe.
A touchdown call asks you to credit a low while momentum is still falling. That is the entire difficulty of a bottom, and it is precisely why these layers exist separately. One asks where in a rotation price currently sits. The other asks whether the move actually underway has anything behind it.
On 30 July those questions genuinely had different answers, and each layer reported its own honestly rather than being smoothed into agreement. If they agreed on every bar, one of them would be redundant and you would be paying twice for the same opinion.
It also means a single mark is a place to start looking, never a conclusion. The chart said so at the time, out loud, by disagreeing with itself.
Agreement arrived afterwards. Momentum flipped positive on 31 July. Volume Oracle turned to accumulation on 3 August, and the structural layer crossed back up the same day. By 4 August momentum read five to nothing the other way and cumulative flow had pushed into its upper zone. Pentarch printed BDN at 224.14 on 10 August.
Twenty sessions after the TD bar, the close stood 16.9% above it, without having closed below that bar in between.
The bit you can check yourself
None of the above survives if the marks moved after the fact.
This matters more than it sounds. An indicator that quietly redraws its own history will produce a flawless looking chart every single time, and any story told from it is fiction. It is also close to impossible to spot unless you go looking.
So do not take our word for it. Open the chart, put it in bar replay, and walk it forward.
At the 29 July close, there is no TD. Advance into 30 July while that bar is still forming, and there is still no TD. The moment 30 July closes, TD appears on that bar at 191.52.
Same bar. Same level. Thirty four sessions later it is still sitting there.
That is the whole mechanic, and it is duller than the word "non-repainting" makes it sound: the mark confirms when its bar closes, is drawn on that bar, and never moves again. One bar of confirmation, nothing borrowed from the future.
What this is not
One swing, on one chart. It should not be read as how these tools behave in general, and this piece does not measure that.
The same look across other symbols in the same period turns up marks that got run over. A CAP on gold in early August was followed by another 6% higher. A CAP on ETH in mid-August by another 14%. Any tool that only ever produced examples like this NVDA one would be a tool being described dishonestly.
Which is the actual point. The claim is not that the marks are right. It is narrower and more useful than that: you can go back and check them, because they have not moved. Most of what gets published in this space cannot survive that test, because the calls that went wrong were quietly deleted.
Published as a TradingView Idea on NVDA. View the chart on TradingView
TD Touchdown, IGN Ignition, WRN Warning, CAP Climax, BDN Breakdown
Past chart behaviour, described after the fact. Nothing here is a recommendation or an indication of future results.