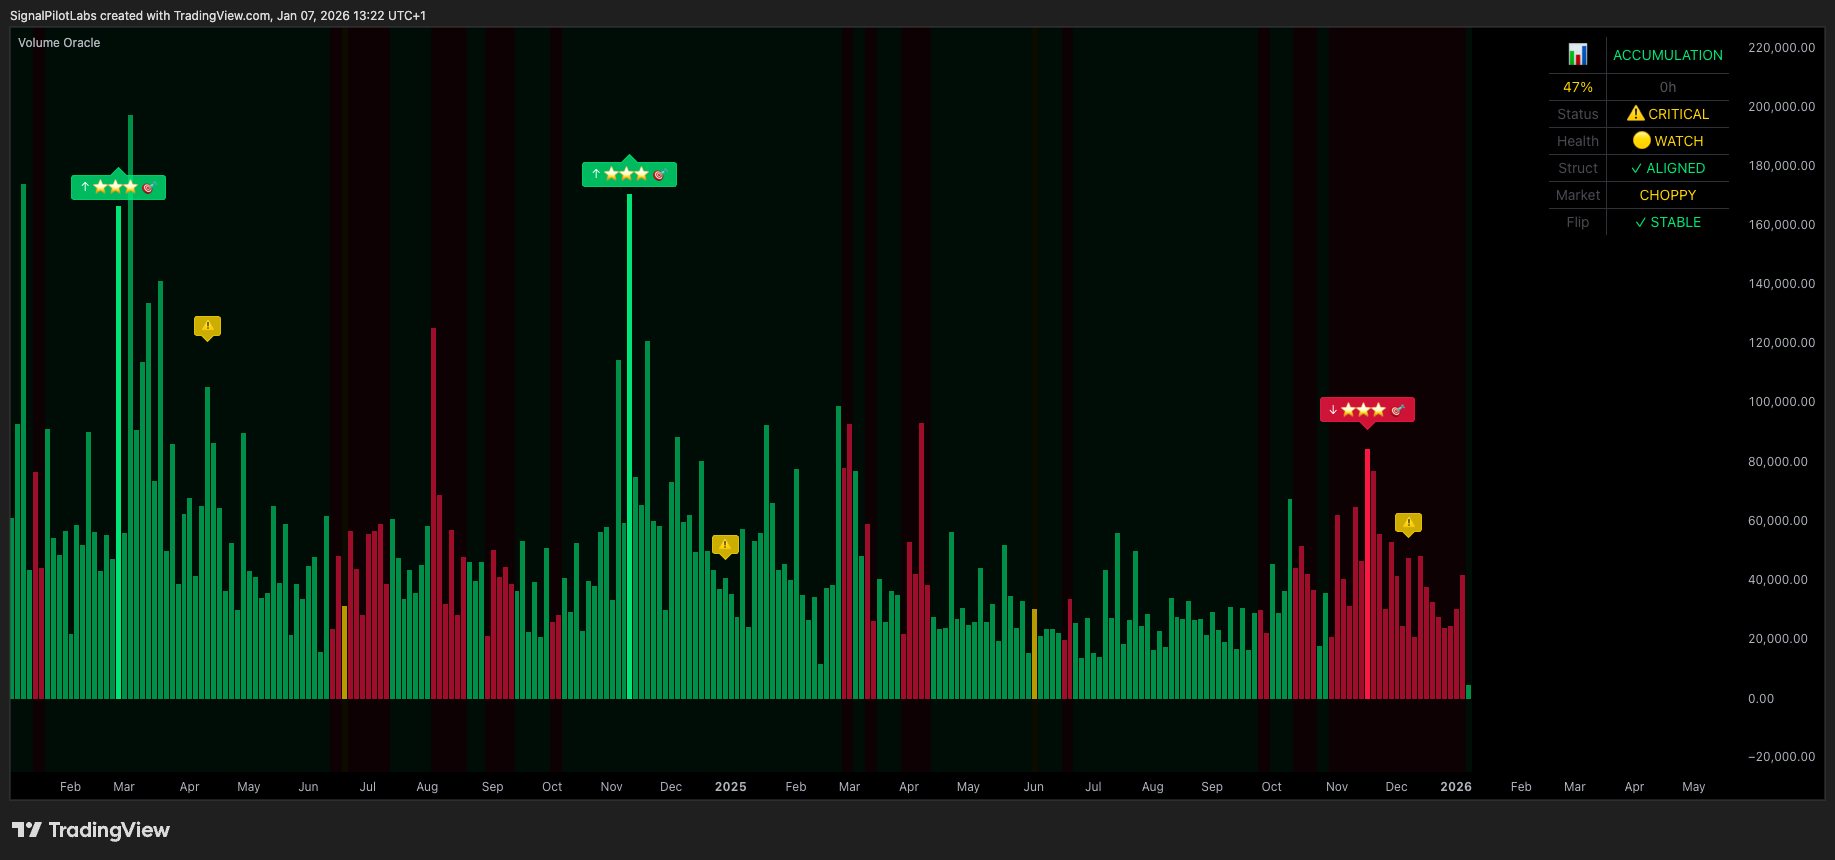
The problem
Volume bars tell you how much traded. They do not tell you what it meant. A spike on a red candle can be capitulation or the start of real selling, and the bar looks identical either way.
Reading that difference by eye takes years, and most people substitute a moving average on volume and call it analysis.
What it shows
Volume Oracle resolves volume into a regime state, shown continuously rather than as one-off alerts.
| Regime | Colour | Bias |
|---|---|---|
| ACCUMULATION | Green | Bullish |
| DISTRIBUTION | Red | Bearish |
| NEUTRAL | Gray | None |
Five systems behind the regime call
Signals carry a star rating of three, two or one, so a marginal read is visibly marginal instead of looking like every other signal on the chart.
On the chart
Non-repainting, and what that means here
Every marker is confirmed at bar close and stays where it printed. What you see in history is exactly what you would have seen live, and that is the only way a backtest of your own eyes means anything.
What it isn’t
A regime reading is context, not an instruction. Volume Oracle describes what volume is currently doing. It does not predict what price will do next.
Who it’s for
Traders who want to know whether a move has real participation behind it before treating it as meaningful.
On a real chart
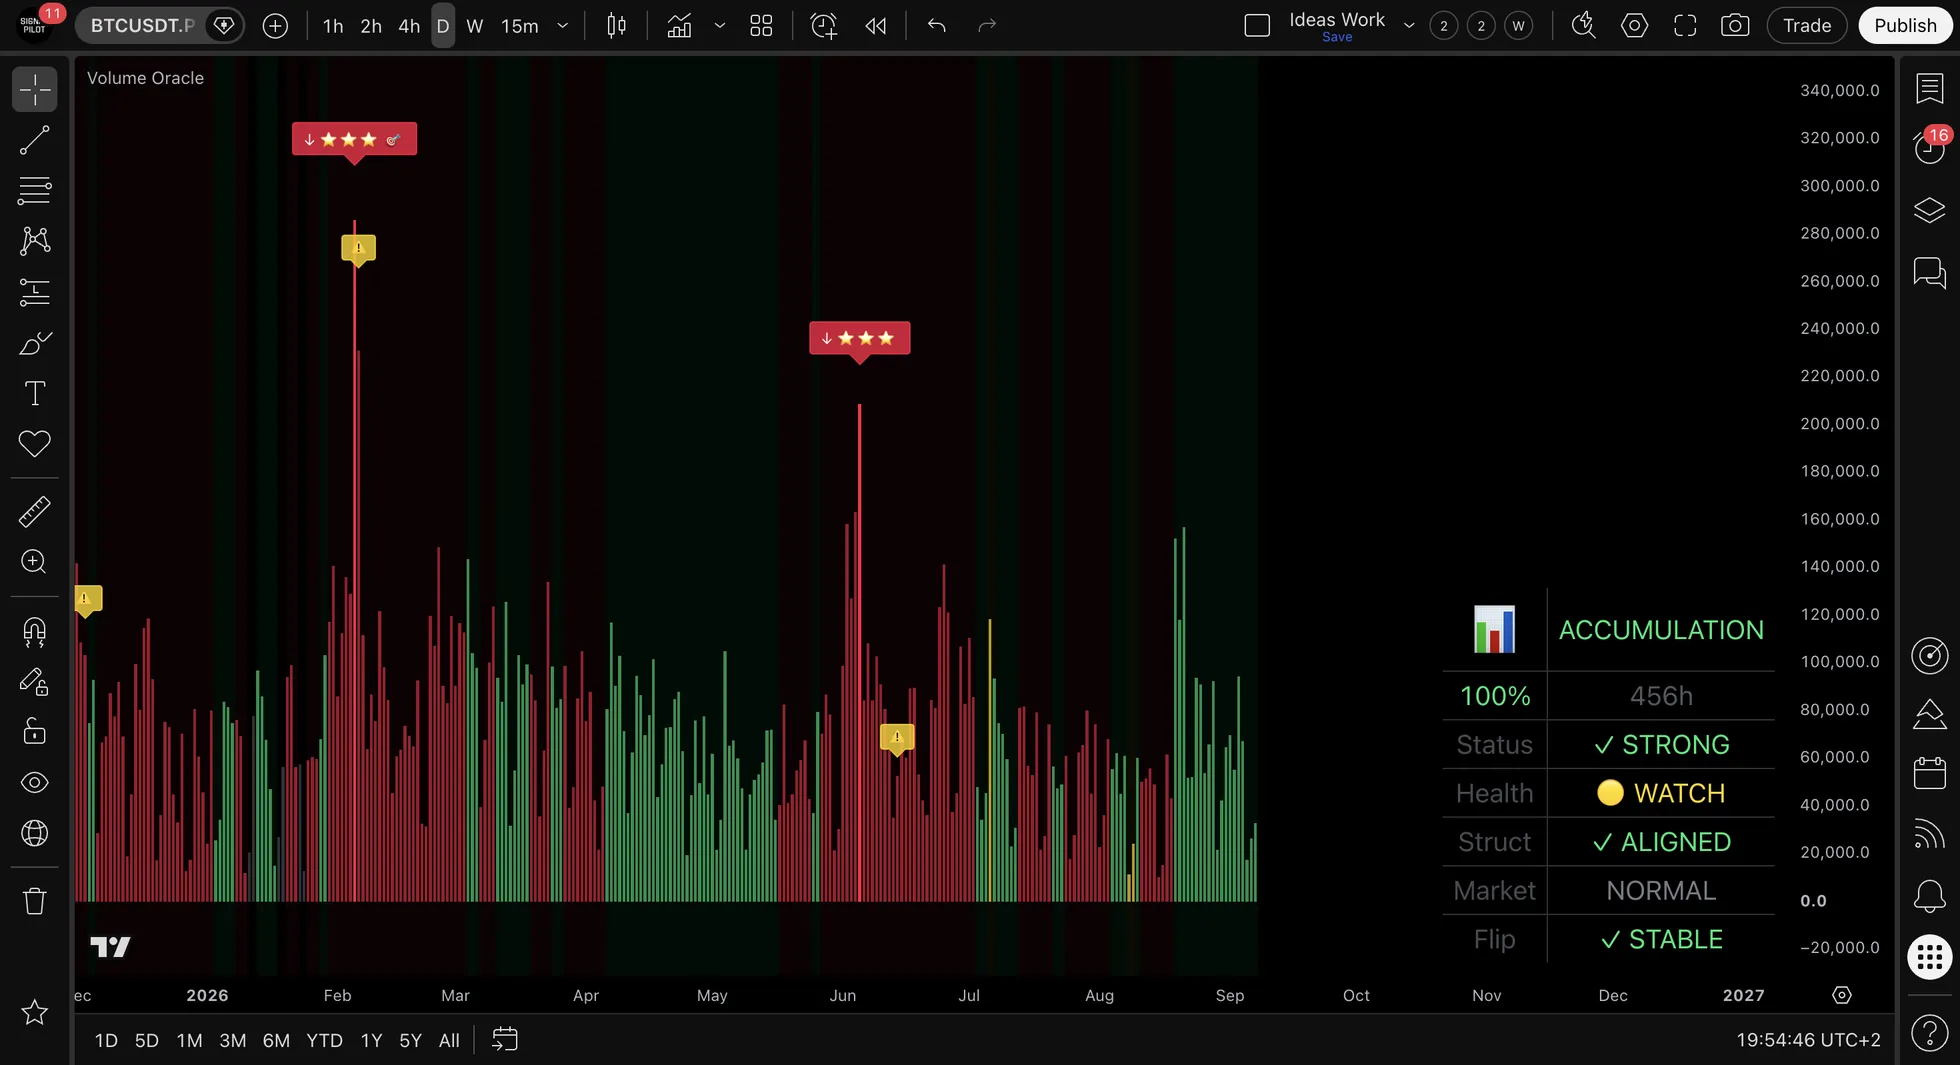
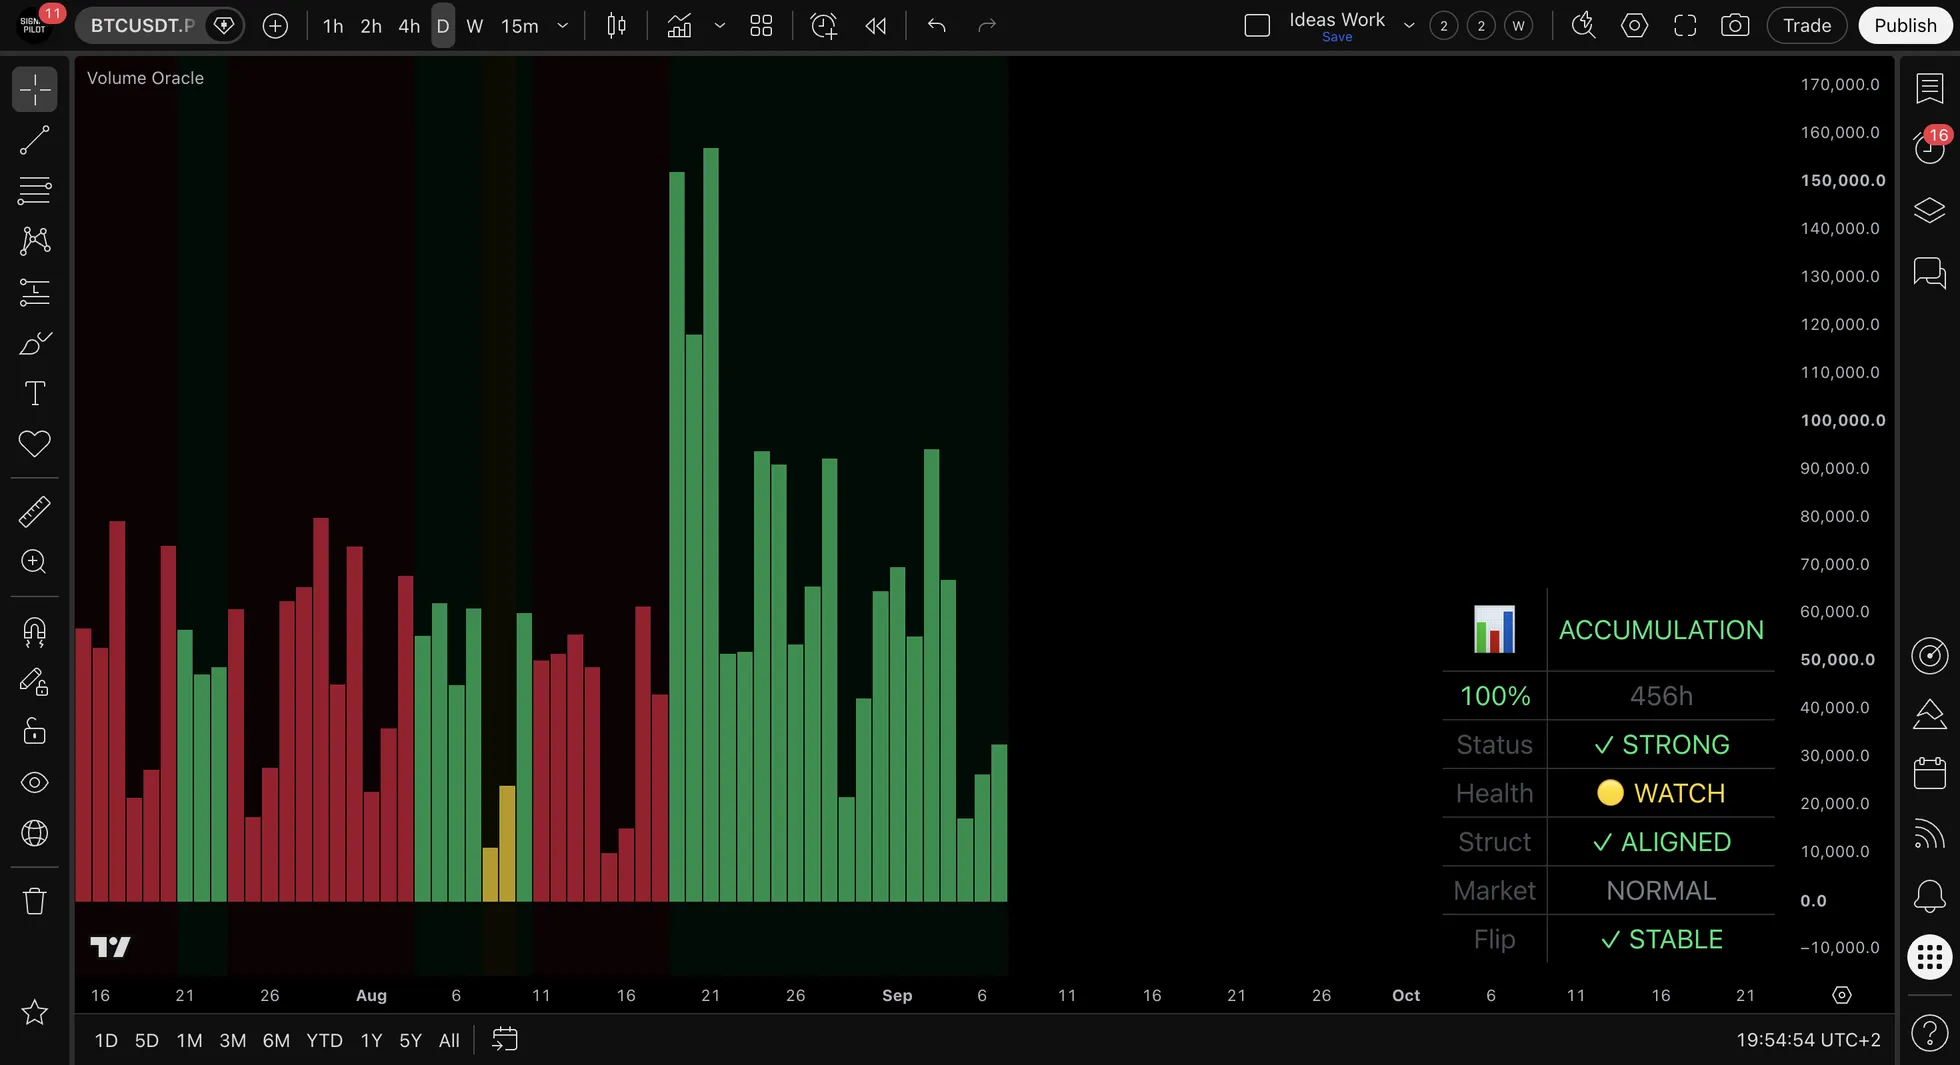
Every setting, every output and every panel is documented in the reference for this indicator.
What we tested
Measurements and worked examples that use this indicator, published in full.
- The easy mark and the hard one: NVDA, May to August 2026
- Judge an indicator by its misses: ETH, June and August 2026
- Are half your indicators saying the same thing?
- What waiting for confirmation actually costs
Try Volume Oracle
7-day free trial, no credit card. 7-day money-back guarantee. All future updates included, plus 100 free lessons in the education hub.
Part of The Elite Seven. More on cycle structure in Insights and the Chronicle.