Volume Oracle - Regime Detection
Regime-based volume intelligence indicator. Detects accumulation and distribution phases through adaptive flow analysis, market structure validation, and multi-factor quality scoring.
New to Technical Analysis? Start Here
What Is Volume Oracle?
Volume Oracle analyzes buying and selling pressure to identify market regimes : periods where institutions are accumulating (buying) or distributing (selling).
Think of it like reading the "mood" of the market:
- ACCUMULATION = Big players buying → Green regime → Bullish bias
- DISTRIBUTION = Big players selling → Red regime → Bearish bias
- NEUTRAL = No clear direction → Gray regime → Wait for clarity
What You'll See on Your Chart:
- Volume Bars : Green (bullish) or Red (bearish) colored by regime
- Signal Labels : ↑ or ↓ arrows with quality stars (⭐⭐⭐)
- Regime Table : Dashboard showing current regime status and health
- Background Tint : Subtle green/red tint showing regime direction
How It Works (Simple Version):
- Analyzes volume flow over time (not just single bars)
- Detects when regime flips between accumulation/distribution
- Validates signals with market structure and multiple factors
- Shows quality score so you know which signals matter most
🎓 Why Regimes Matter
Regimes = The Market's Direction
Individual volume bars are noisy. Regimes smooth out the noise:
- Strong ACCUMULATION regime = Sustained buying pressure over time, not just one bar
- Regime FADING = Early warning that direction may change
- Structure CONFLICT = Price action disagrees with regime → be cautious
Volume Oracle helps you analyze WITH the dominant flow, not against it.
Start by watching the regime table. Learn ACCUMULATION vs DISTRIBUTION, then observe how regime changes relate to price.
🎯 Core Functionality Intermediate
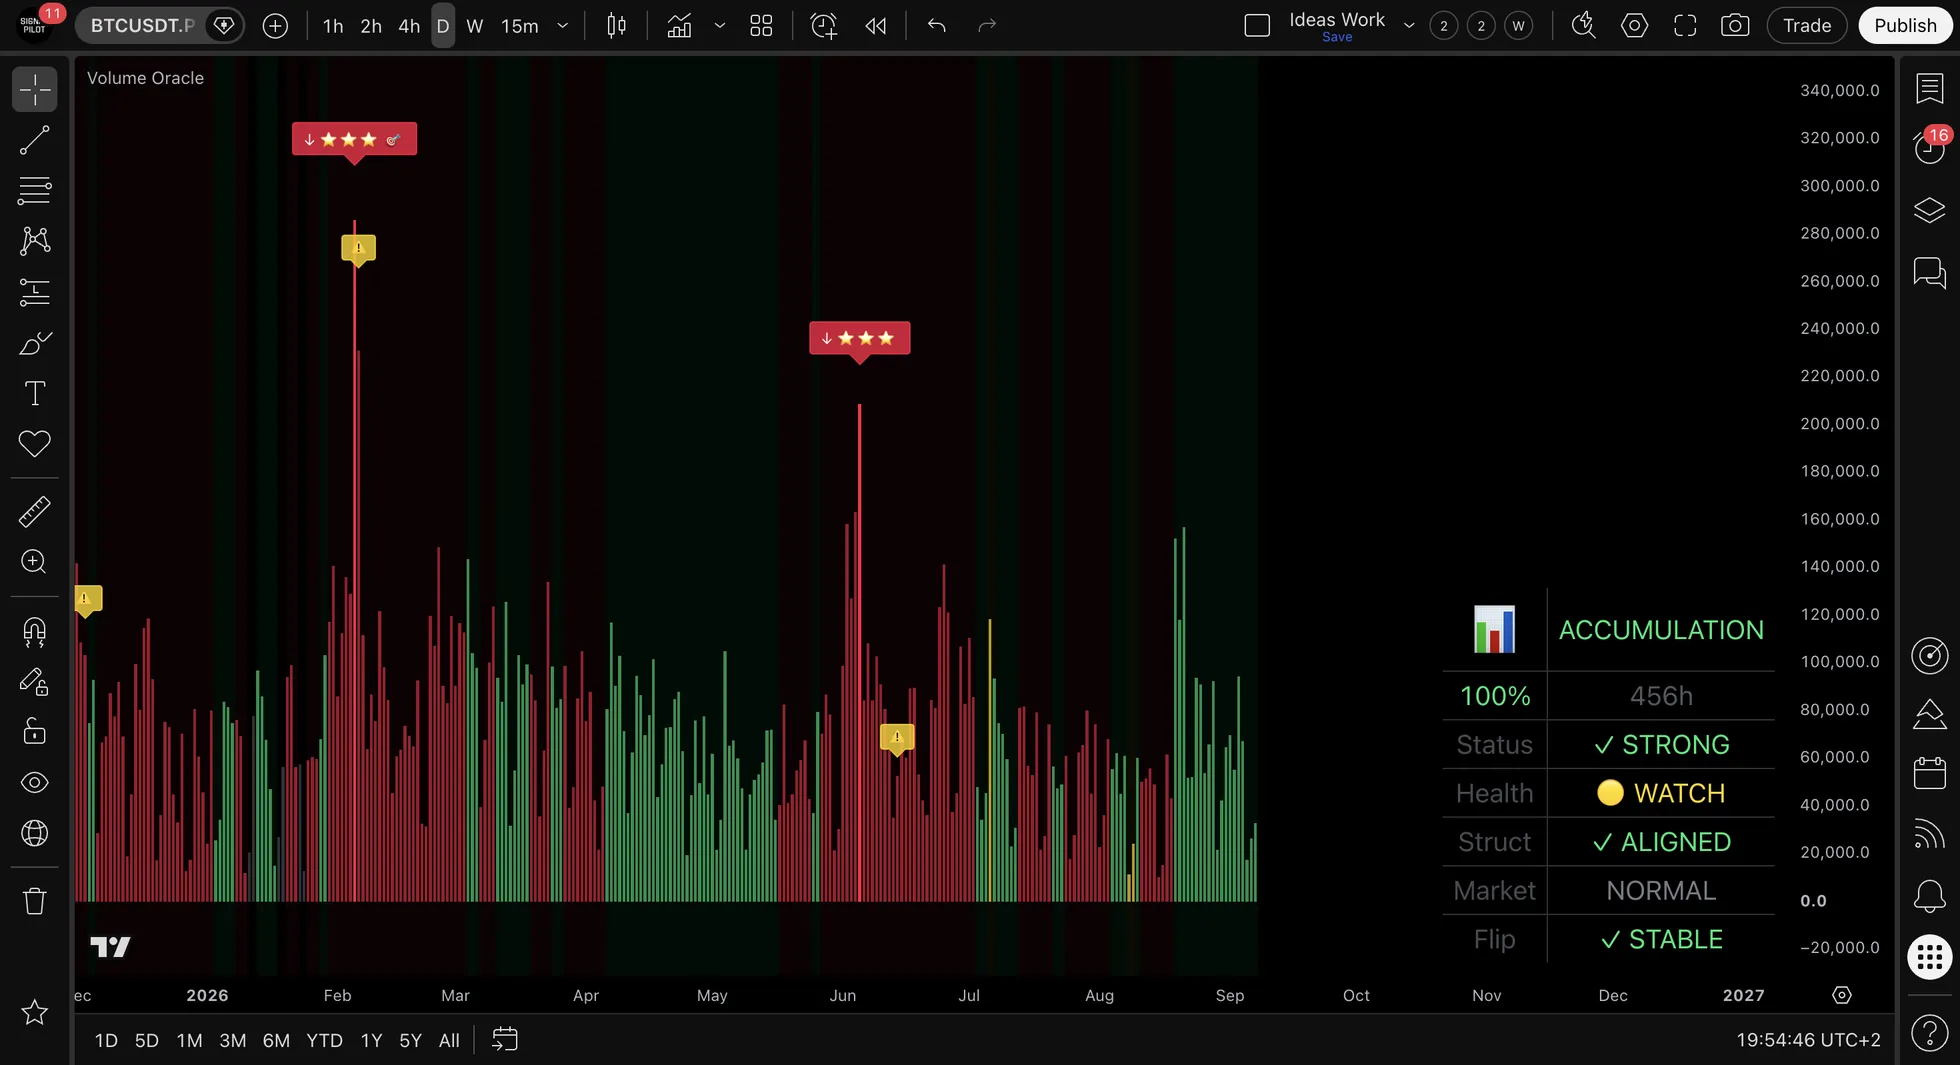
Regime State Machine
Volume Oracle tracks volume flow through three regime states:
            ┌───────────────┐
            │    NEUTRAL    │
     ┌──────▶    (Gray)    ◀──────┐
     │      └───────┬───────┘     │
     │              │             │
  Weakens       Confirms       Weakens
     │              │             │
     │       ┌──────┴──────┐      │
     │       ▼             ▼      │
┌─────────────┐     ┌─────────────┐
│ ACCUMULATION│     │DISTRIBUTION │
│   (Green)   │◀───▶│   (Red)     │
│ Buying Flow │     │Selling Flow │
└─────────────┘     └─────────────┘
State Transitions: Regime changes require confirmation bars (adaptive to timeframe). Flip counter prevents whipsaws in choppy markets. Early warnings fire BEFORE regime actually flips.
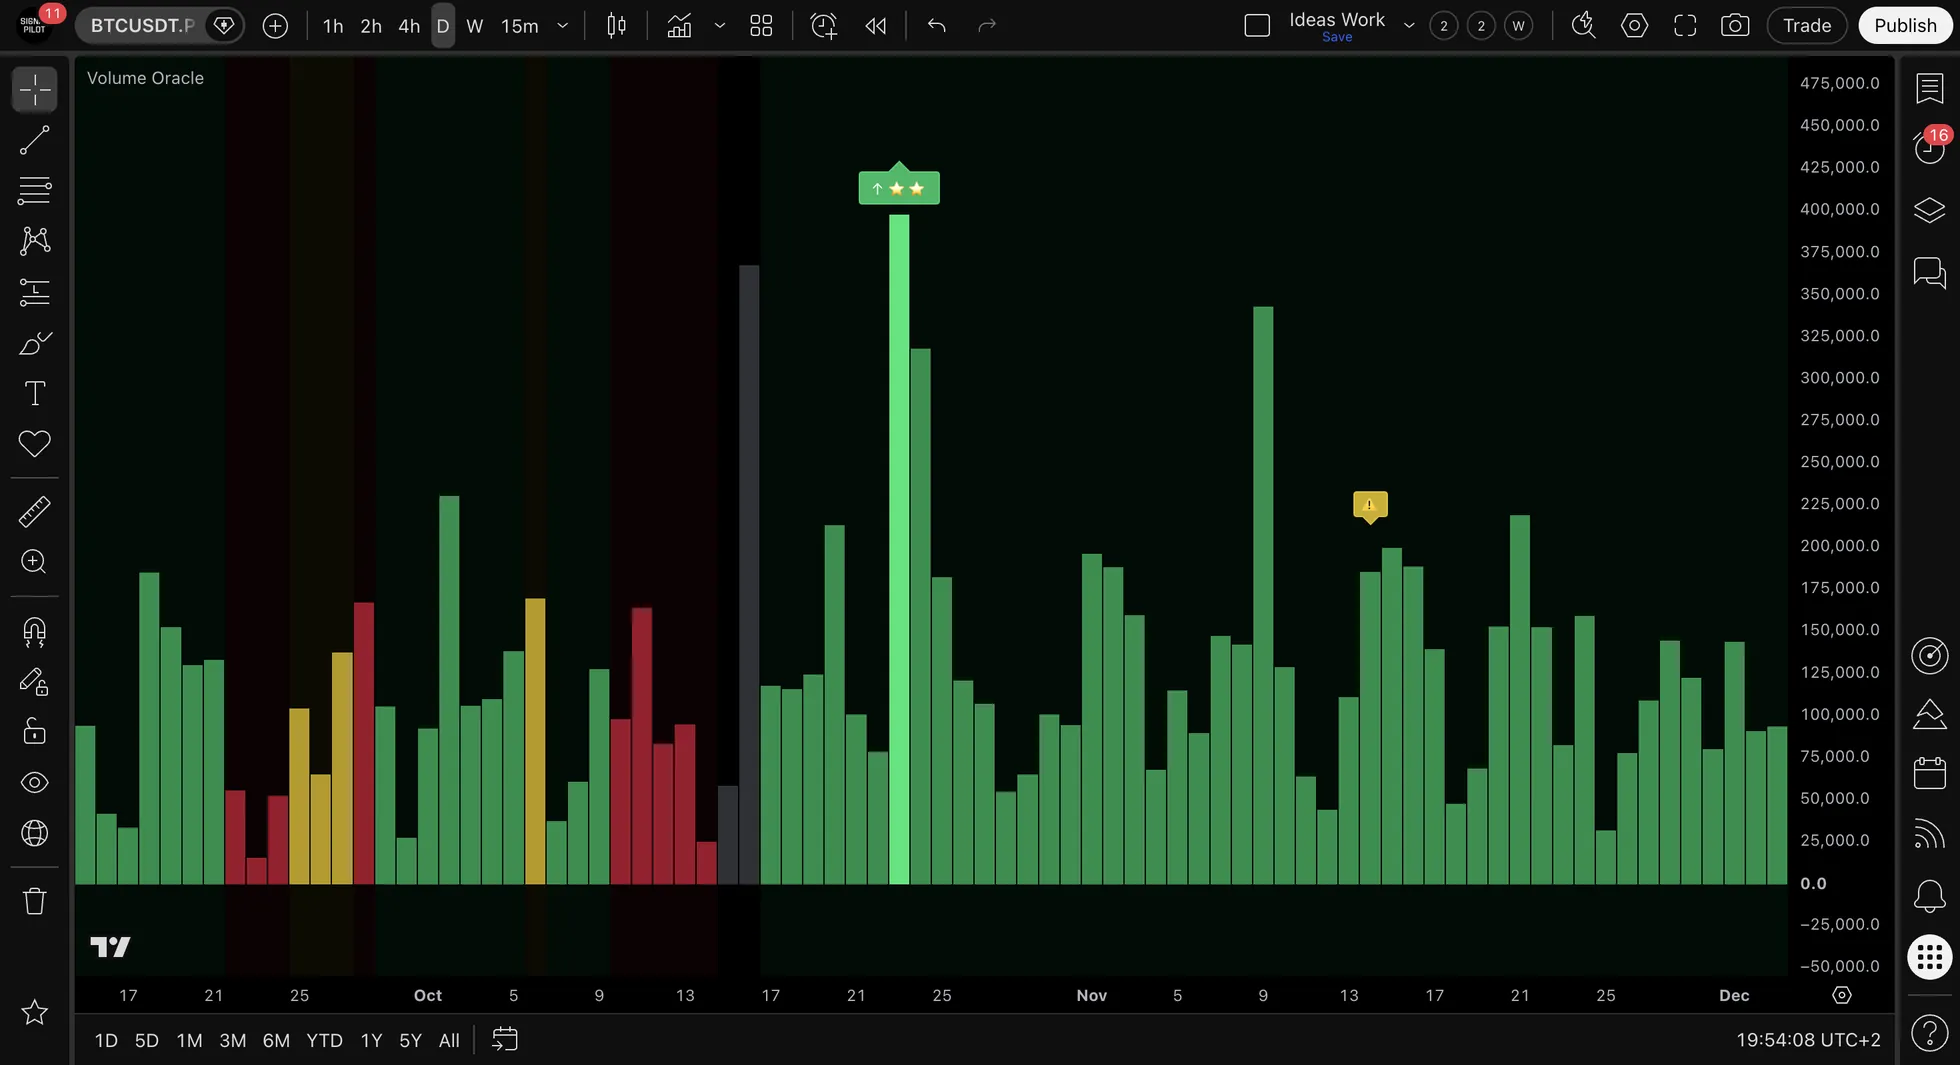
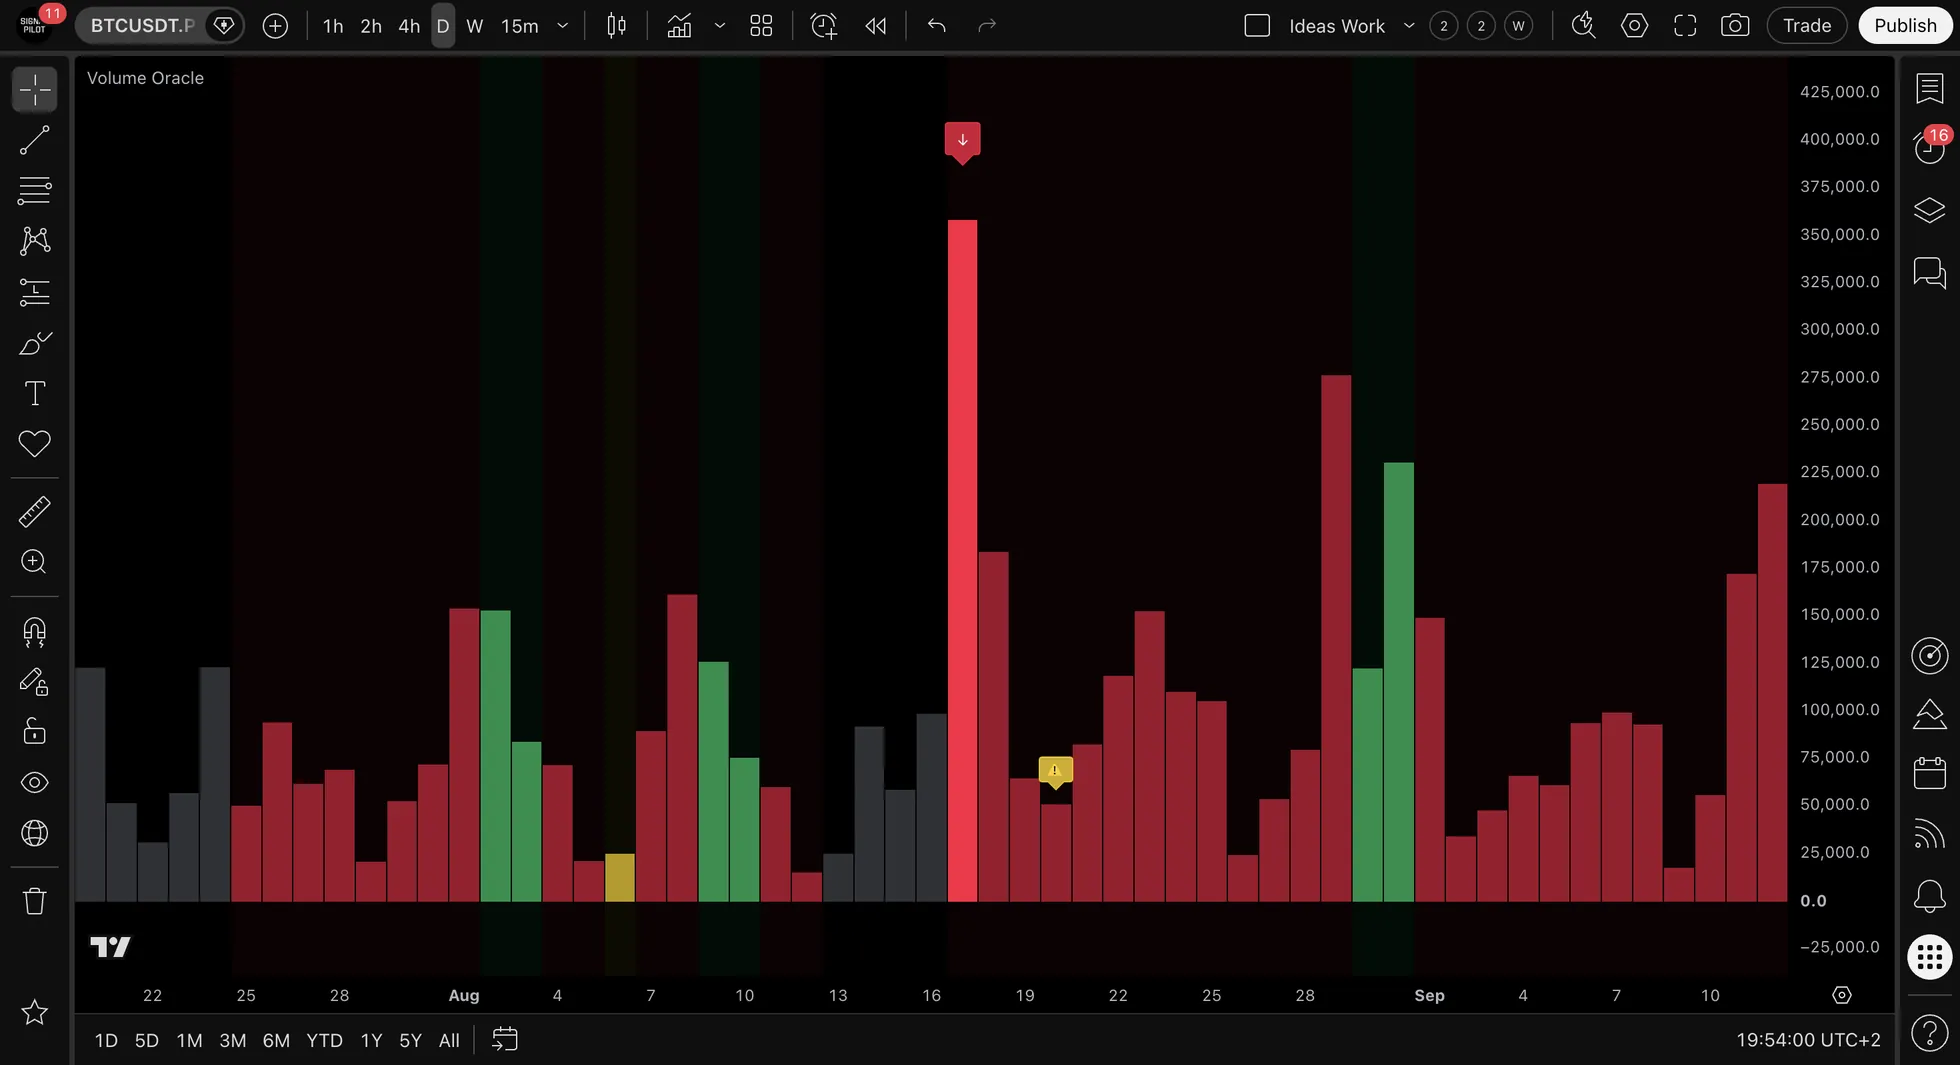
Signal Quality Scoring
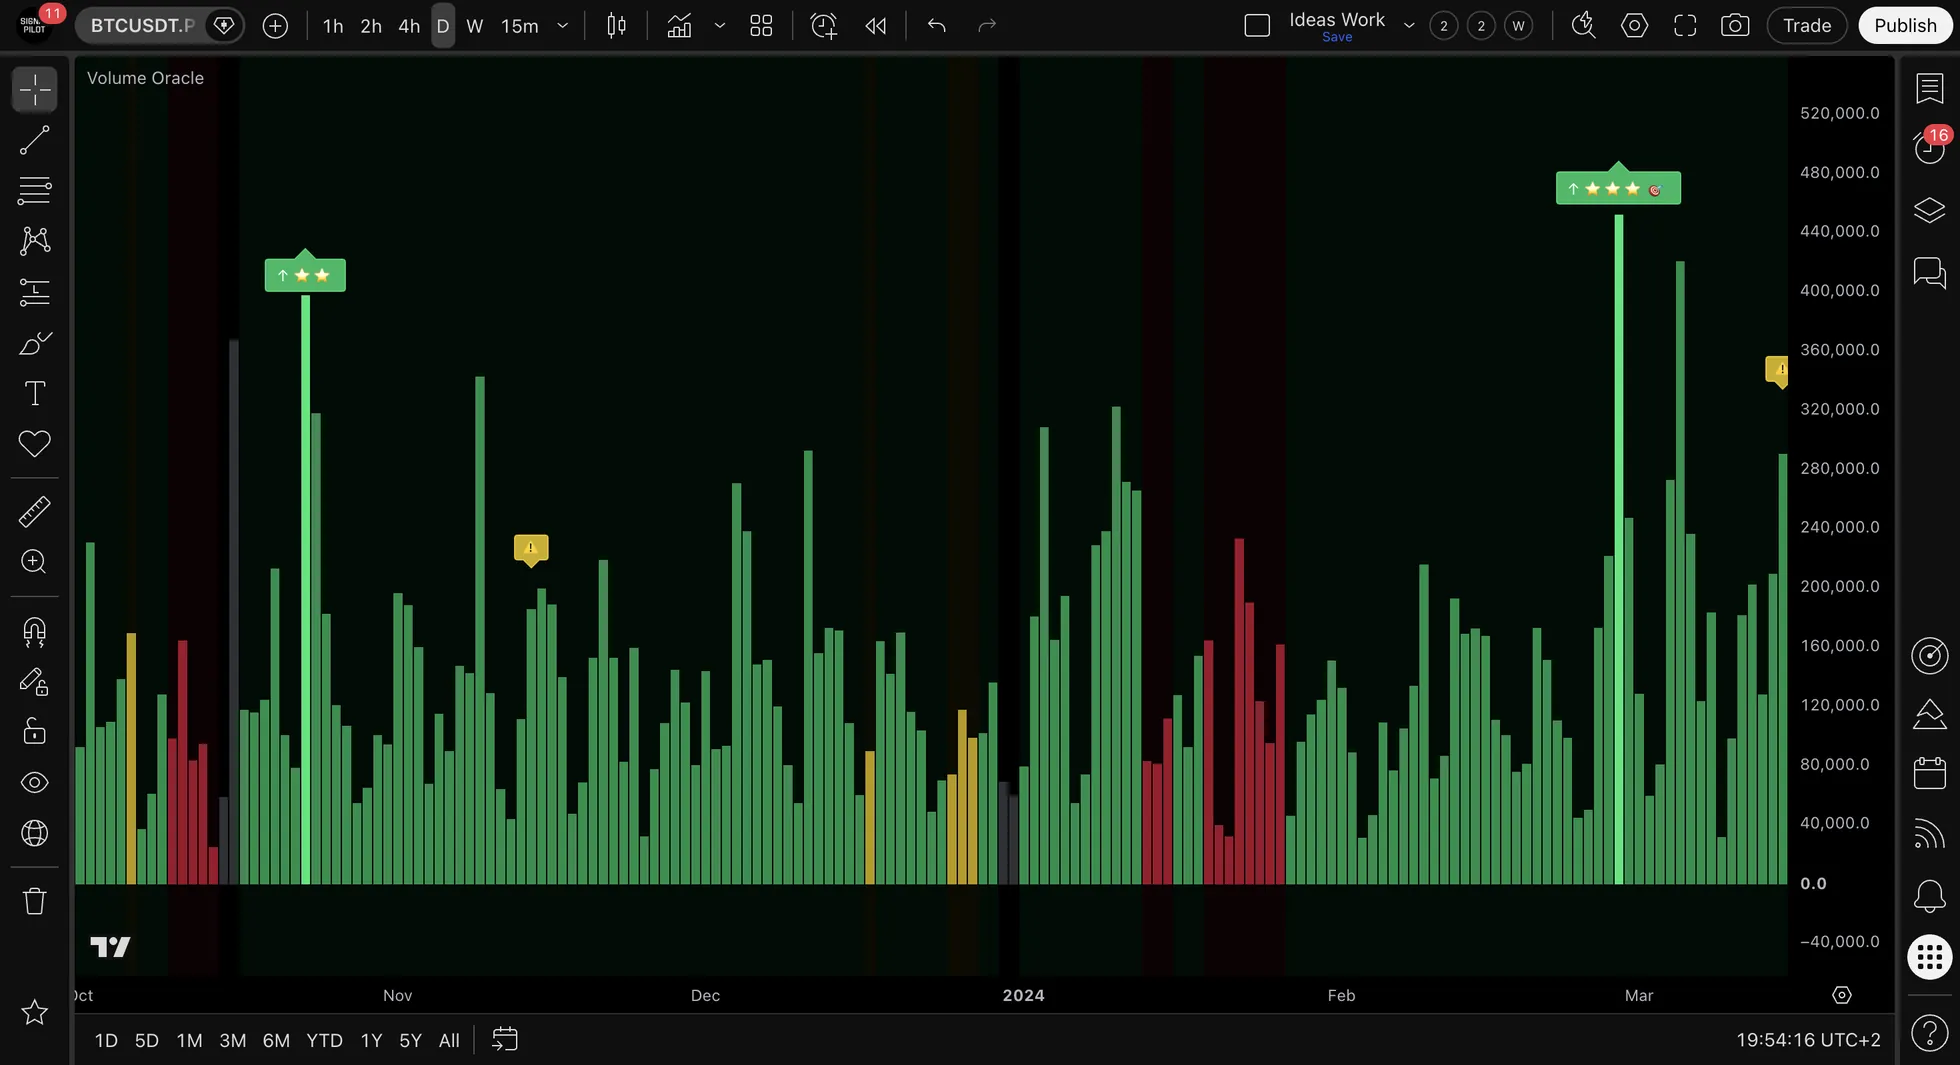
Not all signals are equal. Volume Oracle scores each signal 0-100% based on multiple factors:
Factors Considered:
- Volume significance relative to recent activity
- Flow direction alignment with signal
- Price trend confirmation
- Current regime strength
- Market structure agreement (HH/HL vs LH/LL patterns)
- Volume footprint type
- Multi-factor confluence
Dynamic Adjustments:
- Scores adjusted higher in trending markets
- Scores adjusted lower in choppy/ranging conditions
- Recent signal clustering reduces individual signal scores
How the score is banded:
| Rating | Score |
|---|---|
| ⭐ | 65 to 74 |
| ⭐⭐ | 75 to 84 |
| ⭐⭐⭐ | 85 and above |
Signal Generation
Signal Types:
- 🟢 BULL Event (↑) : Bullish conditions confirmed, accumulation phase detected
- 🔴 BEAR Event (↓) : Bearish conditions confirmed, distribution phase detected
Quality Ratings (⭐): Each signal receives a 0-100% quality score displayed as stars:
| Rating | Score | Meaning |
|---|---|---|
| ⭐⭐⭐ | 85 and above | The strongest agreement between factors |
| ⭐⭐ | 75 to 84 | Most factors lined up |
| ⭐ | 65 to 74 | Enough to show, no more |
| no star | under 65 | The signal still fires and is still drawn. It just earns no star. |
Quality Score Factors: Volume Z-score strength, flow consistency, trend alignment, regime strength
Risk Management
Auto-Calculated Levels:
- Position Size : Based on account size, risk %, and stop distance
- Stop Loss : ATR-based calculation (default: 1.5× ATR)
- Target 1 (T1) : First profit target (default: 2.0× ATR)
- Target 2 (T2) : Extended profit target (default: 3.5× ATR)
Position Sizing Formula: Position Size = Risk Amount ÷ Stop Distance
Example: $10,000 account × 1% risk = $100 risk. If stop is $50 away, position size = 2 units.
HTF Confirmation (Optional)
What It Does: Checks higher timeframes for regime alignment before firing signals.
HTF Table Display: Shows HTF1 and HTF2 regime state, strength %, and alignment status.
Benefit: Filters out signals that conflict with higher timeframe trend direction.
Strategy Modes
| Mode | Description | Best For |
|---|---|---|
| Trend Following | Events align with regime direction | Trending markets, momentum analysis |
| Mean Reversion | Events at regime extremes (fading) | Range-bound markets, contrarian analysis |
| Hybrid | Both signal types enabled at once | Mixed conditions, more signals of both kinds |
Timeframe Compatibility: Works on all timeframes. Signals confirm at bar close (non-repainting).
Remember: Signals fire only when multiple conditions align: a volume spike registered, flow consistency confirmed, the regime pointing the same way. The star band records how many of the scored factors were among them.
📊 The Regime Table
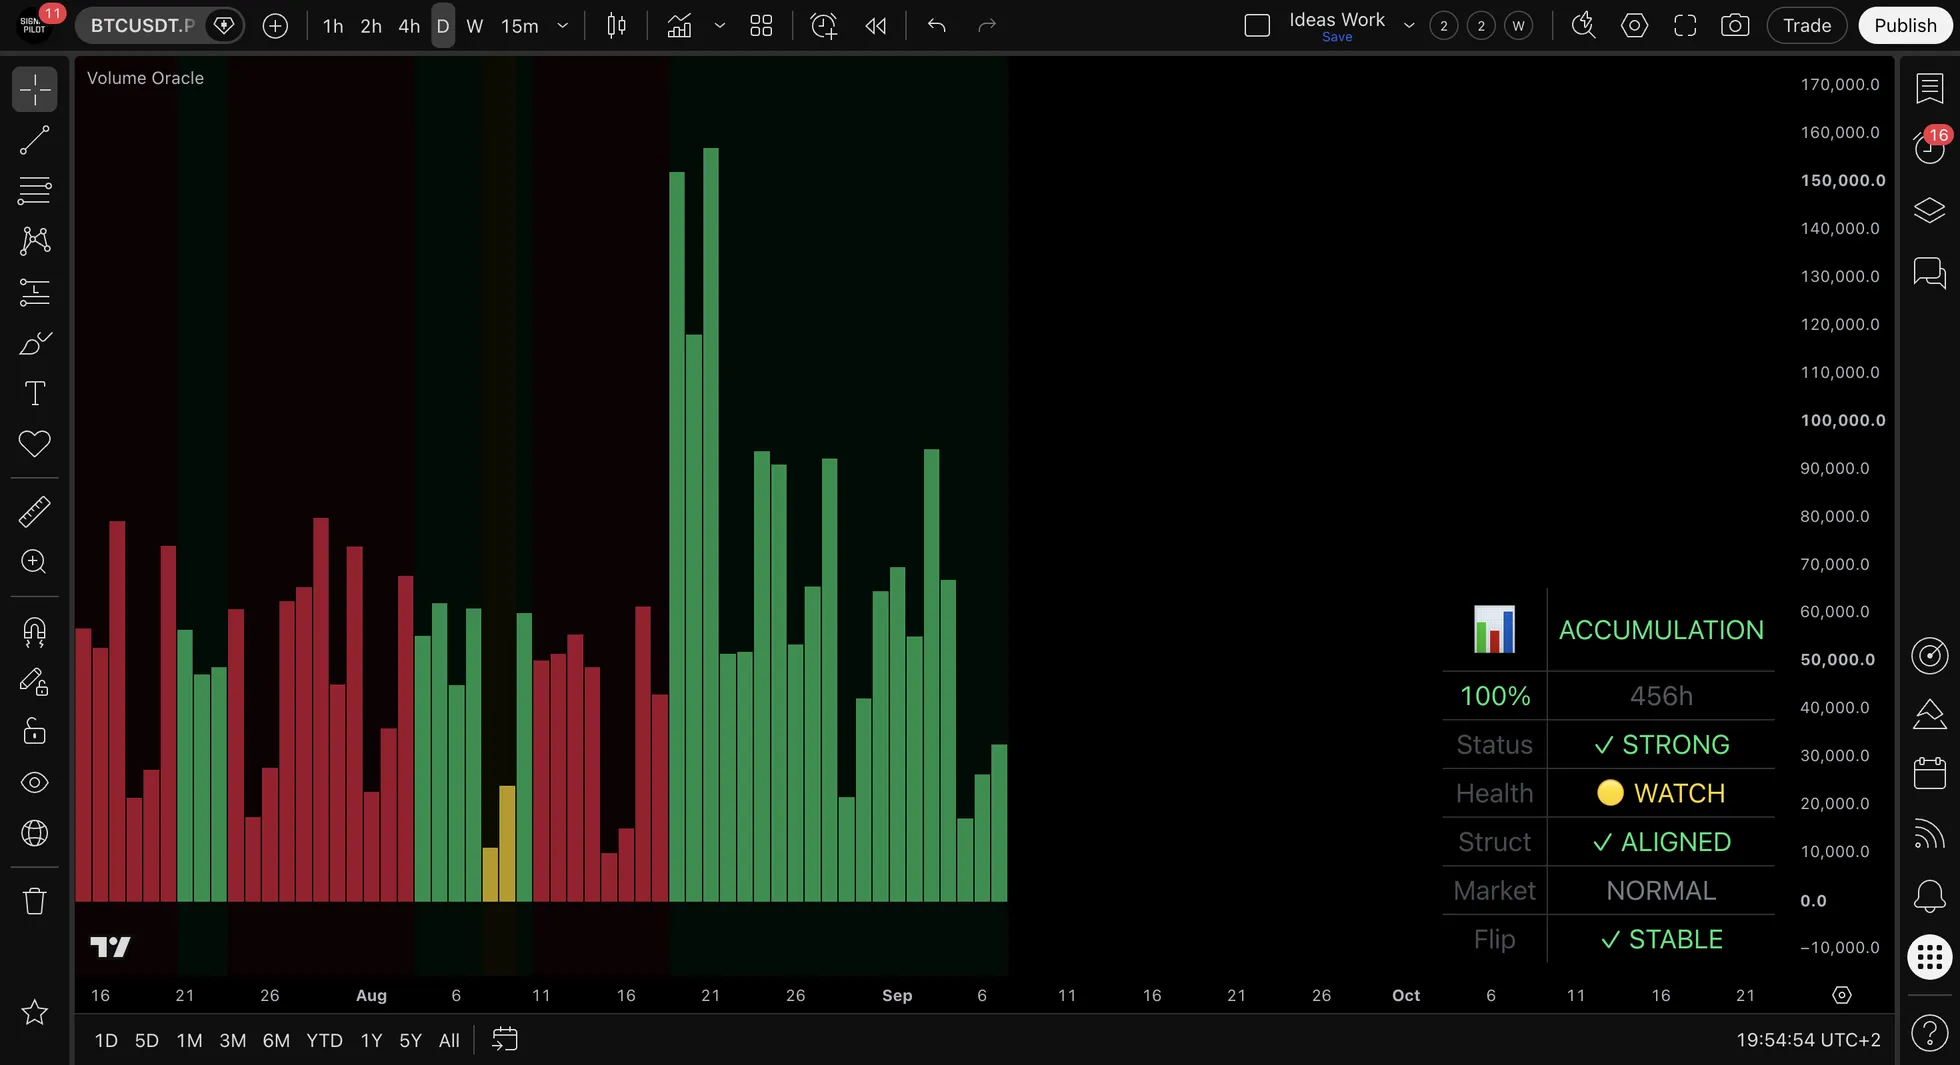
The regime table is your dashboard for regime status. Available in two layouts:
Vertical Layout (Default)
| Regime | ACCUMULATION |
| Strength | 66% |
| Duration | 32h |
| Status | ✓ STRONG |
| Health | ● HEALTHY |
| Structure | ✓ ALIGNED |
| Market | TRENDING |
| Flip | ✓ STABLE |
Horizontal Layout
| ACCUMULATION | 66% | 32h | STRONG ✓ | ● |
| STRUCTURE ✓ | MARKET TREND▲ |
FLIP STABLE |
0 flips |
Table Fields Explained
| Field | Values | Meaning |
|---|---|---|
| Regime | ACCUMULATION / DISTRIBUTION / NEUTRAL | Current volume flow direction |
| Strength | 0-100% | How dominant is the current regime |
| Duration | Hours (e.g., 32h) | How long regime has been active |
| Status | STRONG ✓ / FADING ▼ / WEAK ✗ / FLIP ⟲ | Regime health indicator |
| Health | 🟢 🟡 🟠 🔴 | How many warning flags are up: none, one, two, three or more |
| Structure | ✓ ALIGNED / ✗ CONFLICT / — UNCLEAR | Does price structure confirm regime? |
| Market | TRENDING ▲ / NORMAL — / CHOPPY ▼ | Market character based on flip frequency |
| Flip | STABLE ✓ / → ACC 2/3 / → DIST 1/3 | Is regime about to change? |
Reading the Table
Ideal Bullish Setup:
- Regime: ACCUMULATION
- Status: STRONG ✓
- Health: 🟢
- Structure: ✓ ALIGNED
- Market: TRENDING ▲
- Flip: STABLE ✓
Warning Signs:
- Status: FADING or WEAK → Regime losing strength
- Health: 🟠 or 🔴 → Multiple warning flags
- Structure: ✗ CONFLICT → Price disagrees with regime
- Market: CHOPPY → Unreliable signals
- Flip: → DIST 2/3 → About to flip bearish
📊 Backend Systems
Volume Oracle includes five intelligent backend systems that work automatically:
1. Market Structure Detection
Analyzes swing highs and lows to determine if price structure confirms or conflicts with the current regime.
| Structure | Meaning |
|---|---|
| BULLISH | Uptrend structure (higher highs/lows) |
| BEARISH | Downtrend structure (lower highs/lows) |
| MIXED | Transitioning between states |
| UNCLEAR | Ranging or choppy price action |
Impact: Signals receive quality bonus when structure aligns with regime direction, penalty when conflicting.
2. Volume Footprint Detection
Classifies volume bars by their characteristics to identify significant volume patterns:
| Type | Characteristics |
|---|---|
| MOMENTUM | High volume with strong directional conviction |
| ABSORPTION | High volume with price containment (supply/demand absorbed) |
| SPIKE | Elevated volume without clear directional signature |
| NORMAL | Typical volume activity |
Impact: Quality scoring adjusts based on footprint type alignment with signal direction.
3. Regime Stability Index
Tracks regime flip frequency over a rolling window to characterize market conditions:
| Character | Meaning |
|---|---|
| TRENDING | Stable regime, few recent flips |
| NORMAL | Moderate regime stability |
| CHOPPY | Frequent regime changes |
Impact: Signal quality expectations automatically adjust based on market character.
4. Confluence Scoring
Evaluates how many independent factors support each signal:
Factors Evaluated:
- Volume spike presence
- Flow direction match
- Structure agreement
- HTF alignment (if enabled)
- Footprint confirmation
- Market character
- Regime strength
Impact: Each factor that lines up adds to the score, and four or more together add a further bonus of 5 to 15 points.
5. Signal Density Tracking
Monitors signal frequency in recent bars to identify potentially choppy conditions.
Impact: When many signals cluster together, individual signal quality is reduced to reflect lower reliability in choppy markets.
⚙️ Settings
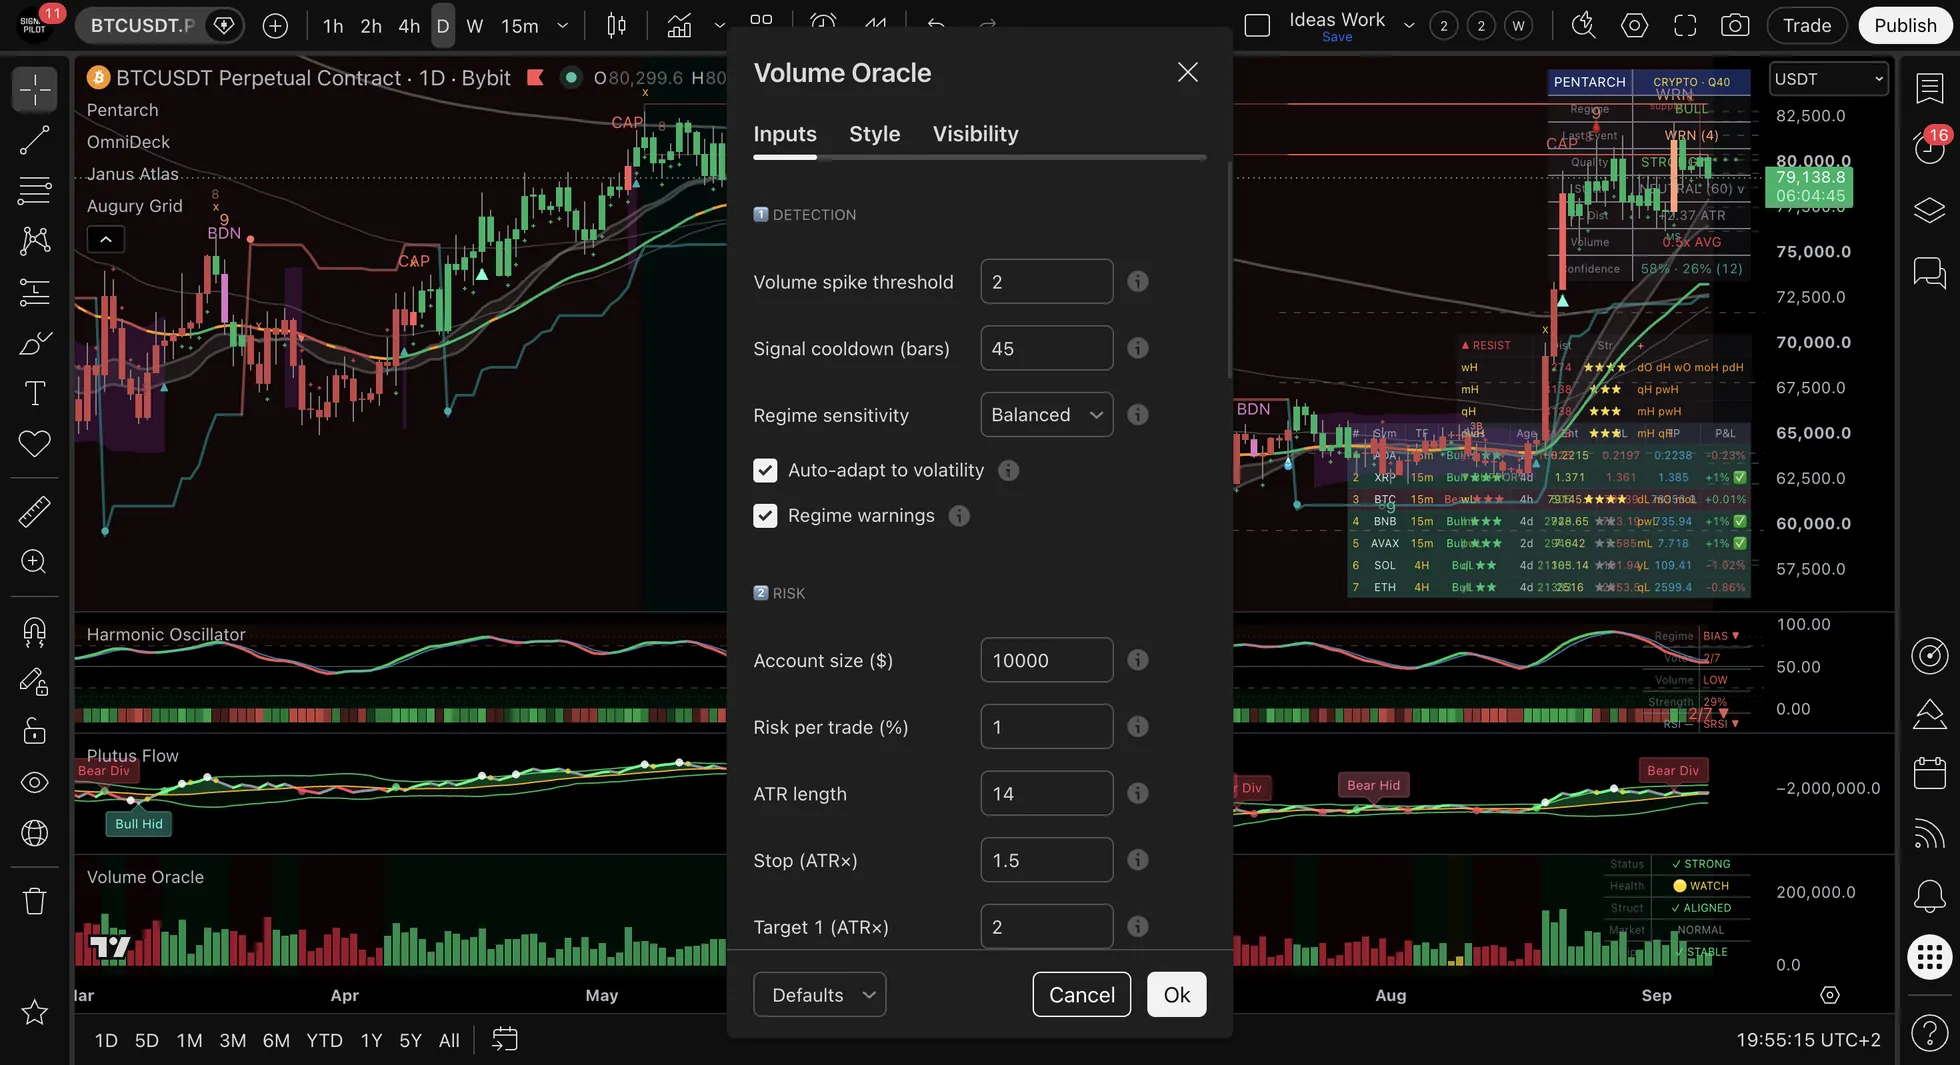
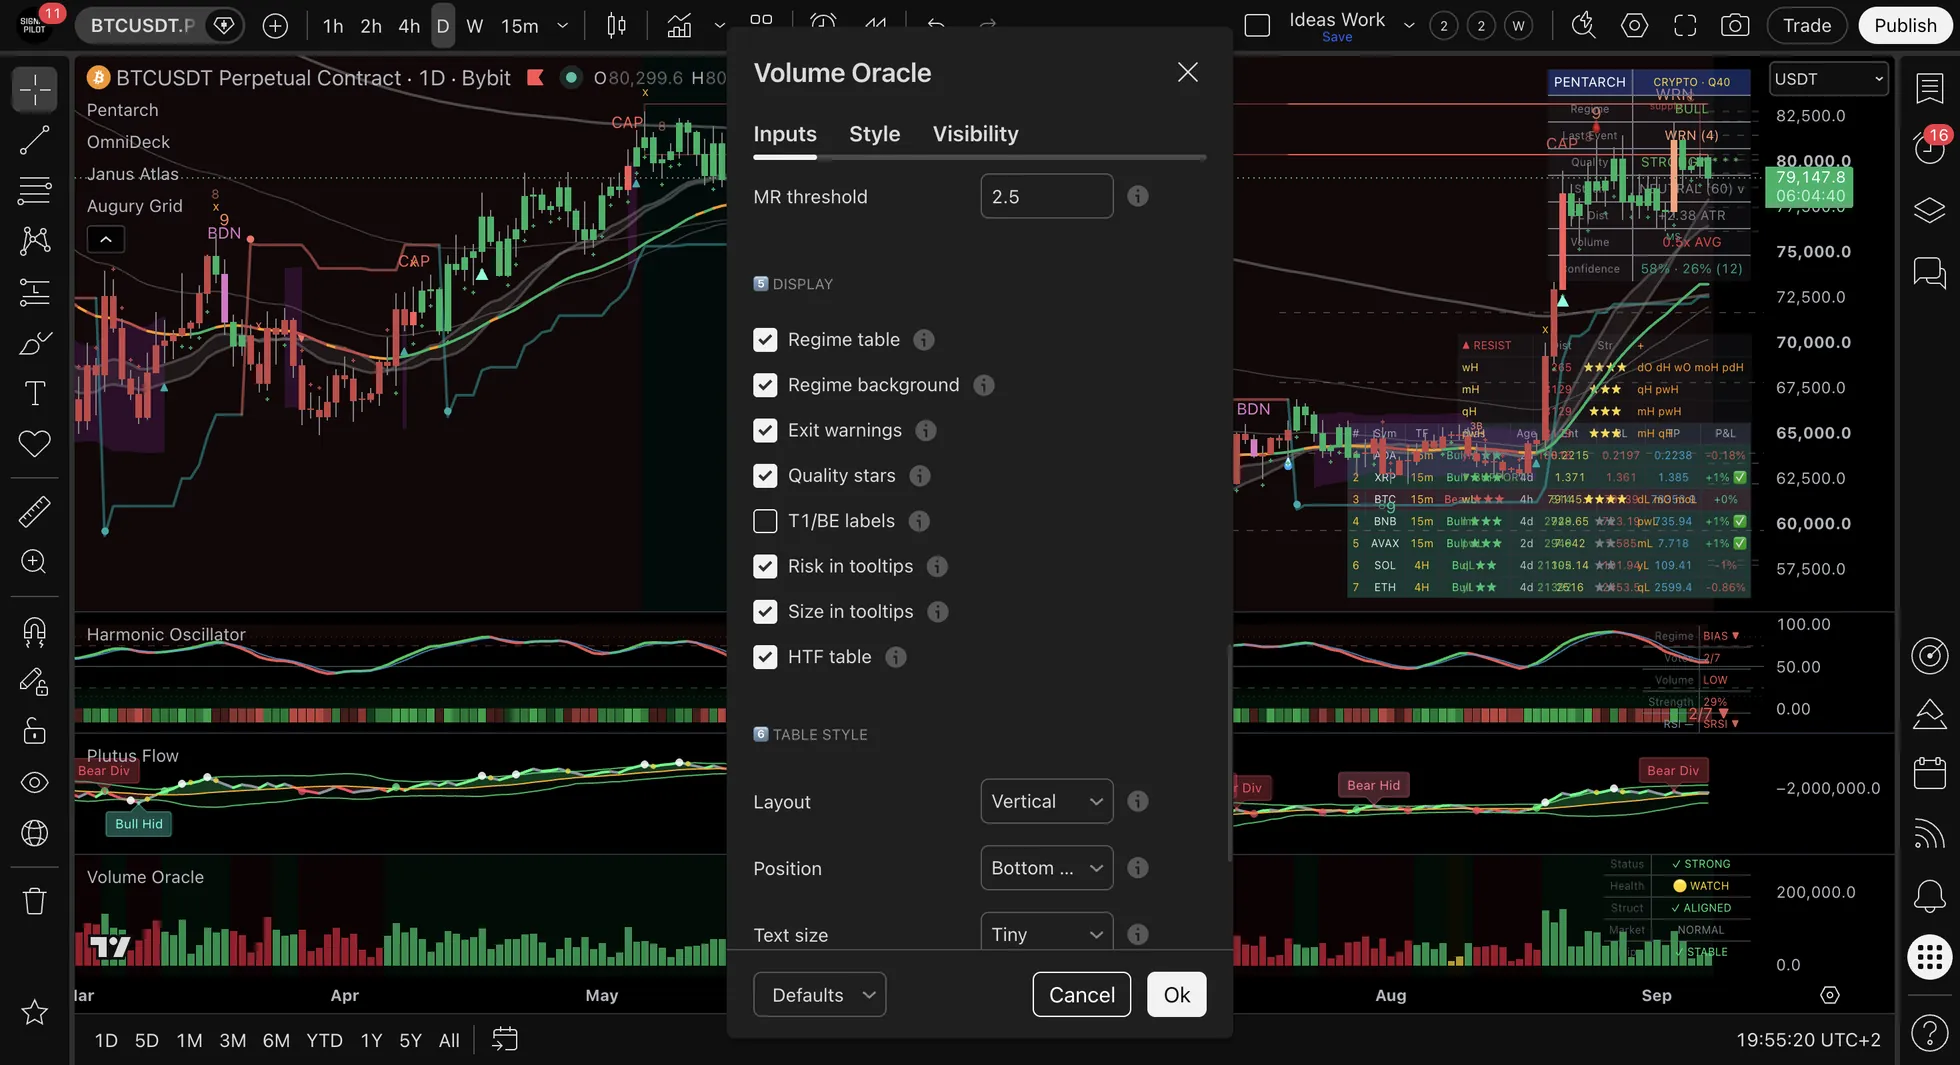
1️⃣ Detection
| Setting | Default | Description |
|---|---|---|
| Volume spike threshold | 2.0 | The z-score a bar's log volume must reach, measured over 100 bars. Raising it lets fewer bars through |
| Signal cooldown (bars) | 45 | Minimum bars between signals |
| Regime sensitivity | Balanced | Conservative/Balanced/Aggressive |
| Auto-adapt to volatility | ✓ On | Adjusts thresholds automatically |
| Regime warnings | ✓ On | Show early warning when regime weakening |
2️⃣ Risk
| Setting | Default | Description |
|---|---|---|
| Account size ($) | 10,000 | For position sizing calculation |
| Risk per trade (%) | 1.0 | % of account to risk |
| ATR length | 14 | For stop/target calculations |
| Stop (ATR×) | 1.5 | Stop loss distance |
| Target 1 (ATR×) | 2.0 | First profit target |
| Target 2 (ATR×) | 3.5 | Second profit target |
| Partial exit at T1 (%) | 50 | Position % to close at T1 |
| Trailing stop | ✓ On | Trail after T1 hit |
| Trailing (ATR×) | 1.0 | Trailing stop distance |
| Breakeven (ATR×) | 1.0 | Where the BE marker is placed, in ATR from entry |
3️⃣ Multi-Timeframe
| Setting | Default | Description |
|---|---|---|
| Enable HTF filter | Off | Require HTF alignment |
| HTF 1 | 60 (1H) | Primary higher timeframe |
| Enable HTF 2 | Off | Second HTF filter |
| HTF 2 | 240 (4H) | Secondary higher timeframe |
| Strict mode | ✓ On | Hide signals when HTF disagrees |
| Min HTF strength (%) | 40 | Required HTF regime strength |
4️⃣ Strategy
| Setting | Default | Description |
|---|---|---|
| Mode | Trend Following | Trend Following / Mean Reversion / Hybrid |
| Mean reversion signals | Off | Show counter-trend signals at extremes |
| MR threshold | 2.5 | How extreme for MR signal |
5️⃣ Display
| Setting | Default | Description |
|---|---|---|
| Regime table | ✓ On | Show regime dashboard |
| Regime background | ✓ On | Tint chart background |
| Exit warnings | ✓ On | Show ⚠️ labels |
| Quality stars | ✓ On | Show ⭐ on signals |
| T1/BE labels | Off | Show management labels (clutters chart) |
| Risk in tooltips | ✓ On | Show stop/targets in tooltips |
| Size in tooltips | ✓ On | Show position size in tooltips |
| HTF table | ✓ On | Show HTF panel when enabled |
6️⃣ Table Style
| Setting | Default | Description |
|---|---|---|
| Layout | Vertical | Horizontal or Vertical |
| Position | Bottom Right | 9 position options |
| Text size | Tiny | Tiny/Small/Normal/Large |
| Transparency | 85 | 0=solid, 100=invisible |
| Border | 1 | Border width 0-3 |
| Frame | 0 | Outer frame 0-3 |
| HTF position | Bottom Center | HTF table position |
| HTF text size | Tiny | HTF table text size |
🔔 Alerts (25 in total)
Entry Alerts
| Alert | Fires When |
|---|---|
| 🟢 BULL Signal | Bullish flow signal generated |
| 🔴 BEAR Signal | Bearish flow signal generated |
| ⚡ ANY Signal | Either direction signal |
Position Alerts
| Alert | Fires When |
|---|---|
| 🎯 Target 1 Hit | Price reaches T1 |
| 🔒 Breakeven | Stop moved to entry |
| ⚠️ Exit Warning | Any exit condition triggered |
Regime Alerts
| Alert | Fires When |
|---|---|
| 📈 Regime → Accumulation | Regime flips bullish |
| 📉 Regime → Distribution | Regime flips bearish |
| ⚖️ Regime → Neutral | Regime becomes neutral |
| 🔄 Any Regime Change | Any regime flip |
| ⚡ Regime Weakening | Regime losing strength |
| 📉 Momentum Fading | Momentum losing strength inside the regime |
| 📉 Flow Deteriorating | Flow turning against the regime |
| 📉 Volume Drying Up | Participation falling away |
| 🟠 Multiple Warnings | More than one of the warnings above active at once |
Structure Alerts (NEW)
| Alert | Fires When |
|---|---|
| 📊 Structure Bullish | HH/HL pattern detected |
| 📊 Structure Bearish | LH/LL pattern detected |
| ⚠️ Structure Conflict | Structure disagrees with regime |
Footprint Alerts (NEW)
| Alert | Fires When |
|---|---|
| 🔥 Momentum Footprint | Strong directional momentum detected |
| 🛡️ Absorption Footprint | Supply/demand absorption detected |
Market Alerts (NEW)
| Alert | Fires When |
|---|---|
| 📈 Market Trending | Low flip frequency detected |
| 📉 Market Choppy | High flip frequency detected |
Confluence Alert (NEW)
| Alert | Fires When |
|---|---|
| 🎯 High Confluence Signal | 5+ factors align on signal |
HTF Alerts
| Alert | Fires When |
|---|---|
| ✅ HTF Aligned | All timeframes agree |
| ❌ HTF Broke | Alignment lost |
Alert Message Format
Events include full analysis data:
🟢 BULLISH FLOW | BTCUSD 15m
Quality: 88% ⭐⭐⭐ | Regime: 67%
Entry: 94,000 | Stop: 92,800
T1: 95,600 | T2: 96,800
Size: 0.083 BTC | Risk: $100
Structure: ✓ ALIGNED | Market: TRENDING
📖 How to Use
Step 1: Check Regime State
Before any trade, look at the regime table:
| Regime | Bias | What it reports |
|---|---|---|
| ACCUMULATION + STRONG | Bullish | Bullish events favored |
| DISTRIBUTION + STRONG | Bearish | Bearish events favored |
| NEUTRAL | None | No direction detected |
| Any + FADING/WEAK | Caution | The regime in place is losing strength |
Step 2: Validate with Structure
Check if price structure confirms regime:
| Structure | Regime | What it reports |
|---|---|---|
| ✓ ALIGNED | Any | Structure and regime agree |
| — UNCLEAR | Any | Structure gives no reading either way |
| ✗ CONFLICT | Any | Structure and regime disagree |
Step 3: Consider Market Character
| Market | What the reading means |
|---|---|
| TRENDING | Directional persistence detected in the volume series |
| NORMAL | Neither persistence nor unusual reversion detected |
| CHOPPY | Frequent direction changes, so the regime reading is less stable |
Step 4: Wait for Signal
When ↑ or ↓ signal appears:
- Check star rating (prefer ⭐⭐ or ⭐⭐⭐)
- Hover for tooltip (stop, targets, size)
- Verify regime still supports direction
- Enter if all factors align
Step 5: Manage Position
| Label | Meaning | What the marker records |
|---|---|---|
| T1 | Target 1 hit | Price reached the first computed target |
| BE | Breakeven level | Price reached the entry price again |
| ⚠️ | Exit warning | The regime meter raised a warning |
🔗 Integration with Other Indicators
While Volume Oracle reports a regime and generates signals on its own, reading it alongside the other Signal Pilot indicators gives a reading more than one source. Here is how they are commonly read together:
Volume Oracle + Pentarch (Regime + Timing)
Workflow:
- Pentarch event fires → TD, IGN, CAP, or WRN event appears on chart
- Check Volume Oracle regime → Is the regime aligned with the Pentarch event direction?
- Pentarch + Accumulation regime = validated bullish → Regime confirms volume support for reversal
- Pentarch + conflicting regime = proceed with caution → Signal without regime support may lack follow-through
- Expected outcome: Volume Oracle regime validates which Pentarch events have volume confirmation
Example: Pentarch TD event fires → Volume Oracle shows Accumulation regime (green, 75%) = confirmed bullish reversal with accumulation flow
Volume Oracle + Janus Atlas (Regime at Levels)
Workflow:
- Price approaches a key level drawn by Janus Atlas → Daily High/Low, Weekly levels, POC, VWAP, or Fibonacci levels
- Check Volume Oracle regime at level → What is the regime showing when price tests the level?
- Regime alignment at level = significance confirmed:
- Accumulation regime + support level = strong bounce potential
- Distribution regime + resistance level = strong rejection potential
- Expected outcome: Volume Oracle regime shows whether the levels drawn by Janus Atlas have volume confirmation
Example: Price hits Daily Low + Weekly Low confluence → Volume Oracle shows Accumulation regime (green, 72%) → price bounces = confirmed support zone with accumulation
Volume Oracle + Harmonic Oscillator (Regime + Momentum)
Workflow:
- Harmonic Oscillator shows momentum shift → a bearish regime turning bullish, or a TRENDING▲ label appearing
- Check Volume Oracle regime → Is the regime aligned with the momentum direction?
- Regime and momentum agreeing = two sources, not one:
- Bull momentum + Accumulation regime = confirmed bullish momentum
- Bear momentum + Distribution regime = confirmed bearish momentum
- Conflicting regime = lower confluence → May lack volume participation, lower confidence
Example: Harmonic Oscillator prints TRENDING▲ on 7 of 7 votes → Volume Oracle shows Accumulation regime (green, 80%) = maximum bullish confluence (momentum + regime)
Volume Oracle + OmniDeck (Regime at Exhaustion Counter)
Workflow:
- OmniDeck Exhaustion Counter completes its count → the number 9 appears (buy or sell count completion)
- Check Volume Oracle regime at completion → What regime is showing at the exhaustion point?
- Exhaustion Counter + aligned regime = validated exhaustion:
- EC buy completion + Accumulation regime = bullish reversal confirmed
- EC sell completion + Distribution regime = bearish reversal confirmed
- Expected outcome: Volume Oracle regime tells a real Exhaustion Counter completion from a false one
Example: OmniDeck Exhaustion Counter completes a sell count, printing the number 9 above the bar → Volume Oracle shows a Distribution regime (red, 78%): two instruments describing the same bar
Pro Tip: The Regime Confirmation Workflow
For highest-confluence setups, use Volume Oracle as the regime confirmation layer. Workflow: Janus Atlas (identify level) → Pentarch (timing event) → Volume Oracle (regime confirmation). Price at key level + timing event + aligned regime = triple-confluence setup with volume validation. Always ask: "Is the regime supporting this setup?"
See also: Analysis Workflow Guide for detailed multi-indicator approaches.
📊 Volume Oracle vs Plutus Flow : Which One?
Volume Oracle and Plutus Flow analyze volume differently. Here's how to choose:
Quick Comparison Table
| Feature | Volume Oracle v1.0 | Plutus Flow v1.0 |
|---|---|---|
| Primary Focus | Regime detection + signal generation | Cumulative volume trend analysis (OBV-based) |
| Best For | Intraday analysis, event detection with risk analysis | Multi-day analysis, trend following, divergence detection |
| Timeframe | 5m, 15m, 1H (intraday timeframes) | 1H, 4H, Daily, Weekly (higher timeframes) |
| Key Signal | BULL/BEAR signals with quality ratings | Bullish/Bearish divergence (price vs OBV) |
| Trend Type | Regime-based (Accumulation/Distribution) | Long-term money flow direction |
| Volume Analysis | Regime-based (market phase detection) | Cumulative (running total of volume) |
| Works Best In | All market conditions (including ranging) | Trending markets (uptrends/downtrends) |
| Unique Feature | Auto risk management (Entry/Stop/Targets) | OBV trend ribbons (show trend strength) |
✅ Use Volume Oracle When:
- You're doing intraday analysis (analyzing shorter timeframes)
- You want regime-based context (align with Accumulation/Distribution phases)
- You want the score banded on the chart (⭐⭐⭐ from 85, ⭐⭐ from 75, ⭐ from 65)
- You want automatic risk levels (Entry, Stop, T1, T2 calculated for you)
- You use HTF confirmation (ensure higher timeframe agrees)
Example Volume Oracle Setup: S&P 500 15-minute chart, waiting for BULL event with ⭐⭐⭐ quality during Accumulation regime.
✅ Use Plutus Flow When:
- You're doing multi-day analysis (analyzing over days/weeks)
- You want to track long-term money flow (is money flowing in or out over time?)
- You analyze divergences (price makes new low, but OBV makes higher low = accumulation)
- You focus on higher timeframes (Daily, Weekly charts)
- You want trend confirmation (ribbon width shows trend strength)
Example Plutus Flow Setup: Bitcoin Daily chart, looking for bullish OBV divergence to identify potential reversals.
🔥 Use Both Together (Advanced)
Combine Volume Oracle (tactical) with Plutus Flow (strategic) for maximum effectiveness:
- Plutus Flow → Identifies long-term trend direction (OBV rising = bullish bias)
- Volume Oracle → Finds tactical confluence points (BULL event during Accumulation regime)
Example Combined Workflow:
- Check Daily Plutus Flow: OBV trending up (bullish long-term)
- Drop to 15m chart with Volume Oracle: Wait for BULL ⭐⭐⭐ event during Accumulation regime
- Both align: Long-term bullish flow + regime-confirmed event = high-confluence setup
💡 Pro Tip: Choose Based on Your Analysis Style
Intraday analysis: Volume Oracle is your primary volume tool. Add Plutus Flow optionally for daily bias.
Multi-day analysis: Plutus Flow is your primary volume tool. Add Volume Oracle optionally for confirmation.
Position analysis: Plutus Flow on Weekly/Monthly charts for long-term trend direction.
See also: Plutus Flow Documentation for comparison from the other perspective.
⚠️ Common Mistakes
Mistake #1: Acting Against Regime
Missed: reading a bullish event in a DISTRIBUTION regime as though the regime agreed
Read: the event and the regime disagree, and both are on screen
Mistake #2: Ignoring Structure Conflicts
Missed: reading a signal as though nothing disagreed, when Structure shows ✗ CONFLICT
Read: the structure and the regime disagree, so the reading has one source rather than two
Mistake #3: Expecting Results in CHOPPY Markets
Missed: reading a CHOPPY market the same way as a TRENDING one
Read: CHOPPY is the market character the indicator detected, and it is printed before anything happens
Mistake #4: Reading Every Band the Same Way
Missed: reading every ⭐ event as though it were a ⭐⭐⭐
Read: the star band is the score put into bands, and it is printed next to the signal
Mistake #5: Ignoring Early Warnings
Missed: leaving a reading unchanged when Status shows FADING
Read: FADING is the meter revising itself, so the reading it was built on has changed
🌫️ When This Doesn't Work Well
Low Volume Sessions
Holiday trading, overnight sessions: regime detection less reliable when volume baseline is low.
Major News Events
Fed announcements, earnings: regime can flip multiple times in minutes. Wait for stabilization.
Choppy/Ranging Markets
When the Market row reads CHOPPY often, the regime input the scoring leans on is itself unsettled, and the scores reflect that.
Very Low Timeframes
On 1m and 3m charts the volume z-score is computed over 100 very short bars, so more signals clear the threshold and fewer of them reach the upper bands. The scoring rests on steadier inputs from 5m upward.
❓ FAQ
Q: Does this repaint?
A: No. All signals fire on bar close only. Historical signals match live behavior.
Q: What timeframes work best?
A: 5m to Daily. The indicator auto-adapts parameters to each timeframe.
Q: Should I use HTF filter?
A: Optional. The filter drops signals whose higher-timeframe regime disagrees, so fewer print and the ones that do carry that agreement. Read the chart both ways to see the difference.
Q: Where do the star bands fall?
A: At 65, 75 and 85 on the 0-100 score. A signal scoring under 65 still fires and is still drawn; it just carries no star.
Q: How do I know when to exit?
A: Watch for ⚠️ exit warnings, Status turning FADING/WEAK, or Structure conflict.
✅ Knowledge Check
Question: How many main systems make up Volume Oracle?
📋 Quick Reference
Regime States
| Regime | Color | Bias |
|---|---|---|
| ACCUMULATION | Green | Bullish |
| DISTRIBUTION | Red | Bearish |
| NEUTRAL | Gray | None |
Status Meanings
| Status | Meaning |
|---|---|
| STRONG ✓ | Regime healthy |
| FADING ▼ | Early warning |
| WEAK ✗ | Exit soon |
| FLIP ⟲ | Regime changing |
Health Icons
| Icon | Flags | Meaning |
|---|---|---|
| 🟢 | No flags | None of the four raised |
| 🟡 | One flag | Watch it |
| 🟠 | Two flags | Weakening |
| 🔴 | Three or more | All but one of the four raised |
Quality Stars
| Stars | Score | Action |
|---|---|---|
| ⭐⭐⭐ | 85 and above | The suggested size in the tooltip is multiplied by 1.5 |
| ⭐⭐ | 75 to 84 | Multiplied by 1.2 |
| ⭐ | 65 to 74 | Left as calculated |
| no star | under 65 | Multiplied by 0.7 |
Market Character
| Character | Meaning |
|---|---|
| TRENDING | Hold winners longer |
| NORMAL | Standard management |
| CHOPPY | Signals resolve quickly in both directions |
📞 Support
Technical Questions: support@signalpilot.io
Deepen your understanding with these articles from the Signal Pilot Blog:
Learn to identify accumulation and distribution phases
Volume Profile BasicsMaster the fundamentals of volume-at-price analysis
Volume Flow AnalysisFollow volume footprints through the market
💬 Need Help?
Have questions about Volume Oracle? Join our Discord community to get help from experienced users, share setups, and discuss approaches!
See Also
Related Pages:
- OmniDeck v1.0 - Ten systems on one chart, read alongside Volume Oracle rather than in place of it
- Plutus Flow v1.0 - Advanced OBV for volume flow analysis
- Volume Oracle Quick Reference - One-page signal cheatsheet
- How to Set Up Alerts - Get notified on volume signals
- Analysis Workflow - How volume analysis fits into complete system
Disclaimer: Volume Oracle uses a Regime State Machine (ACCUMULATION, DISTRIBUTION, NEUTRAL) powered by five backend systems: Market Structure Detection, Volume Footprint Detection, Regime Stability Index, Confluence Scoring, and Signal Density Tracking. All analyses represent historical volume data interpretation. Risk levels are calculated automatically but exclude fees, commissions, and slippage. Individual interpretation, application, and outcomes vary. Past performance does not guarantee future results. This is not financial advice.