Harmonic Oscillator - Multi-Component Momentum
One momentum line instead of three, and a council of seven checks that vote on the direction. The Harmonic Oscillator shows how strong the push is, when it's stretched, and how much of the evidence points the same way: a count instead of a feeling.
 Watch it explainedOn our YouTube channel: every part shown on real charts, in TradingView Bar Replay.9:23
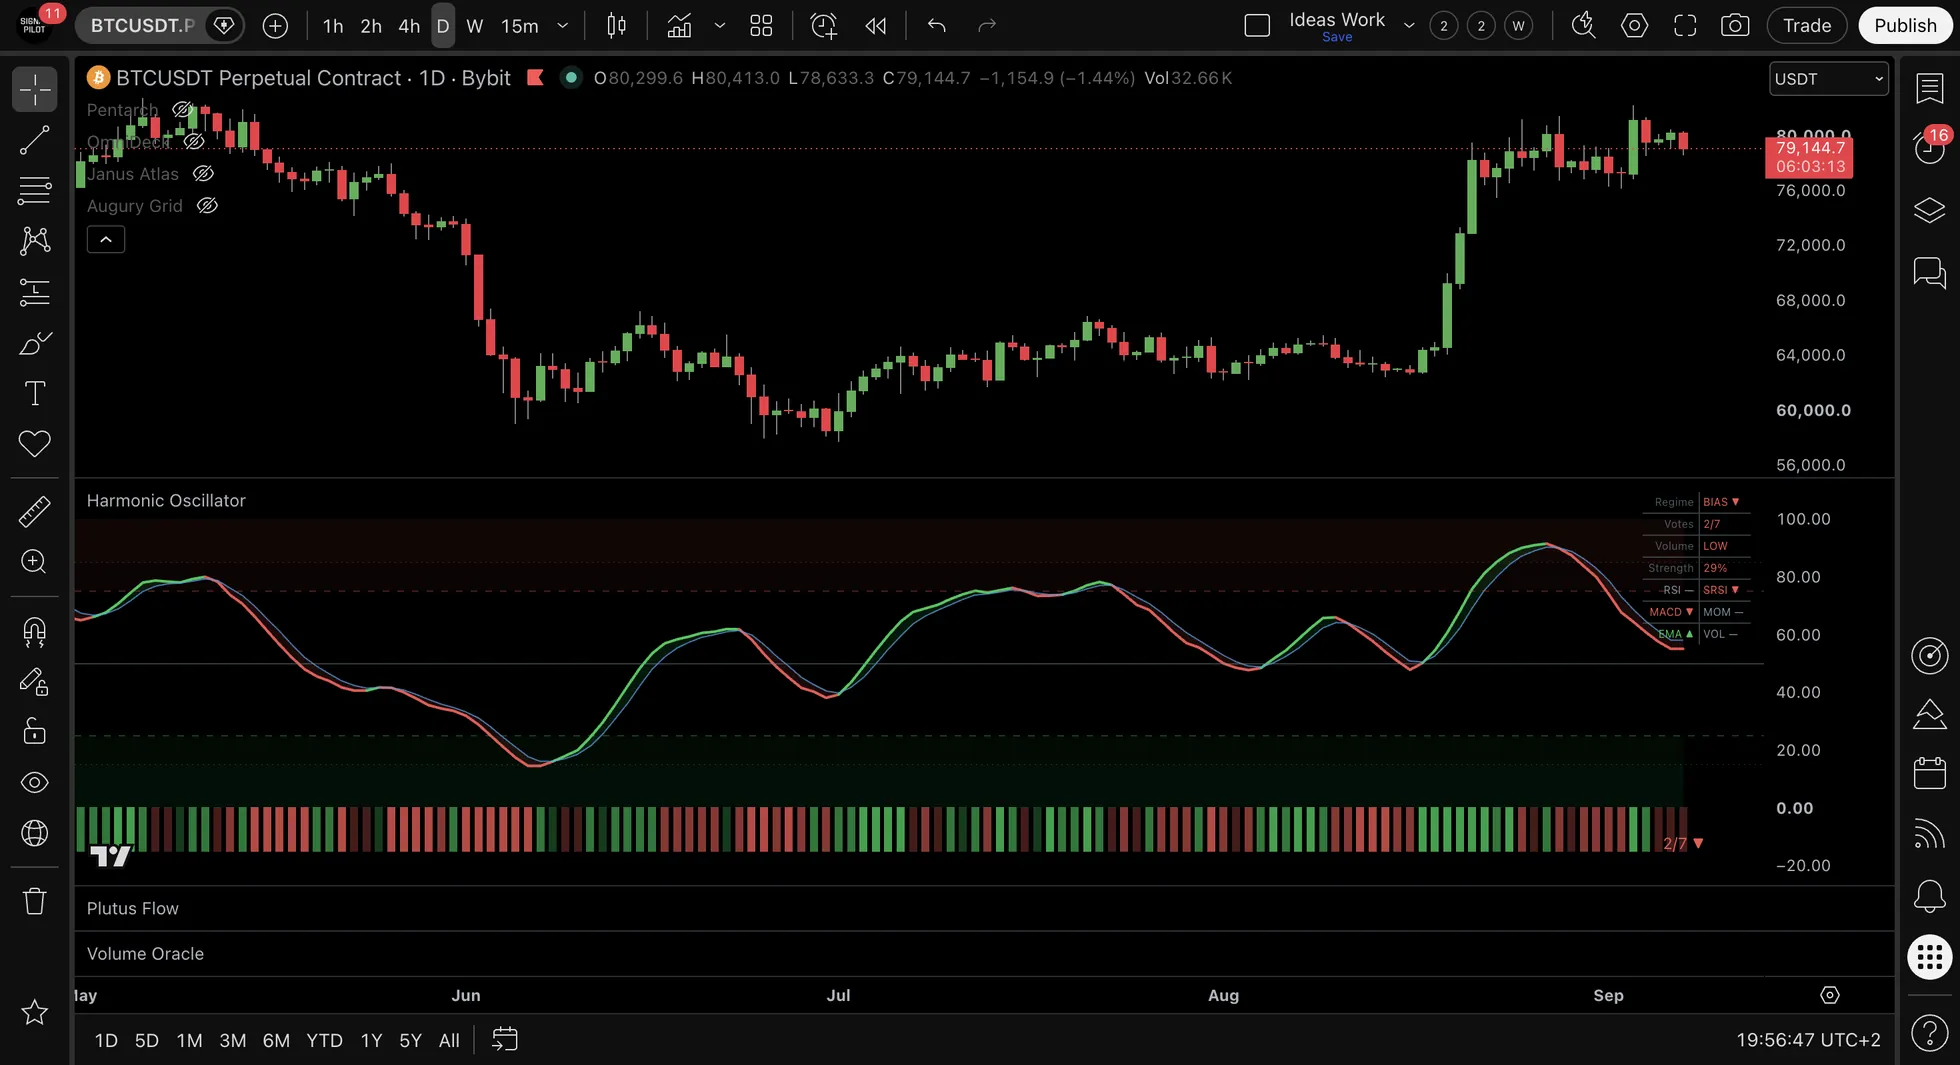
What you see
| In the pane | What it means |
|---|---|
| The thick line | The composite: Harmonic's one momentum line, 0 to 100 |
| The thin line | A short average of the composite. The composite is green above it, red below |
| Red fill at the top | Overbought: above 75 (extreme above 85) |
| Green fill at the bottom | Oversold: below 25 (extreme below 15) |
| The bar along the bottom | The vote count: which side has more of the seven votes, bright at five or more |
| ▲ DIV · ▼ DIV | A divergence: price and momentum disagreeing at an extreme |
| The panel | The regime, the votes, volume, strength and each check's arrow |
The seven votes
Each check votes up, down or not at all.
| Vote | Listens to |
|---|---|
| MACD | The push: building or fading |
| RSI | The balance of buying and selling |
| Stochastic RSI | The short swing |
| Trend | The bigger direction |
| Momentum | The speed of the move |
| Volume | The busy candles |
| The turn | A stretched swing that has started to turn |
The events
| Event | What it is |
|---|---|
| Crossover | The composite crossing its average line, up or down |
| Entering an extreme | The line moving above 85 or below 15 |
| Leaving an extreme | The line coming back out: often the moment a push starts to fade |
| Divergence | A new high in price with a lower high in the line, up in the overbought zone (▼ DIV), or the mirror at a low (▲ DIV). Confirmed three bars later and drawn where it happened |
| High consensus | Five or more votes on one side (four in Aggressive mode, six in Conservative) |
| Regime change | The panel's regime turning bullish or bearish |
By default a divergence only counts when the bigger trend on the 4-hour chart agrees with it.
The panel
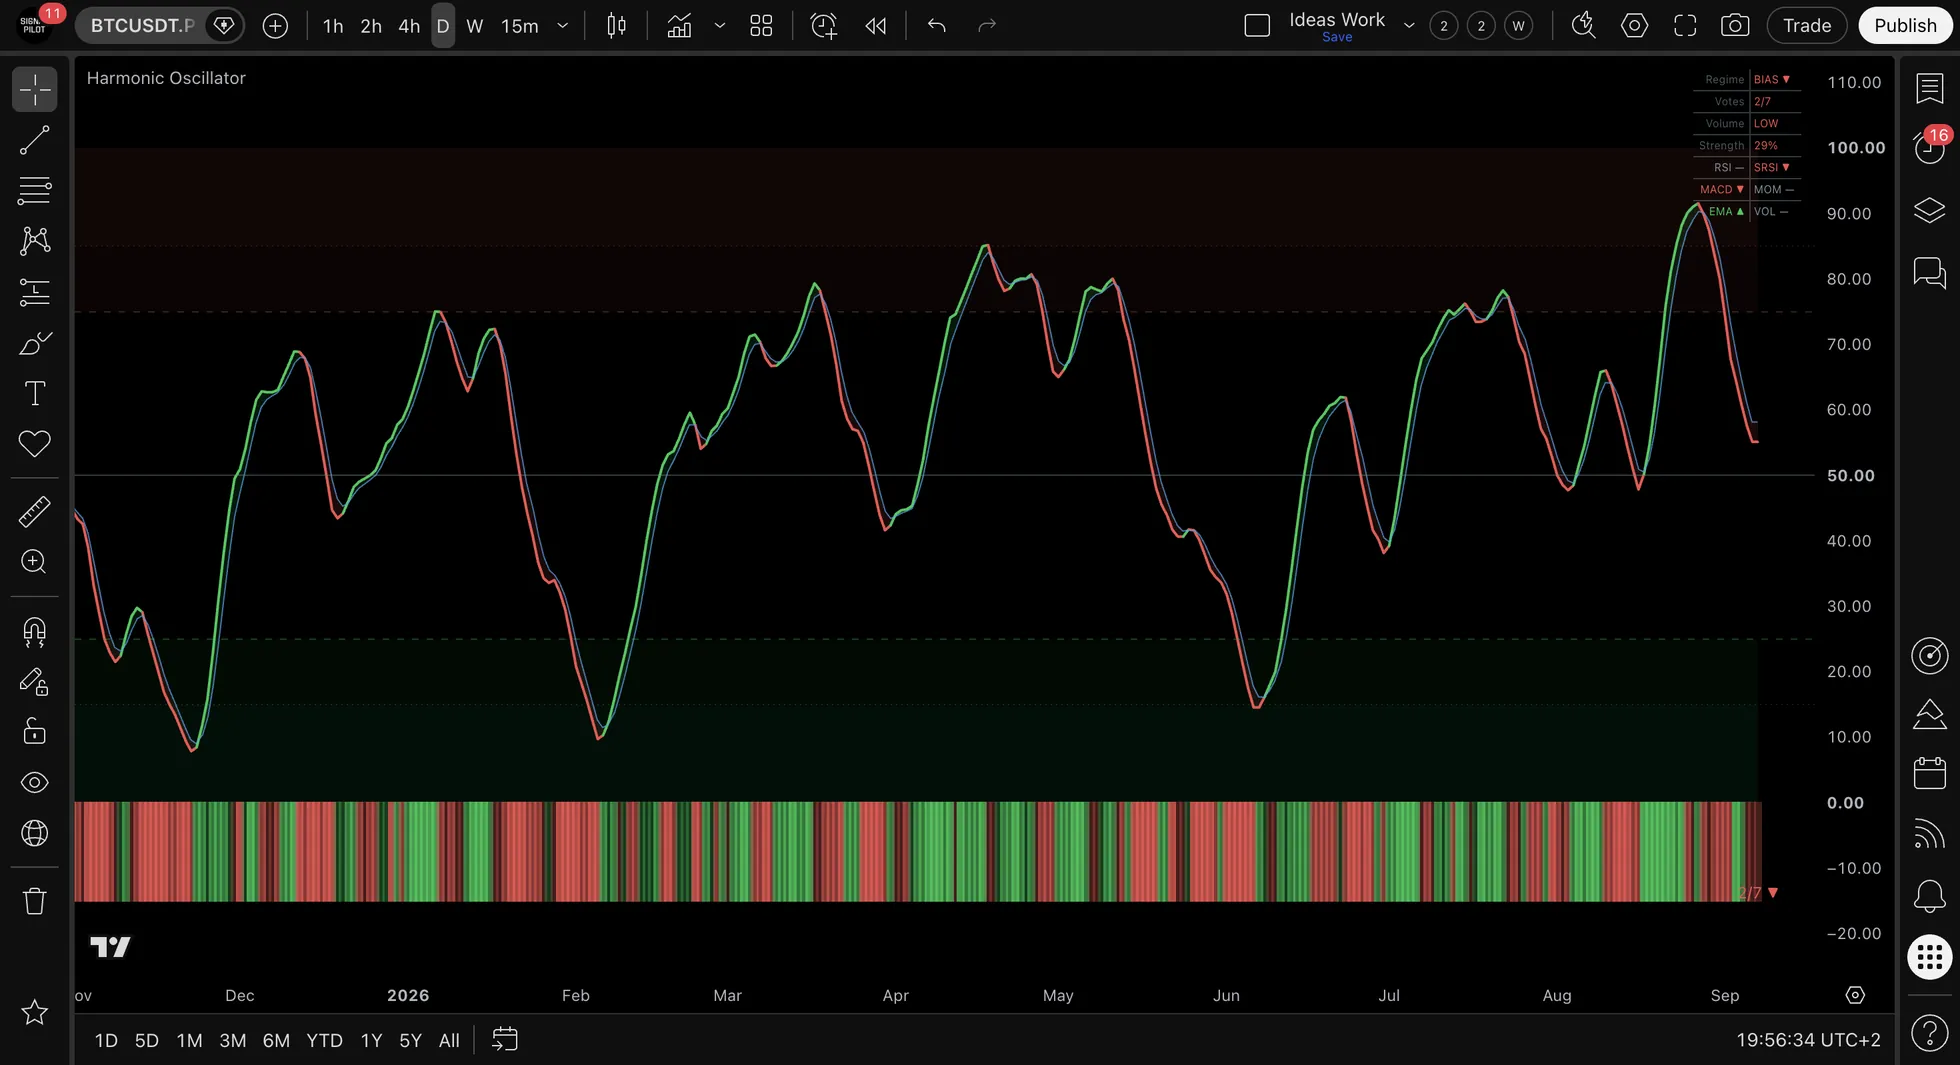
| Row | Reads |
|---|---|
| Regime | TRENDING, BIAS or RANGING, with the direction |
| Votes | How many of the seven agree, like 5/7 |
| Volume | HIGH, OK or LOW against the average |
| Strength | The votes as a percentage |
| RSI · SRSI · MACD · MOM · EMA · VOL | Each check's own arrow |
Settings that matter
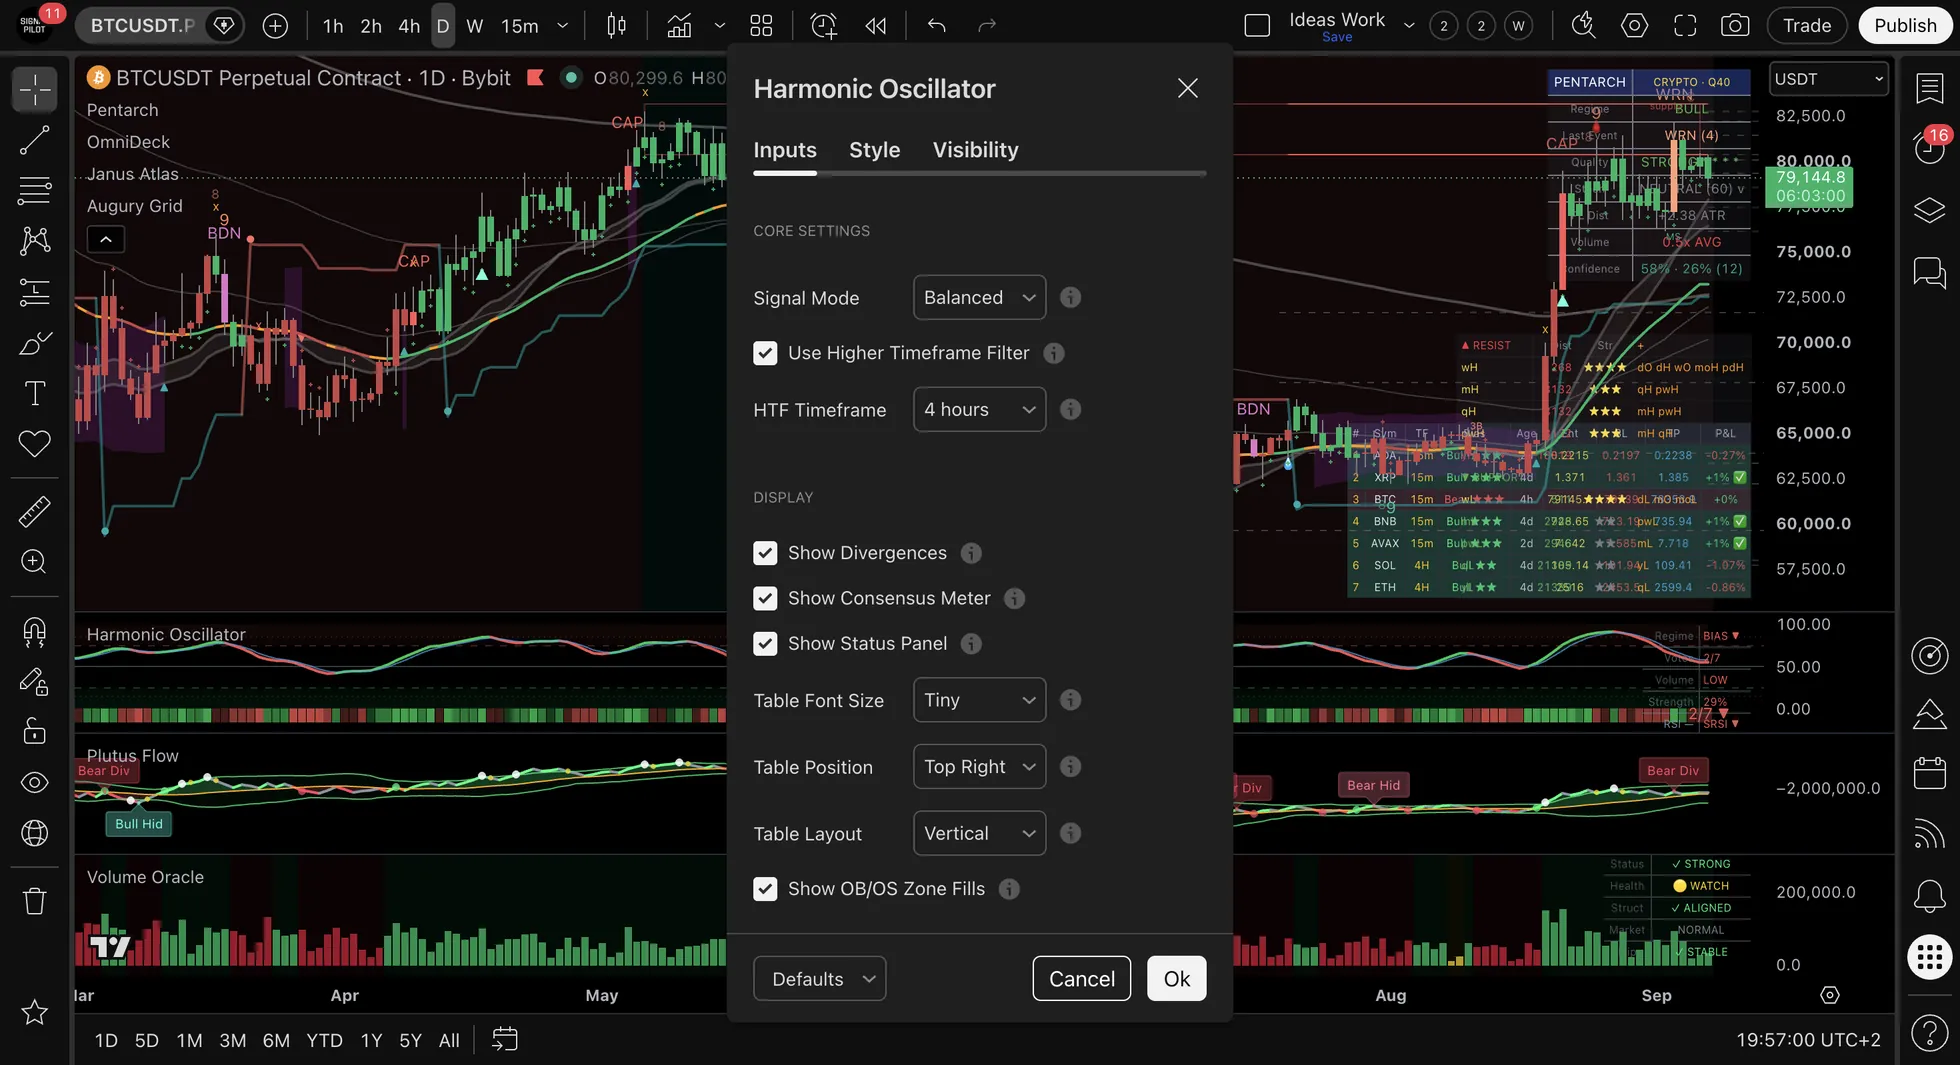
| Setting | Default | What it changes |
|---|---|---|
| Signal Mode | Balanced | Only the High Consensus alerts: 5 votes (Balanced), 4 (Aggressive), 6 (Conservative). Nothing on the chart changes |
| Use Higher Timeframe Filter · HTF Timeframe | On · 4 hours | Keeps divergences that agree with the higher timeframe's trend |
| Show Divergences · Consensus Meter · Status Panel · OB/OS Zone Fills | On | Each part on or off |
| Table Font Size · Position · Layout | Tiny · Top Right · Vertical | Horizontal is a wide two-row strip |
Alerts
| Group | Alerts |
|---|---|
| Crossovers | Bullish Crossover · Bearish Crossover · Any Crossover |
| Extremes | Extreme Overbought · Extreme Oversold · Exit Overbought · Exit Oversold |
| Divergence | Bullish Divergence · Bearish Divergence · Any Divergence |
| Regime | Regime to Bullish · Regime to Bearish |
| Consensus | High Bull Consensus · High Bear Consensus |
Good to know
- A count, not a call. Five of seven means much of the evidence agrees now. Markets turn against full agreement too.
- Extremes can last. In a strong trend the line can stay overbought for a long time; leaving the zone is the moment to watch.
- Divergences wait. They need three more bars to be confirmed, then they're drawn back where they happened.
- Read it with the others. Pentarch names the phase, Plutus Flow shows the volume behind the move.
Learning guide
Read it in order, with real examples and the common misreads: open the learning guide (2 minutes).
📞 Support
Technical Questions: support@signalpilot.io
Deepen your understanding with these articles from the Signal Pilot Blog:
Know when divergences are traps
The Confirmation TrapAvoid common mistakes when waiting for confirmation
Moving Averages ExplainedUnderstand the foundation of trend analysis
💬 Need Help?
Have questions about Harmonic Oscillator? Join our Discord community to get help from experienced users, share setups, and discuss approaches!
See Also
Related Pages:
- Janus Atlas - Combine momentum readings with key structural levels
- OmniDeck - Ten systems on one chart, read alongside Harmonic Oscillator rather than in place of it
- Best Practices & Pro Tips - Advanced strategies for momentum analysis
- How to Set Up Alerts - Get notified on consensus alerts
- Analysis Workflow - How momentum fits into complete analysis system
Disclaimer: The Harmonic Oscillator describes past price and volume; it does not predict. Results vary. Past performance does not guarantee future results. This is not financial advice.