Published as a TradingView Idea on ETHUSDT. View the chart on TradingView
In September we ranked the US economic releases by how much the hour they land in moves crypto. Here is the same ranking for 2026 alone, and what changed.
How we measure it
For each release, take the hour it lands in and measure that hour’s move, open to close, up or down. Divide it by the coin’s median hourly move over the same period. In 2026 an ordinary hour moved BTC 0.19%, ETH 0.24% and SOL 0.29%. 1.00 means the release hour looked like any other hour.
BTC, ETH and SOL, every release TradingView flags high, 1 January to 2 November 2026. Each hour is counted once, so two releases in the same hour count as one. The rules were written down before the run.
The 2026 ranking
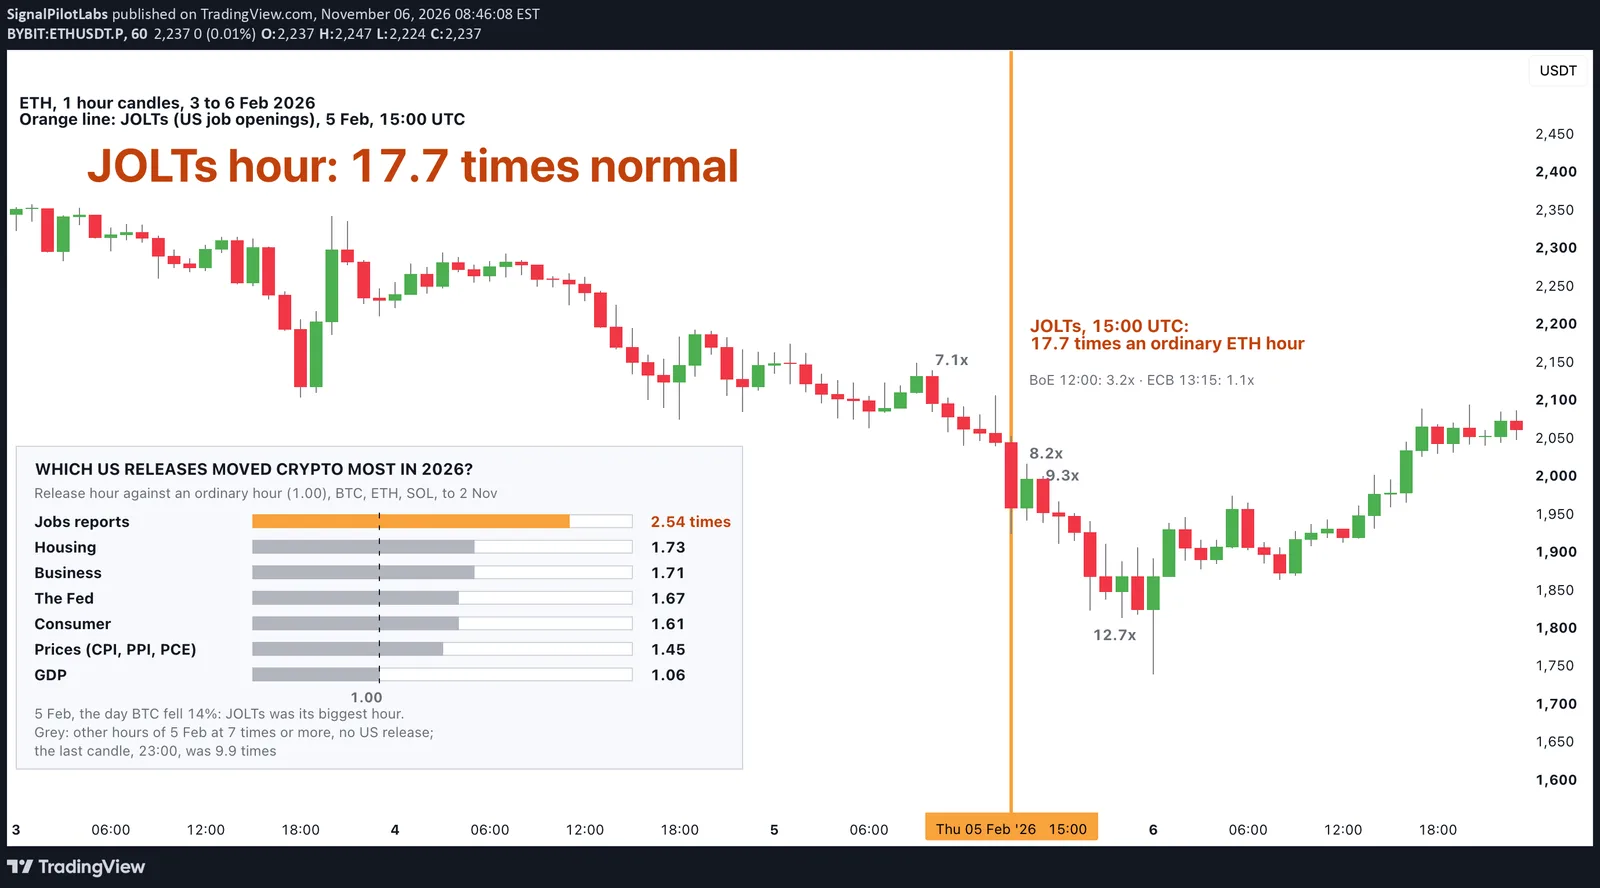
The jobs data led at 2.54 times an ordinary hour. Then came housing at 1.73, business at 1.71, Fed and money at 1.67, consumer at 1.61 and prices at 1.45. GDP came last at 1.06.
Each category in 2026 and in September, in multiples of an ordinary hour, with the number of distinct 2026 hours behind each figure:
| Category | 2026 | 2026 rank | September | September rank | Hours, 2026 |
|---|---|---|---|---|---|
| Labour, the jobs data | 2.54 | 1 | 3.14 | 1 | 21 |
| Housing | 1.73 | 2 | 1.38 | 6 | 20 |
| Business, such as the PMIs | 1.71 | 3 | 1.83 | 3 | 31 |
| Fed and money | 1.67 | 4 | 2.10 | 2 | 18 |
| Consumer | 1.61 | 5 | 1.57 | 5 | 32 |
| Prices, such as CPI and PPI | 1.45 | 6 | 1.70 | 4 | 32 |
| GDP | 1.06 | 7 | 1.16 | 7 | 11 |
What changed since September
The jobs data stayed first and GDP stayed last. Housing climbed from sixth to second, mostly on Existing Home Sales, at 2.45 times. Housing Starts, on the hours it had to itself, stayed close to ordinary, as our post on Housing Starts found.
The Fed fell from second to fourth. Prices fell from fourth to sixth, but not on CPI: its hours measured 1.78 times, above housing, and PPI’s 2.18. The PCE hours, close to an ordinary hour, pulled the group down.
By country
The US led at 1.89. The EU measured 1.37, China 1.07 and the UK 1.05. Japan’s releases measured 0.91, quieter than an ordinary hour.
| Country | Times an ordinary hour | Hours |
|---|---|---|
| US | 1.89 | 132 |
| EU | 1.37 | 22 |
| China | 1.07 | 48 |
| UK | 1.05 | 58 |
| Japan | 0.91 | 44 |
The biggest single hours of 2026
JOLTs on 5 February: 15.7 times an ordinary hour. ISM Manufacturing on 2 March: 14.5. ISM Services on 4 March: 13.2. The payrolls report on 4 September: 11.5. ISM Services on 3 September: 11.4. Each figure is the median of the three coins.
On the chart
ETH on the 1 hour chart, 5 February 2026, the day Bitcoin fell 14%. The JOLTs hour, 15:00 UTC, moved ETH 17.7 times an ordinary hour, the biggest hour of a violent day. Five other hours moved it 7 times or more with no US release in them. The Bank of England decision at 12:00 UTC and the ECB’s at 13:15 UTC moved it 3.2 and 1.1 times.
It’s one example, picked by a rule written before looking: the biggest US release hour of 2026, on whichever of ETH and SOL moved more in it.
What this does not tell you
Which way. It measures how much an hour moves, not the direction. One year of releases, so each category rests on 11 to 32 hours, with about thirty release names underneath. In sample.
What it’s good for is knowing which hours to respect: the jobs report is the one to watch.
Observations, not recommendations.
We’re Signal Pilot Labs. We build the Elite Seven, seven indicators for TradingView, and we post what we measure, including the parts that didn’t work.
See what we build at signalpilot.io.
Published as a TradingView Idea on ETHUSDT. View the chart on TradingView
Past measurement described after the fact. Nothing here is a recommendation or an indication of future results.