Published as a TradingView Idea on BTCUSDT. View the chart on TradingView
On Tuesday 20 October at 12:30 UTC, US Housing Starts and Building Permits print in the same minute. TradingView flags both as high importance, and they’re the only US releases flagged that way all week. So we measured what that hour has done to crypto. On its own, it has looked like any other hour.
How we measured it
For each release, we take the 1 hour candle it lands in and measure that hour’s move, open to close, as an absolute percentage. Then we divide by the coin’s median hourly move over the same window. 1.00 means the release hour looked like any other hour. We did it for Bitcoin, Ether and Solana on Bybit, from 12 August 2025 to 14 October 2026, for every US release TradingView flags high, counting each hour once however many releases print in it.
It’s the same yardstick as our ranking of the US releases that move crypto and our jobs week post, so the numbers compare directly.
Housing Starts, eleven hours
Across the three coins, the median Housing Starts hour moved 1.09 times an ordinary hour. In 5 of the 11 hours the three-coin median was below 1.00, quieter than normal. Bitcoin on its own: 0.86 times.
Three of those hours shared the clock with something bigger: payrolls once, on 9 January, and Durable Goods twice. Those three ran at 2.03 times. On the eight hours Housing Starts had to itself, with only Building Permits beside it, the median was 0.83 times an ordinary hour. Bitcoin’s was 0.56.
| Release day | Hour (UTC) | BTC, ETH, SOL (median) | Bitcoin | Also printed in that hour |
|---|---|---|---|---|
| 19 Aug 2025 | 12:00 | 0.43x | 0.43x | Building Permits only |
| 17 Sep 2025 | 12:00 | 0.78x | 0.26x | Building Permits only |
| 9 Jan 2026 | 13:00 | 1.68x | 0.86x | Payrolls, Unemployment Rate |
| 18 Feb 2026 | 13:00 | 1.71x | 1.71x | Durable Goods |
| 12 Mar 2026 | 12:00 | 0.51x | 0.28x | Building Permits only |
| 29 Apr 2026 | 12:00 | 2.50x | 3.05x | Durable Goods |
| 21 May 2026 | 12:00 | 0.60x | 0.60x | Building Permits only |
| 16 Jun 2026 | 12:00 | 1.06x | 0.51x | Building Permits only |
| 17 Jul 2026 | 12:00 | 1.87x | 1.63x | Building Permits only |
| 18 Aug 2026 | 12:00 | 0.77x | 1.09x | Building Permits only |
| 17 Sep 2026 | 12:00 | 1.82x | 1.74x | Building Permits only |
Ether and Solana moved more than Bitcoin: 1.68 and 1.39 times on all eleven hours, 0.82 and 1.04 on its own eight.
Of the 22 US releases flagged high with at least eight hours of history, Housing Starts ranks 18th, level with Building Permits, which prints in the same minute every time. JOLTs is first at 3.54 times.
One hour on the chart
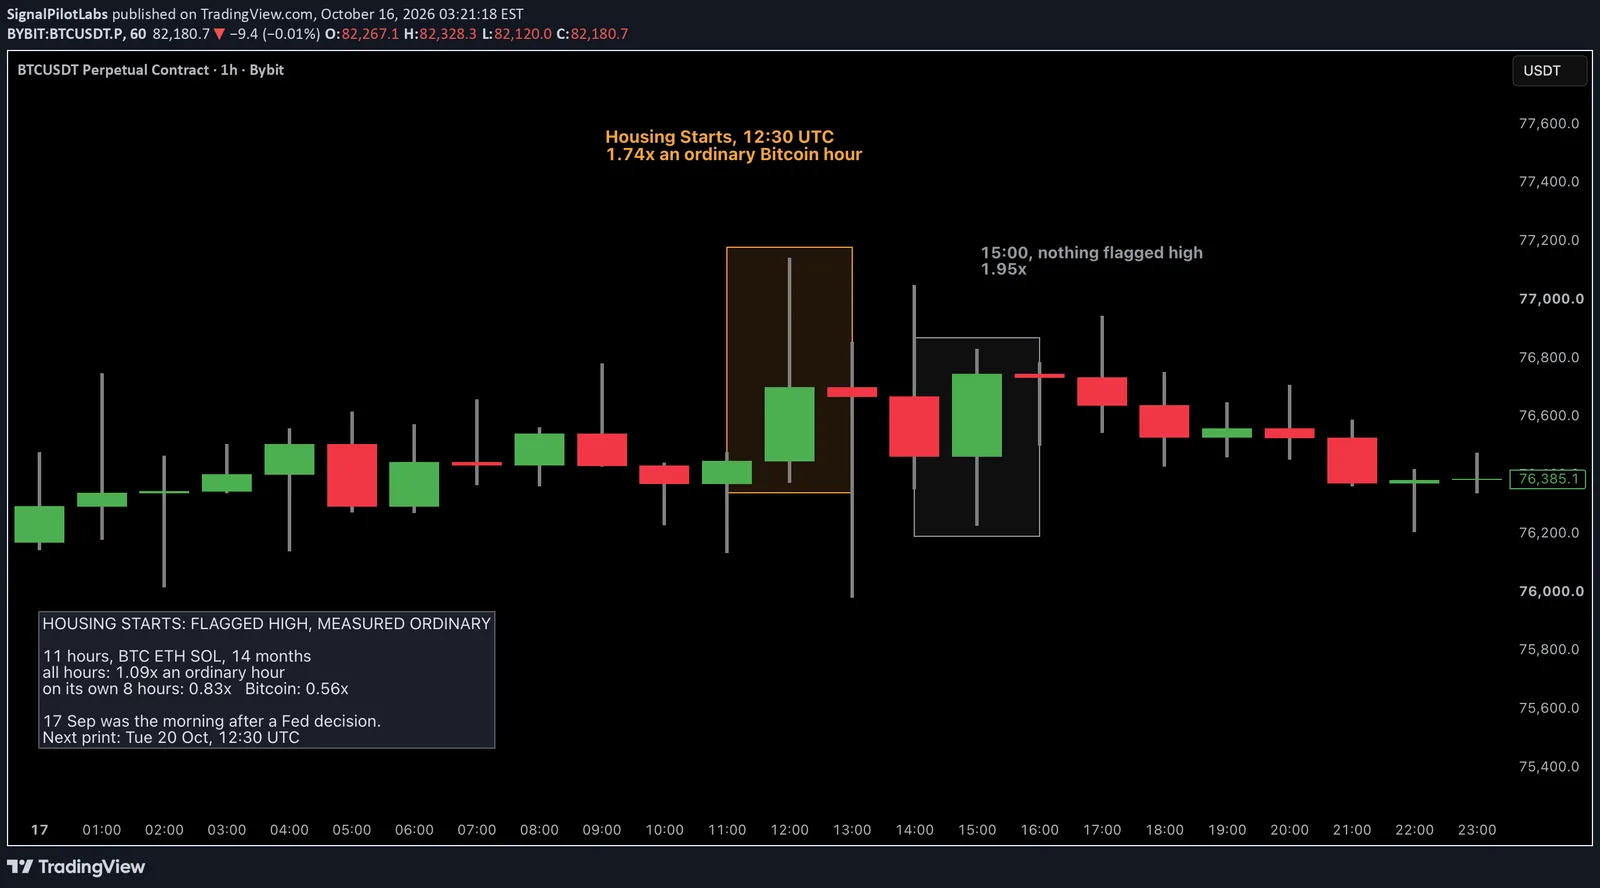
The latest one, 17 September 2026, Bitcoin, 1 hour. The Housing Starts hour moved 1.74 times an ordinary Bitcoin hour. That’s one of the bigger ones, and it came the morning after a Fed decision. Three hours later, with nothing flagged high on the US calendar, the 15:00 hour moved more: 1.95 times.
That’s what the median says in one picture. On a chart, the release hour usually looks like the hours around it.
How to check it on your own chart
- Open the economic calendar on TradingView and filter to US releases of high importance. For the week of 19 October that’s Housing Starts with Building Permits, Tuesday 12:30 UTC.
- On a 1 hour chart, note how far an ordinary candle moves from open to close. A few weeks of candles is enough to get a feel for the median.
- After the print, compare the release hour’s candle with that. Around one times is an ordinary hour. Two times or more was a big one.
- An ordinary hour still moves. Keep your usual stop, and size the position from it.
What this does not tell you
Which way. It measures how much the hour moved, not direction, and it isn’t a signal. Eleven hours is a small sample, and with 22 releases compared, some will land high or low partly by luck. In sample, one window, three coins. A surprise number can still move the market: this says what the hour has done, not what it must do.
What it’s good for is knowing what you’re holding into. On 20 October, the only red flag on the US calendar has, on its own hours, looked like an ordinary hour.
Observations, not recommendations.
We’re Signal Pilot Labs. We build the Elite Seven, seven indicators for TradingView, and we post what we measure, including the parts that didn’t work.
See what we build at signalpilot.io.
Published as a TradingView Idea on BTCUSDT. View the chart on TradingView
Past measurement described after the fact. Nothing here is a recommendation or an indication of future results.