Published as a TradingView Idea on BTCUSDT. View the chart on TradingView
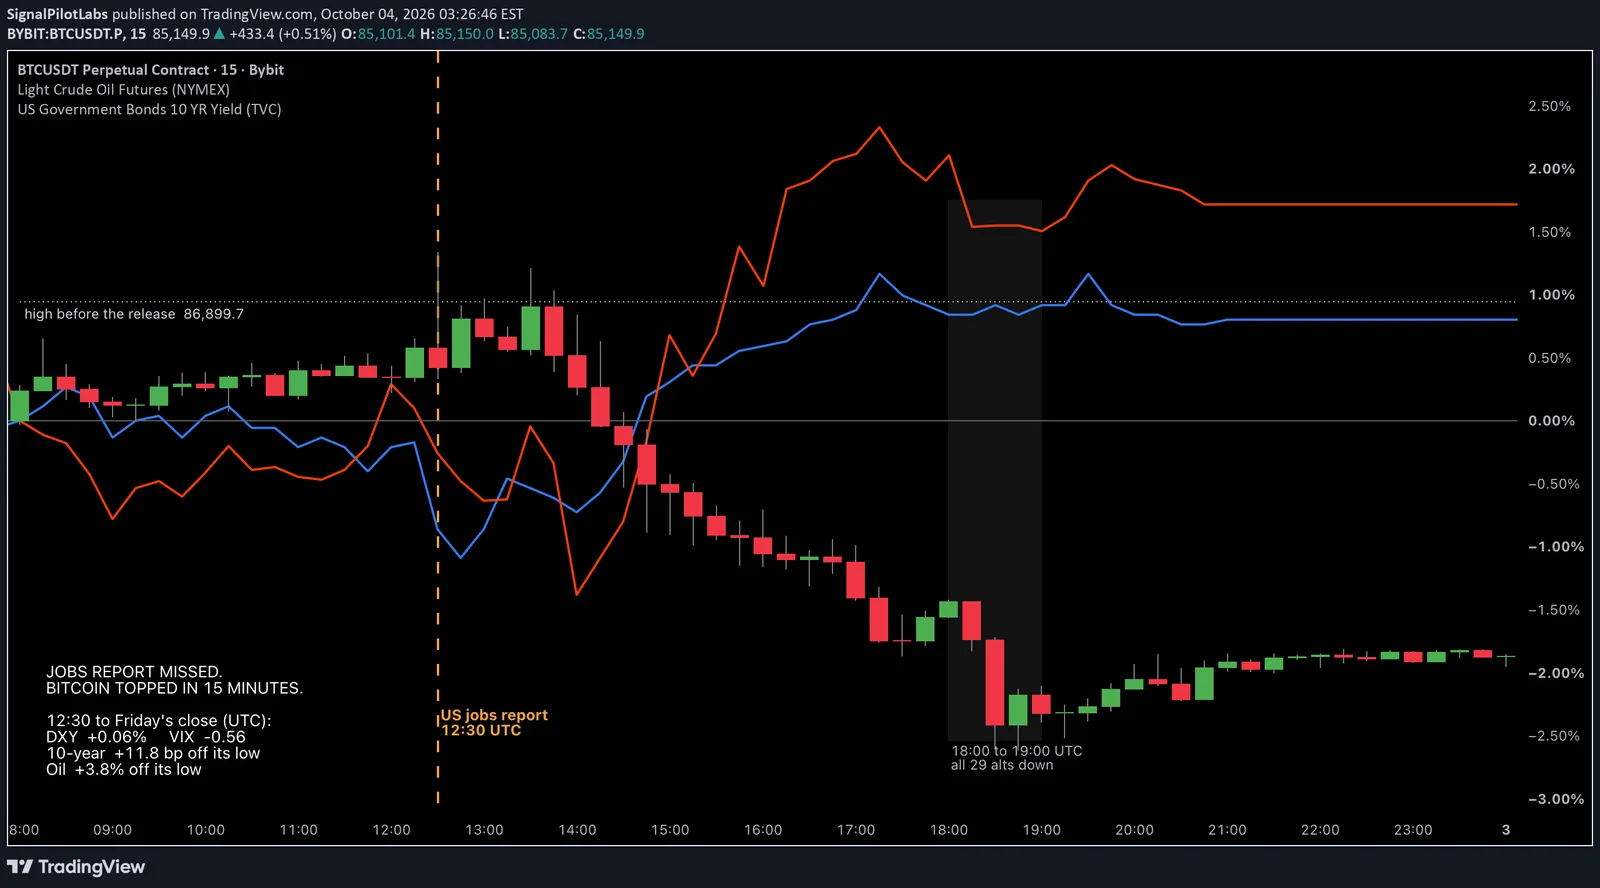
The US jobs report came out at 12:30 UTC on Friday 2 October and missed badly. Payrolls rose by 29,000 against 90,000 expected, unemployment ticked up to 4.2 percent, and hourly earnings rose 0.1 percent against 0.3 expected.
Bitcoin jumped to 87,242 in the next fifteen minutes. That was its highest price since 23 September, and 0.4 percent above the high it had made earlier that day. By 13:00 UTC it had closed back under that high. By the end of Friday UTC it sat at 84,476, 3.2 percent below the top.
What the usual suspects did
DXY finished the day 0.06 percent above where it stood at the release. Its whole range after 12:30 was 0.27 percent.
VIX fell 0.56 points, and never got back to its 12:30 level all afternoon. Nasdaq futures ended 0.2 percent higher.
If DXY and VIX were the only things on your screen, Friday looked calm.
What did move
The US 10-year yield dropped on the miss, from 5.224 percent to 5.176 by 13:00 UTC. Then it turned and climbed 11.8 basis points to 5.294 by 17:30 UTC, finishing the day above where it started.
Oil, the CL1! futures contract, bottomed at 88.48 at 14:15 UTC and rose 3.8 percent to 91.81 by 17:30 UTC.
Gold rose with the miss, to 4,248 at 13:00 UTC, then fell 2.2 percent by 16:00 UTC.
Between 14:00 and 15:00 UTC Bitcoin fell 1.0 percent. The 10-year yield rose 4.2 basis points in that same hour.
One way to read it: a weak jobs number says rate cuts, while rising oil and rising yields say the opposite. Gold and Bitcoin traded like the rate-cut bet being taken back. Stocks barely cared.
What the crowd did
Open interest in Bybit’s Bitcoin perpetual rose 2.3 percent from the release to its own peak at 14:30 UTC. By the end of Friday it was 8.5 percent below that peak.
The share of Bybit accounts holding Bitcoin longs went the other way. It was 52.3 percent at that 14:30 peak and 56.9 percent at the end of the day. More accounts were long while the price fell.
The evening flush
Between 18:00 and 19:00 UTC, the 29 largest altcoins on Bybit fell 3.3 percent on average in a single hour, and all 29 closed the hour lower.
| Line | 18:00 to 19:00 UTC |
|---|---|
| The 29 alts, on average | -3.3% |
| Bitcoin | -0.6% |
| US 10-year yield | -0.4 bp |
| Oil (CL1!) | -0.35% |
| DXY | +0.01% |
| Nasdaq futures | -0.02% |
Whatever drove that hour, it was not on the macro tape. From 12:00 UTC to the end of Friday, the median of the 29 fell 3.3 percent, and 26 of them closed lower.
How to check this yourself on the next release day
Put CL1! and US10Y on your chart next to DXY, in percent, as on the chart above. A move that DXY does not share can still be a macro move.
Mark the high your coin made before the release. A new high that closes back under it within the hour is worth noticing before you add to it.
What this does not tell you
This is one day. Things moving at the same time is not proof that one moved the other. It is not a rule for the next jobs report, and it says nothing about where any of this goes next.
How the 29 were chosen: the 30 largest crypto perpetuals on Bybit by trading volume from 25 September to 1 October, the week before, so the day itself could not pick the list, minus Bitcoin itself. Contracts Bybit classifies as a stock, an ETF or a commodity were left out.
Every figure here is public market data from Bybit and TradingView, and the release figures are from TradingView’s economic calendar. None of it comes from our indicators, and there is no indicator on the chart.
Observations, not recommendations.
We are Signal Pilot Labs. We build the Elite Seven, seven indicators for TradingView, and we post what we measure, including the days the answer sits somewhere no indicator looks.
See what we build at signalpilot.io.
Published as a TradingView Idea on BTCUSDT. View the chart on TradingView
Past measurement described after the fact. Nothing here is a recommendation or an indication of future results.