Published as a TradingView Idea on BTCUSDT. View the chart on TradingView
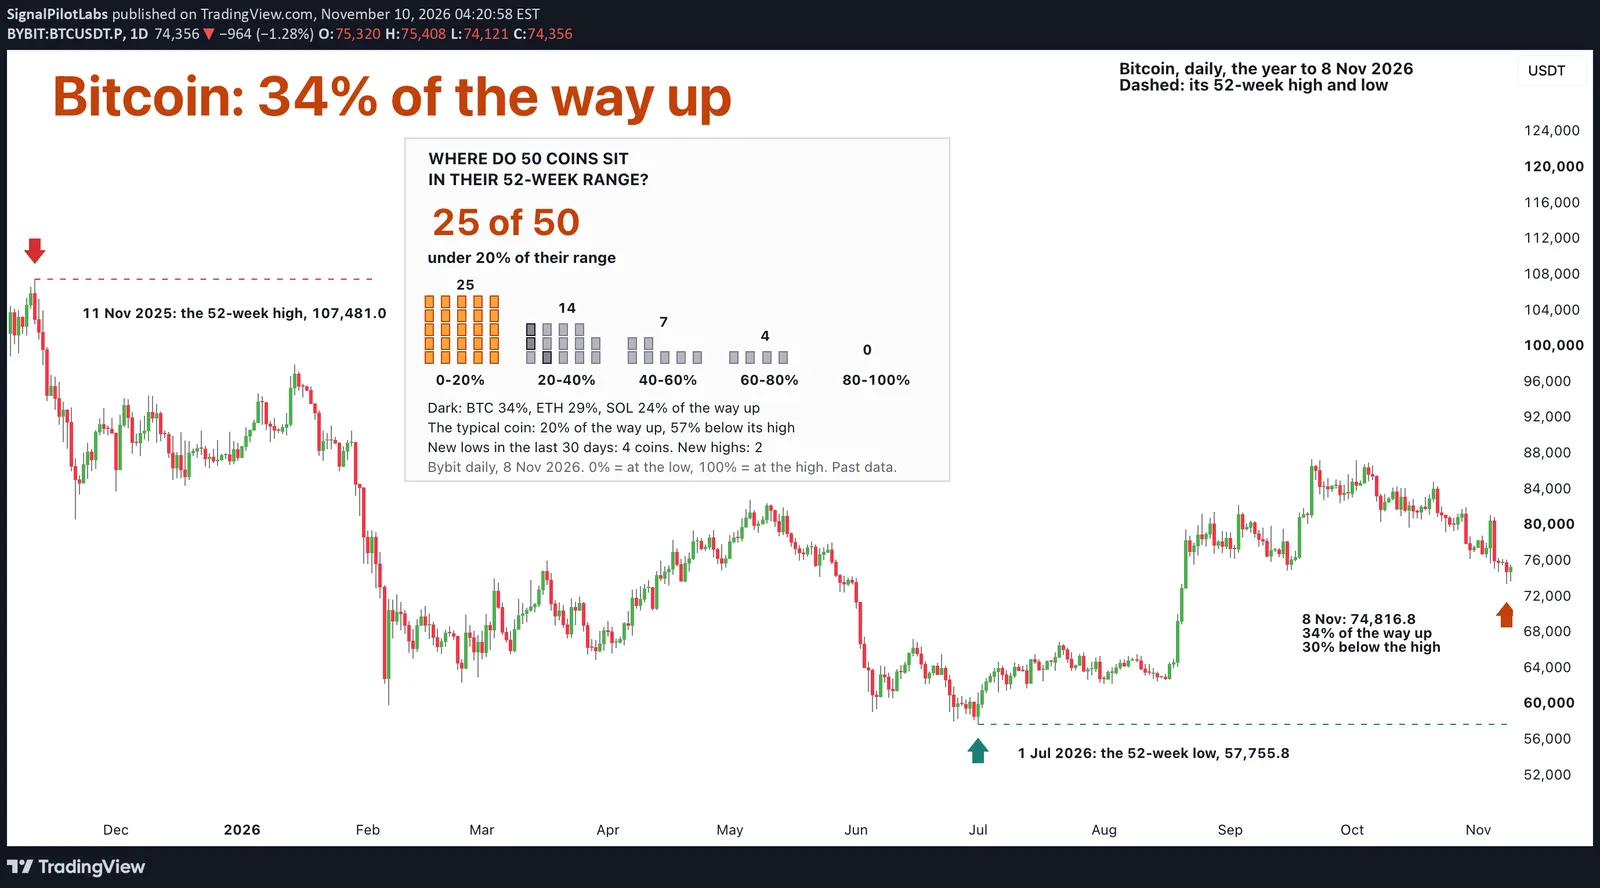
Every coin has a 52-week high and a 52-week low. Where it sits between them says a lot about the year it’s had. We put 50 coins side by side on the same day, 8 November 2026.
What we measured
Bybit daily candles for 50 coins, the 365 days to 8 November 2026. For each: its highest high and lowest low of those 365 days, how far the close sat below the high, and its position in the range. The rules were written down before any coin was computed.
How to work out a coin’s position
Take the close, subtract the 52-week low, and divide by the distance from the low to the high. 0% means sitting on the 52-week low, 100% on the 52-week high. For Bitcoin on 8 November: 74,816.8 minus 57,755.8, divided by 107,481.0 minus 57,755.8, is 34%.
What we found
The median coin sat 20% of the way up its range and 57% below its 52-week high.
Bitcoin sat at 34%: 30% below its high of 107,481 on 11 November 2025, and 30% above its low of 57,756 on 1 July 2026. Ethereum was at 29% and Solana at 24%.
Half the coins, 25 of 50, sat in the bottom fifth of their range, and none in the top fifth. The highest were INJ at 79%, HYPE at 70% and ZEC at 68%. The lowest were TRUMP at 0%, XPL and HBAR at 1%, and DOGE and APT at 2%.
The last month leans the same way. In the last 30 days, 4 coins made a new 52-week low, DOGE, HBAR, TRUMP and XPL, all four on 8 November itself, and 2 made a new high, INJ and NEAR. The nearest miss was RLC, whose high came 30 days earlier, on 9 October.
Check the date of a high. 29 of the 50 coins set theirs on 9 to 11 November 2025, the first three days of this window. As those days drop out, those coins will be measured against a lower high, and their position will rise even if the price does not move. LSK’s high, 2.78, came in a one-day squeeze on 13 September; it closed that same day at 0.79.
The calendar of the year shows as well: 31 of the 50 coins set their 52-week high in November 2025, and 11 coins set their low on the same day, 6 February 2026.
All 50 coins
| Coin | Position in its 52-week range (%) | Below its 52-week high (%) | Days since the high |
|---|---|---|---|
| INJ | 79.0 | 15.2 | 23 |
| HYPE | 69.7 | 24.0 | 46 |
| ZEC | 67.8 | 28.7 | 43 |
| XMR | 61.7 | 25.1 | 298 |
| VVV | 56.8 | 42.1 | 48 |
| 1000PEPE | 54.1 | 31.9 | 308 |
| NEAR | 52.8 | 40.6 | 27 |
| UNI | 51.9 | 38.0 | 46 |
| ZRO | 44.6 | 40.4 | 270 |
| QNT | 44.1 | 48.0 | 42 |
| PUMPFUN | 42.1 | 48.1 | 35 |
| ARB | 39.3 | 47.1 | 362 |
| AAVE | 39.0 | 45.9 | 362 |
| LINK | 34.8 | 38.0 | 362 |
| BTC | 34.3 | 30.4 | 362 |
| BNB | 30.6 | 32.8 | 363 |
| ONDO | 29.7 | 50.2 | 362 |
| AERO | 29.2 | 55.9 | 362 |
| TAO | 29.1 | 45.6 | 363 |
| ETH | 28.9 | 41.9 | 363 |
| USELESS | 28.8 | 65.7 | 46 |
| BR | 27.8 | 69.8 | 49 |
| ENA | 27.2 | 58.7 | 362 |
| SOL | 23.6 | 49.7 | 362 |
| DASH | 22.4 | 55.7 | 357 |
| TIA | 17.6 | 61.9 | 363 |
| AVAX | 17.4 | 57.4 | 362 |
| LTC | 14.8 | 55.9 | 364 |
| WLD | 13.8 | 63.2 | 363 |
| RLC | 13.4 | 72.6 | 30 |
| BCH | 11.9 | 64.3 | 307 |
| SUI | 11.6 | 63.2 | 363 |
| MOVR | 9.5 | 77.8 | 205 |
| XRP | 8.0 | 56.9 | 363 |
| ADA | 7.9 | 71.1 | 362 |
| PENGU | 7.5 | 63.2 | 362 |
| XLM | 5.9 | 53.0 | 363 |
| STRK | 5.8 | 86.7 | 353 |
| FIL | 5.6 | 75.2 | 364 |
| DOT | 5.2 | 74.5 | 362 |
| SAND | 4.6 | 81.0 | 362 |
| OP | 4.5 | 78.6 | 362 |
| LSK | 3.7 | 93.9 | 56 |
| FARTCOIN | 3.5 | 76.4 | 306 |
| AKE | 2.7 | 97.2 | 49 |
| APT | 2.3 | 83.1 | 362 |
| DOGE | 1.5 | 63.0 | 362 |
| HBAR | 1.0 | 67.0 | 363 |
| XPL | 0.7 | 84.5 | 363 |
| TRUMP | 0.3 | 88.2 | 363 |
On the chart
Bitcoin, daily, the 52 weeks to 8 November 2026, with the high, the low and the day’s close marked: 74,816.8, 30% below the high and 34% of the way up. A panel shows the 50 coins as squares, piled by where each sits in its range.
How to read it
- Work out the position: the close minus the low, divided by the high minus the low.
- Read it with the distance below the high. INJ sat 15% below its high, TRUMP 88%.
- Check when the high came. Most of these highs were a year old, right at the start of the window, and a fresh one can still sit far above the price.
How long a 20% drop on 50 coins took to win back is in our post on winning back a 20% drop, where 59% were won back within a year.
How far 50 coins move in a normal week is in our post on 50 coins’ normal week, from Bitcoin’s 8.1% to AKE’s 45.0%.
What this does not tell you
Where any coin goes next. A coin near its low isn’t cheap because of that, and one near its high isn’t due to fall. Highs and lows include wicks. It doesn’t tell you to buy or to sell. Past data.
Observations, not recommendations.
We’re Signal Pilot Labs. We build the Elite Seven, seven indicators for TradingView, and we post what we measure, including the parts that didn’t work.
See what we build at signalpilot.io.
Published as a TradingView Idea on BTCUSDT. View the chart on TradingView
Past measurement described after the fact. Nothing here is a recommendation or an indication of future results.