Published as a TradingView Idea on SOLUSDT. View the chart on TradingView
Before a long trade works, it usually goes against you first. Where you put the stop decides whether you’re still in when it does. So we measured how far the move goes against you first, on the 50 most traded crypto coins on Bybit, over a full year of 4 hour bars.
The short answer: measured in ATR, every coin behaves about the same. Measured in percent, they’re miles apart, from 2.3% on Bitcoin to 11.7% on AKE.
How it was measured
Every 4 hour close from 12 October 2025 to 12 October 2026 was treated as a long entry, with no signal and no filter: 2,160 entries per coin. An entry counted as having worked if price reached 2 ATR above it within the next 5 days. For every entry that worked, we measured how far price dipped below the entry before it got there, in ATR and in percent of price.
The coins are the 50 most traded crypto perpetual futures on Bybit from 11 September to 10 October 2026, each listed for the whole year. Contracts Bybit classifies as stocks, ETFs, commodities or forex pairs were left out, and so were the gold tokens.
In ATR, every coin is alike
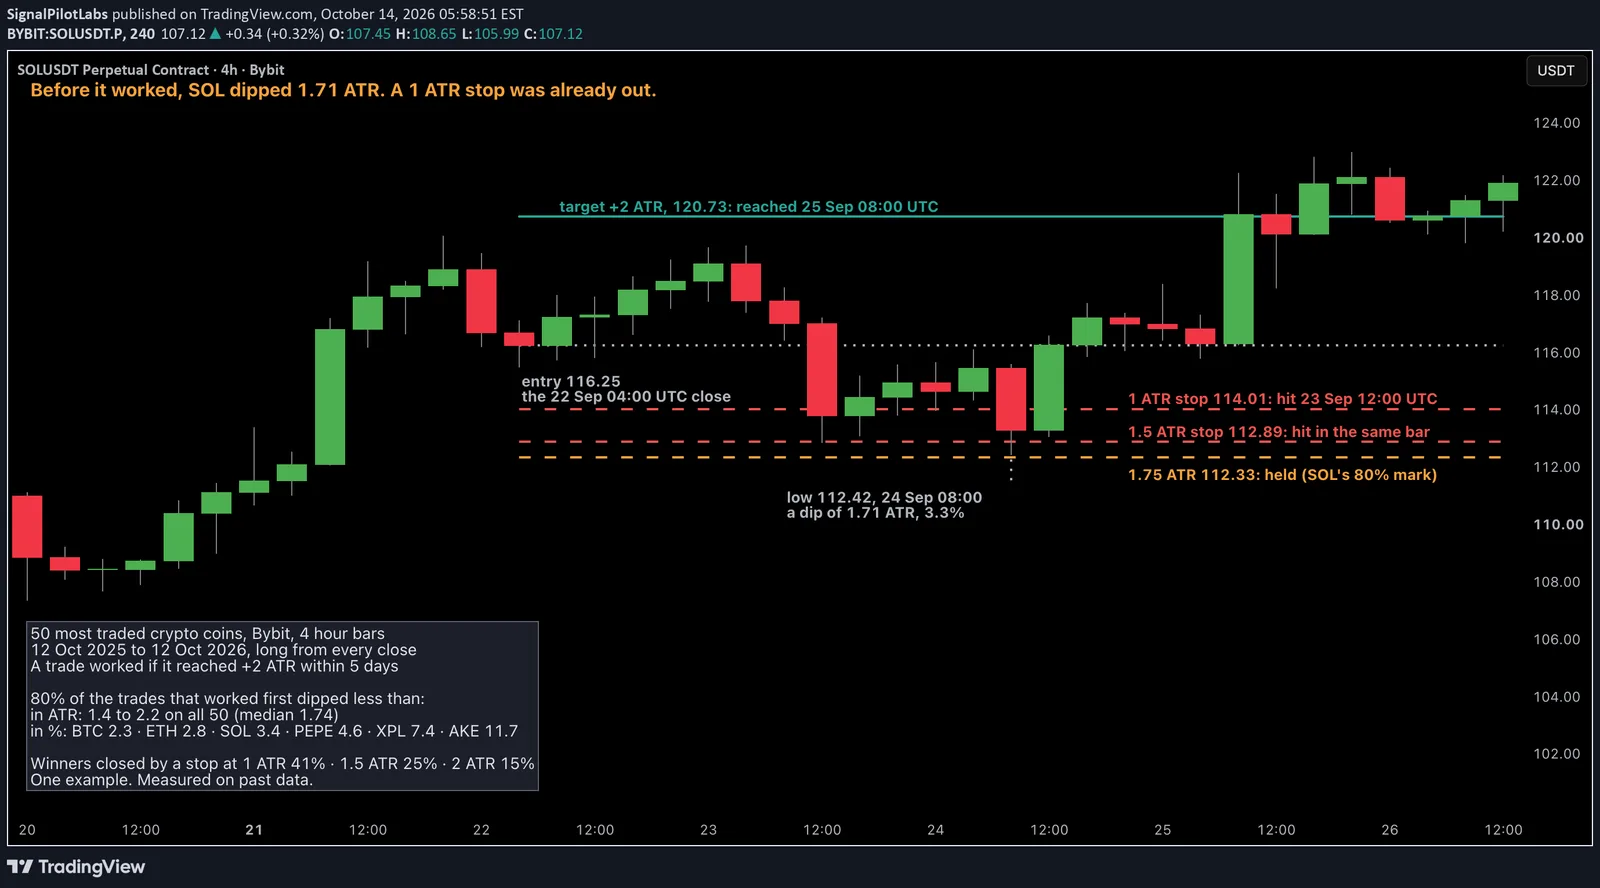
80% of the entries that worked dipped less than somewhere between 1.4 and 2.2 ATR first, on every one of the 50 coins. The median across the 50 was 1.74 ATR.
That makes the cost of a tight stop easy to state. A stop 1 ATR below the entry would have closed 41% of the trades that went on to work. At 1.5 ATR it closed 25%, and at 2 ATR 15%. Those are medians across the 50 coins, and the spread is narrow: on every one of them, a 1 ATR stop closed between 35% and 46% of the trades that later worked.
In percent, they are miles apart
ATR is a coin’s typical range, so the same ATR distance is a very different percentage from coin to coin. The table gives each coin’s 80% mark in both units, from the calmest coin to the widest.
| Coin | 80% of winners dipped less than (%) | The same, in ATR | Closed by a 1 ATR stop (%) |
|---|---|---|---|
| BNB | 2.3 | 1.79 | 42 |
| BTC | 2.3 | 1.73 | 40 |
| ETH | 2.8 | 1.61 | 36 |
| LTC | 2.9 | 1.76 | 40 |
| XRP | 3.1 | 1.68 | 42 |
| SOL | 3.4 | 1.75 | 40 |
| LINK | 3.5 | 1.66 | 41 |
| BCH | 3.6 | 1.70 | 45 |
| DOGE | 3.7 | 1.81 | 42 |
| HBAR | 3.7 | 1.84 | 43 |
| XLM | 3.9 | 1.77 | 42 |
| XMR | 4.0 | 1.63 | 39 |
| QNT | 4.0 | 1.87 | 45 |
| AVAX | 4.1 | 1.83 | 44 |
| ADA | 4.2 | 1.73 | 41 |
| UNI | 4.3 | 1.63 | 41 |
| AAVE | 4.3 | 1.62 | 36 |
| HYPE | 4.3 | 1.54 | 35 |
| TRUMP | 4.4 | 1.70 | 40 |
| LSK | 4.4 | 1.78 | 39 |
| SUI | 4.4 | 1.80 | 41 |
| RLC | 4.5 | 1.96 | 44 |
| ONDO | 4.5 | 1.75 | 40 |
| 1000PEPE | 4.6 | 1.72 | 40 |
| APT | 4.6 | 1.81 | 43 |
| DOT | 4.8 | 2.10 | 46 |
| ARB | 4.8 | 1.72 | 44 |
| NEAR | 4.8 | 1.70 | 38 |
| INJ | 4.8 | 1.68 | 40 |
| SAND | 4.9 | 1.93 | 44 |
| PENGU | 5.0 | 1.69 | 38 |
| TAO | 5.1 | 1.77 | 38 |
| OP | 5.1 | 1.93 | 44 |
| TIA | 5.2 | 1.81 | 43 |
| AERO | 5.3 | 1.67 | 40 |
| STRK | 5.5 | 1.82 | 45 |
| ENA | 5.5 | 1.70 | 41 |
| FIL | 5.5 | 2.23 | 44 |
| DASH | 5.6 | 1.63 | 39 |
| ZRO | 5.6 | 1.67 | 37 |
| WLD | 5.8 | 1.80 | 41 |
| ZEC | 6.1 | 1.57 | 36 |
| MOVR | 6.1 | 1.77 | 41 |
| PUMPFUN | 6.3 | 1.57 | 38 |
| FARTCOIN | 6.4 | 1.44 | 36 |
| VVV | 6.9 | 1.70 | 38 |
| XPL | 7.4 | 1.81 | 43 |
| USELESS | 8.6 | 1.52 | 36 |
| BR | 8.6 | 1.78 | 42 |
| AKE | 11.7 | 1.76 | 40 |
Bitcoin needed 2.3% of room. AKE needed 11.7%. One percentage stop used on every coin is too tight on the volatile ones, where it cuts trades that would have worked, and looser than it needs to be on the calm ones.
One trade on the chart
SOL, 4 hour chart, 22 September 2026. The 04:00 UTC bar closed at 116.25, with ATR at 2.24. On 23 September at 12:00 UTC price fell through a 1 ATR stop at 114.01 and a 1.5 ATR stop at 112.89 in the same bar. The low came the next day at 08:00 UTC, 112.42, a dip of 1.71 ATR or 3.3%, about SOL’s own 80% mark. A stop at 1.75 ATR held. On 25 September at 08:00 UTC price reached the 2 ATR target at 120.73.
How to use it
- Set the stop in ATR, not in percent. ATR is the unit in which these coins behave alike.
- Look up your coin in the table to see what that distance means in percent.
- Size the position from the stop distance. A wider stop then means a smaller position, and the same money at risk.
What this does not tell you
It describes the trades that worked. It doesn’t say which entries work, and a wider stop doesn’t make an entry better: on the trades that fail, it loses more per unit of size, which is what step 3 is for. The 2 ATR target and the 5 day limit are one definition among many, and the measurement is long only. It’s one year of data on one exchange. A dip on the bar that reached the target is counted in full, because the order of moves inside a 4 hour bar is unknown, so the numbers lean wide rather than narrow.
Observations, not recommendations.
We’re Signal Pilot Labs. We build the Elite Seven, seven indicators for TradingView, and we post what we measure, including numbers you can check against your own coin.
See what we build at signalpilot.io.
Published as a TradingView Idea on SOLUSDT. View the chart on TradingView
Past measurement described after the fact. Nothing here is a recommendation or an indication of future results.