Published as a TradingView Idea on BTCUSDT. View the chart on TradingView
Ask ten traders how wide a stop should be and you will get ten answers and no measurements. Tight, because you should be precise. Wide, because you should not be shaken out. Somewhere in between, because that sounds reasonable.
Stop width is measurable, and it decides two different things at the same time. One of them is obvious once you see it. The other one is the reason this post exists.
What the stop actually controls
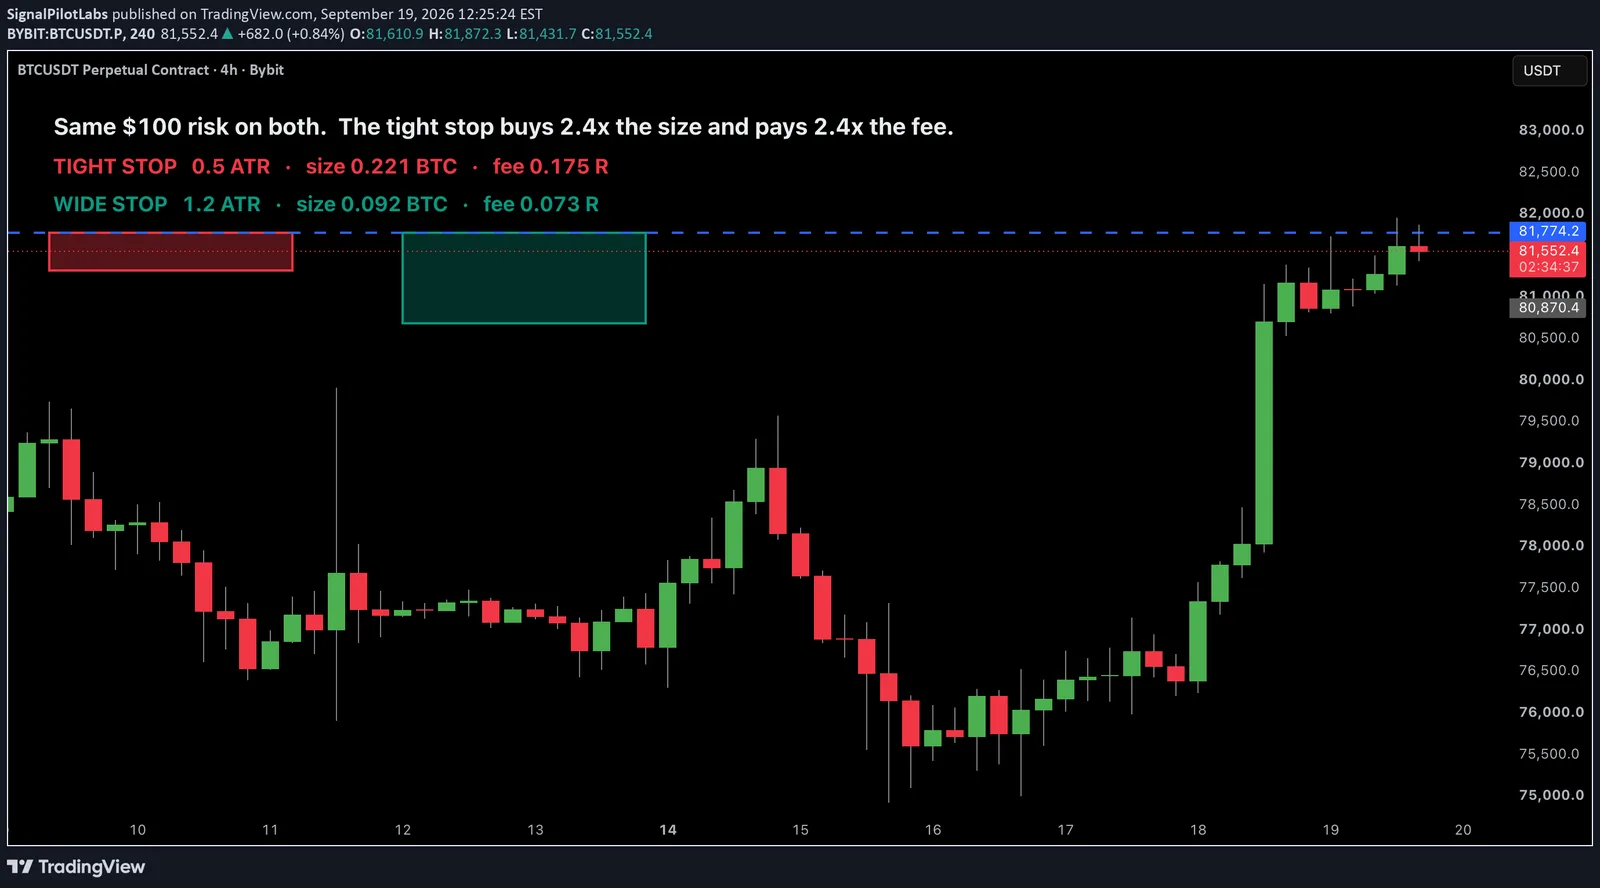
If your position size is derived from your risk, which is the only way sizing stays consistent across instruments, then the size is your risk budget divided by the distance to your stop.
That single line has a consequence people rarely follow through. A stop half as wide means a position twice as large. A position twice as large pays twice the fees, on entry and on exit, for exactly the same amount of money at risk.
Expressed as a share of the risk you took, the fee is the round trip cost divided by the stop distance:
| stop | fee, as a share of your risk |
|---|---|
| 0.5 × ATR | 0.070 R |
| 1.0 × ATR | 0.035 R |
| 2.0 × ATR | 0.018 R |
| 3.0 × ATR | 0.012 R |
Nothing about the quality of the trade changed between those rows. Only the invoice did.
The test, and why it needs a control
We took 5,990 of our own stamped four hour setups across 73 symbols and replayed each one forward for 48 hours against every combination of stop width and target distance. Where a bar could have touched both the stop and the target, we counted it as a loss.
Then we did the whole thing again with random entries on the identical bars.
That second grid is the point. Without it you learn what the market did over the period. With it you learn what your selection did, because whatever the random entries also earned was never yours.
The result that would have fooled us
The best looking cell on the board is a three ATR stop with a one and a half ATR target, netting plus 0.077 R per trade after fees.
Run without a control, that is a finding, and the advice writes itself: widen your stops.
The random entries earned plus 0.075 R in the same cell.
The edge is plus 0.002 R. The profit was not selection. It was the fee approaching zero on a very large stop, and a coin flip collected it just as easily.
The result that is actually ours
At half an ATR of stop, the same setups net plus 0.019 R, which looks far worse.
Random entries in that cell lose 0.159 R.
The difference is plus 0.177 R per trade, and it widens to plus 0.221 R at longer targets. The edge is biggest exactly where the fee is biggest and the headline is smallest.
Across the grid the pattern does not wobble. Half an ATR carries between plus 0.02 and plus 0.22 R of edge. One ATR carries plus 0.03 to plus 0.10. Two ATR is inside noise. Three ATR is nothing at all.
Why a wide stop hides an edge
Give a trade enough room and it nearly always reaches its target before its stop. Win rate climbs, reward per win falls, and the two cancel. The result stops depending on when you entered, which means it stops depending on the judgement you were trying to measure.
A tight stop does the opposite. It makes the entry matter, which is what puts your selection on the record. It also puts you in front of the fee, which is the uncomfortable half: the width that shows your edge is the width that charges most to use it.
What we are not saying
We are not saying widen your stops. The cell that rewards that pays a coin flip the same.
We are not saying tighten them to half an ATR either. A stop belongs beyond the level that invalidates the idea. No grid can see that level, and a stop placed in open space because a table liked the number is a worse trade than a wider one placed behind structure.
What we are saying is narrower: the stop is a cost lever and an evidence lever, not an edge lever. Choose it for invalidation first, then know what it is charging you and how much of your own contribution it is leaving visible.
Run it yourself
Take any set of entries you already trust. Replay them forward on a fixed horizon across a grid of stop widths and targets. Then replay random entries on the same bars and subtract. Publish the subtraction, not the grid.
In sample, one horizon, chosen grid, ambiguous bars counted as losses, fees modelled as a flat round trip with no funding or slippage. Observations, not recommendations.
Published as a TradingView Idea on BTCUSDT. View the chart on TradingView
Past measurement of our own tooling, described after the fact. Nothing here is a recommendation or an indication of future results.