Published as a TradingView Idea on AKEUSDT. View the chart on TradingView
How far does a coin move in an ordinary week? We measured the 50 most traded crypto perpetuals on Bybit over the last 52 weeks, from each week’s high to its low, so you know what normal looks like for the coin you hold. It’s the same measurement we ran on gold, silver and copper, and on the big US tech stocks. Every coin is in the table below.
What we measured
Bybit daily candles, weeks Monday to Sunday UTC, the 52 weeks starting 13 October 2025 to 5 October 2026. A week’s range is its high minus its low, as a percent of where it opened. The median is the normal week: half the weeks moved more, half less. The year before (weeks from 14 October 2024) is printed beside it, never mixed in, for the 43 coins listed long enough. The rules were written down before the run.
A normal week
The calmest six were Bitcoin at 8.1%, BNB at 9.0%, Litecoin at 11.0%, Ethereum at 12.0%, XRP at 12.3% and Bitcoin Cash at 12.9%. Solana’s normal week was 13.5%, and the median coin’s 17.5%.
The widest were AKE at 45.0%, USELESS at 36.4%, FARTCOIN at 28.2%, XPL at 27.3% and VVV at 26.6%. 48 of the 50 moved more than 10% in a normal week, and 17 moved more than 20%.
For scale, from the same measurement: Tesla’s normal week was 8.0%, gold’s 5.1% and the S&P 500’s 2.2%. So Bitcoin moves like Tesla, and the median coin moves about twice as far as either.
| Coin | Median weekly range (%) | One week in ten, at least (%) | Weeks over 10% (of 52) | Weeks over 20% (of 52) | Median close vs open (%) | Times Bitcoin’s | Biggest week | Its range (%) | Its close vs open (%) | The year before: median range (%) |
|---|---|---|---|---|---|---|---|---|---|---|
| BTC | 8.1 | 13.9 | 17 | 3 | 3.7 | 1.0 | 17 Aug 2026 | 26.8 | +23.6 | 8.6 |
| BNB | 9.0 | 19.0 | 19 | 4 | 3.2 | 1.1 | 2 Feb 2026 | 28.2 | -15.7 | 10.3 |
| LTC | 11.0 | 22.3 | 29 | 6 | 4.3 | 1.4 | 3 Nov 2025 | 34.3 | +11.0 | 16.0 |
| ETH | 12.0 | 19.4 | 32 | 5 | 4.1 | 1.5 | 17 Aug 2026 | 36.1 | +31.3 | 15.2 |
| XRP | 12.3 | 21.5 | 32 | 6 | 5.2 | 1.5 | 17 Aug 2026 | 71.7 | +53.1 | 16.6 |
| BCH | 12.9 | 24.4 | 34 | 11 | 5.6 | 1.6 | 17 Aug 2026 | 50.9 | +34.4 | 15.4 |
| QNT | 13.1 | 24.4 | 38 | 11 | 5.1 | 1.6 | 21 Sep 2026 | 484.6 | +346.6 | 17.2 |
| SOL | 13.5 | 22.6 | 36 | 7 | 4.4 | 1.7 | 2 Feb 2026 | 38.5 | -13.7 | 17.1 |
| HBAR | 13.6 | 24.5 | 38 | 14 | 6.9 | 1.7 | 28 Sep 2026 | 38.6 | +8.5 | 20.3 |
| DOGE | 13.9 | 23.6 | 39 | 9 | 6.0 | 1.7 | 17 Aug 2026 | 45.2 | +34.3 | 22.1 |
| AVAX | 14.1 | 22.5 | 41 | 10 | 5.1 | 1.7 | 14 Sep 2026 | 59.1 | +55.3 | 21.8 |
| XLM | 14.2 | 26.2 | 40 | 10 | 6.9 | 1.7 | 25 May 2026 | 103.1 | +76.1 | 19.9 |
| LINK | 14.3 | 23.6 | 39 | 9 | 5.2 | 1.8 | 17 Aug 2026 | 35.0 | +22.9 | 19.9 |
| LSK | 14.6 | 40.8 | 42 | 18 | 5.2 | 1.8 | 7 Sep 2026 | 2597.5 | +663.9 | 17.5 |
| DOT | 15.1 | 27.6 | 45 | 16 | 5.3 | 1.9 | 17 Aug 2026 | 40.9 | +22.4 | 17.5 |
| XMR | 15.3 | 34.4 | 43 | 13 | 4.6 | 1.9 | 12 Jan 2026 | 44.4 | +2.1 | 12.1 |
| AAVE | 15.6 | 30.8 | 47 | 17 | 8.2 | 1.9 | 17 Aug 2026 | 69.2 | +64.5 | 22.3 |
| TRUMP | 15.6 | 34.1 | 47 | 15 | 6.4 | 1.9 | 17 Aug 2026 | 165.0 | +87.6 | |
| RLC | 15.6 | 29.1 | 47 | 14 | 5.6 | 1.9 | 5 Oct 2026 | 312.5 | +185.9 | 20.3 |
| ADA | 15.8 | 23.4 | 44 | 16 | 7.0 | 2.0 | 17 Aug 2026 | 50.2 | +29.9 | 19.4 |
| SAND | 16.1 | 34.1 | 42 | 17 | 6.6 | 2.0 | 28 Sep 2026 | 93.8 | +67.4 | 19.6 |
| HYPE | 16.4 | 29.1 | 46 | 18 | 6.1 | 2.0 | 26 Jan 2026 | 58.7 | +37.7 | 26.8 |
| APT | 16.7 | 32.9 | 48 | 17 | 10.1 | 2.1 | 14 Sep 2026 | 44.7 | +25.8 | 20.1 |
| FIL | 17.2 | 35.3 | 46 | 20 | 5.4 | 2.1 | 3 Nov 2025 | 161.4 | +67.0 | 18.1 |
| ONDO | 17.4 | 34.4 | 48 | 22 | 8.6 | 2.1 | 4 May 2026 | 70.5 | +47.5 | 22.4 |
| NEAR | 17.5 | 38.0 | 49 | 21 | 7.6 | 2.2 | 14 Sep 2026 | 88.4 | +81.4 | 22.4 |
| SUI | 17.9 | 32.4 | 43 | 20 | 6.5 | 2.2 | 4 May 2026 | 54.5 | +44.9 | 21.8 |
| ARB | 18.4 | 31.9 | 50 | 24 | 8.5 | 2.3 | 31 Aug 2026 | 146.7 | +125.0 | 25.3 |
| 1000PEPE | 18.4 | 31.3 | 49 | 23 | 7.6 | 2.3 | 29 Dec 2025 | 78.8 | +71.7 | 25.1 |
| OP | 18.5 | 34.7 | 50 | 23 | 8.7 | 2.3 | 17 Aug 2026 | 51.3 | +34.4 | 23.3 |
| UNI | 19.0 | 40.3 | 46 | 22 | 8.8 | 2.3 | 10 Nov 2025 | 57.3 | +9.2 | 22.2 |
| STRK | 19.3 | 53.4 | 49 | 24 | 10.1 | 2.4 | 5 Oct 2026 | 135.0 | +109.7 | 23.4 |
| INJ | 19.6 | 36.9 | 50 | 23 | 6.6 | 2.4 | 14 Sep 2026 | 54.2 | +31.9 | 24.2 |
| TAO | 20.1 | 35.9 | 47 | 26 | 8.2 | 2.5 | 9 Mar 2026 | 61.9 | +56.0 | 24.4 |
| TIA | 20.8 | 36.6 | 50 | 27 | 7.2 | 2.6 | 13 Apr 2026 | 53.9 | +26.8 | 23.9 |
| DASH | 21.0 | 58.3 | 48 | 28 | 10.1 | 2.6 | 12 Jan 2026 | 160.7 | +112.1 | 16.0 |
| WLD | 21.0 | 38.7 | 49 | 31 | 9.7 | 2.6 | 1 Jun 2026 | 80.8 | +34.7 | 27.2 |
| ZRO | 21.2 | 38.5 | 51 | 30 | 10.2 | 2.6 | 17 Aug 2026 | 72.9 | +56.7 | 26.2 |
| PENGU | 21.6 | 35.9 | 51 | 31 | 9.7 | 2.7 | 17 Aug 2026 | 76.2 | +67.2 | 29.9 |
| MOVR | 22.1 | 43.1 | 50 | 29 | 8.9 | 2.7 | 13 Apr 2026 | 279.4 | +64.5 | 23.6 |
| PUMPFUN | 23.1 | 37.9 | 52 | 35 | 8.7 | 2.9 | 17 Aug 2026 | 104.8 | +96.1 | |
| AERO | 23.5 | 36.6 | 50 | 34 | 8.2 | 2.9 | 15 Jun 2026 | 49.0 | +35.1 | 24.1 |
| ENA | 23.7 | 40.4 | 52 | 35 | 10.6 | 2.9 | 17 Aug 2026 | 124.3 | +96.3 | 29.7 |
| ZEC | 25.8 | 57.6 | 51 | 39 | 14.5 | 3.2 | 3 Nov 2025 | 94.1 | +47.4 | 21.8 |
| BR | 26.5 | 91.6 | 52 | 44 | 8.2 | 3.3 | 16 Mar 2026 | 380.5 | +105.4 | |
| VVV | 26.6 | 51.7 | 52 | 39 | 11.1 | 3.3 | 9 Feb 2026 | 157.6 | +147.9 | |
| XPL | 27.3 | 47.1 | 51 | 39 | 13.7 | 3.4 | 30 Mar 2026 | 92.1 | +40.6 | |
| FARTCOIN | 28.2 | 47.5 | 52 | 37 | 10.0 | 3.5 | 24 Nov 2025 | 74.1 | +36.5 | 40.2 |
| USELESS | 36.4 | 61.0 | 52 | 49 | 11.4 | 4.5 | 31 Aug 2026 | 370.7 | +216.6 | |
| AKE | 45.0 | 147.0 | 52 | 45 | 15.5 | 5.6 | 14 Sep 2026 | 1127.6 | +292.0 |
Bitcoin moved more than 10% in 17 weeks of the 52 and more than 20% in 3. Ethereum: 32 and 5. Solana: 36 and 7. AKE moved more than 20% in 45 of the 52.
Where a week closed is a smaller number than how far it travelled. Bitcoin’s median close-to-open move was 3.7%.
The same table for metals is in our post on gold, silver and copper, and for the big tech stocks in our post on big tech’s normal week, measured the same way.
Normal changes
40 of the 43 coins we could measure the year before were calmer this year. On those coins the median went from 21.8% to 16.7%. Bitcoin went from 8.6% to 8.1% and Ethereum from 15.2% to 12.0%. The three that got wilder were the three privacy coins: Zcash from 21.8% to 25.8%, Monero from 12.1% to 15.3% and Dash from 16.0% to 21.0%.
The biggest week
For Bitcoin and 14 of the others it was the same week, the week of 17 August 2026. Bitcoin’s range that week was 26.8% and it closed 23.6% higher. Ethereum’s was 36.1%, closing 31.3% higher. News reports tied the rally to a US Treasury plan to buy back more long-term bonds and to money returning to the spot Bitcoin ETFs.
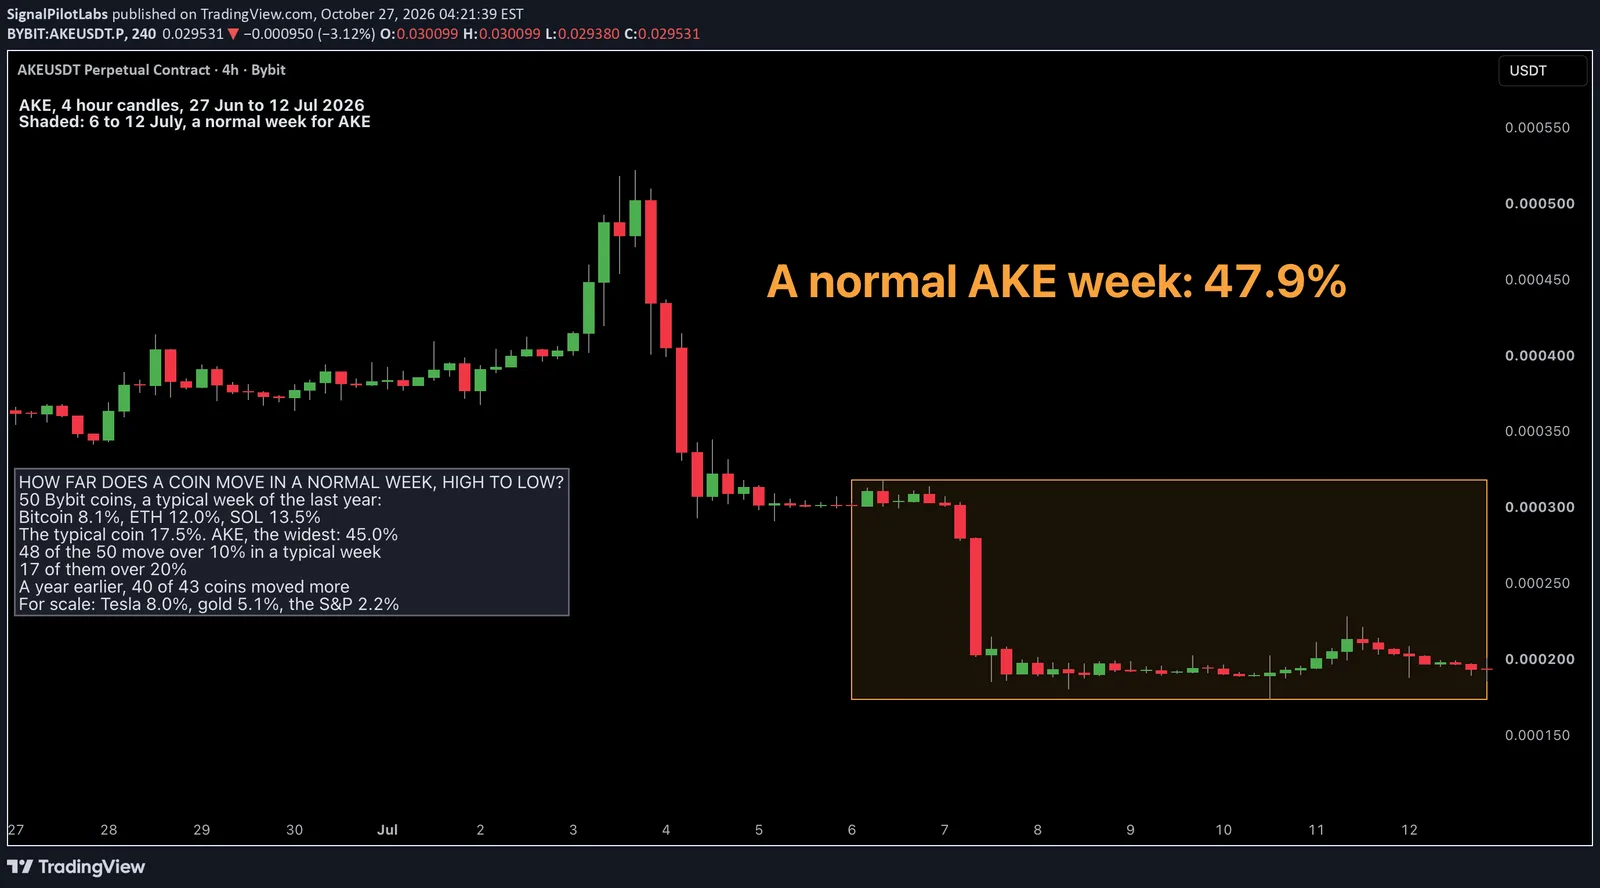
The chart: AKE, the week of 6 July 2026
AKE has the widest normal week of the 50. The chart shades an ordinary week for it, picked by a rule we set before looking: its most recent week within 10% of its median. AKE opened the week at 0.000301 and made its high of 0.0003179 on Monday. It fell 27% in one 4 hour candle on Tuesday morning, reached 0.0001738 on Friday and closed the week at 0.0001931: a 47.9% range, down 35.8%. For AKE, that was a normal week.
How to check it on your own chart
- Open your coin on a daily chart and take one week, Monday to Sunday UTC.
- Take the week’s high minus its low and divide by the week’s open.
- Compare it with the table: about 8% is a normal week for Bitcoin, 12% for Ethereum and 17.5% for the median coin.
- A stop that sits inside a normal week’s range is one a normal week can reach.
What this does not tell you
What next week will do, or which way. It’s one year on one exchange, and a median says what usually happens, not what the unusual weeks do. Seven of the 50 weren’t listed long enough for the year before, so their cells in that column are empty.
What it’s good for is knowing the size of an ordinary week for the coin you hold.
Observations, not recommendations.
We’re Signal Pilot Labs. We build the Elite Seven, seven indicators for TradingView, and we post what we measure, including the parts that didn’t work.
See what we build at signalpilot.io.
Published as a TradingView Idea on AKEUSDT. View the chart on TradingView
Past measurement described after the fact. Nothing here is a recommendation or an indication of future results.