Published as a TradingView Idea on WUSDT. View the chart on TradingView
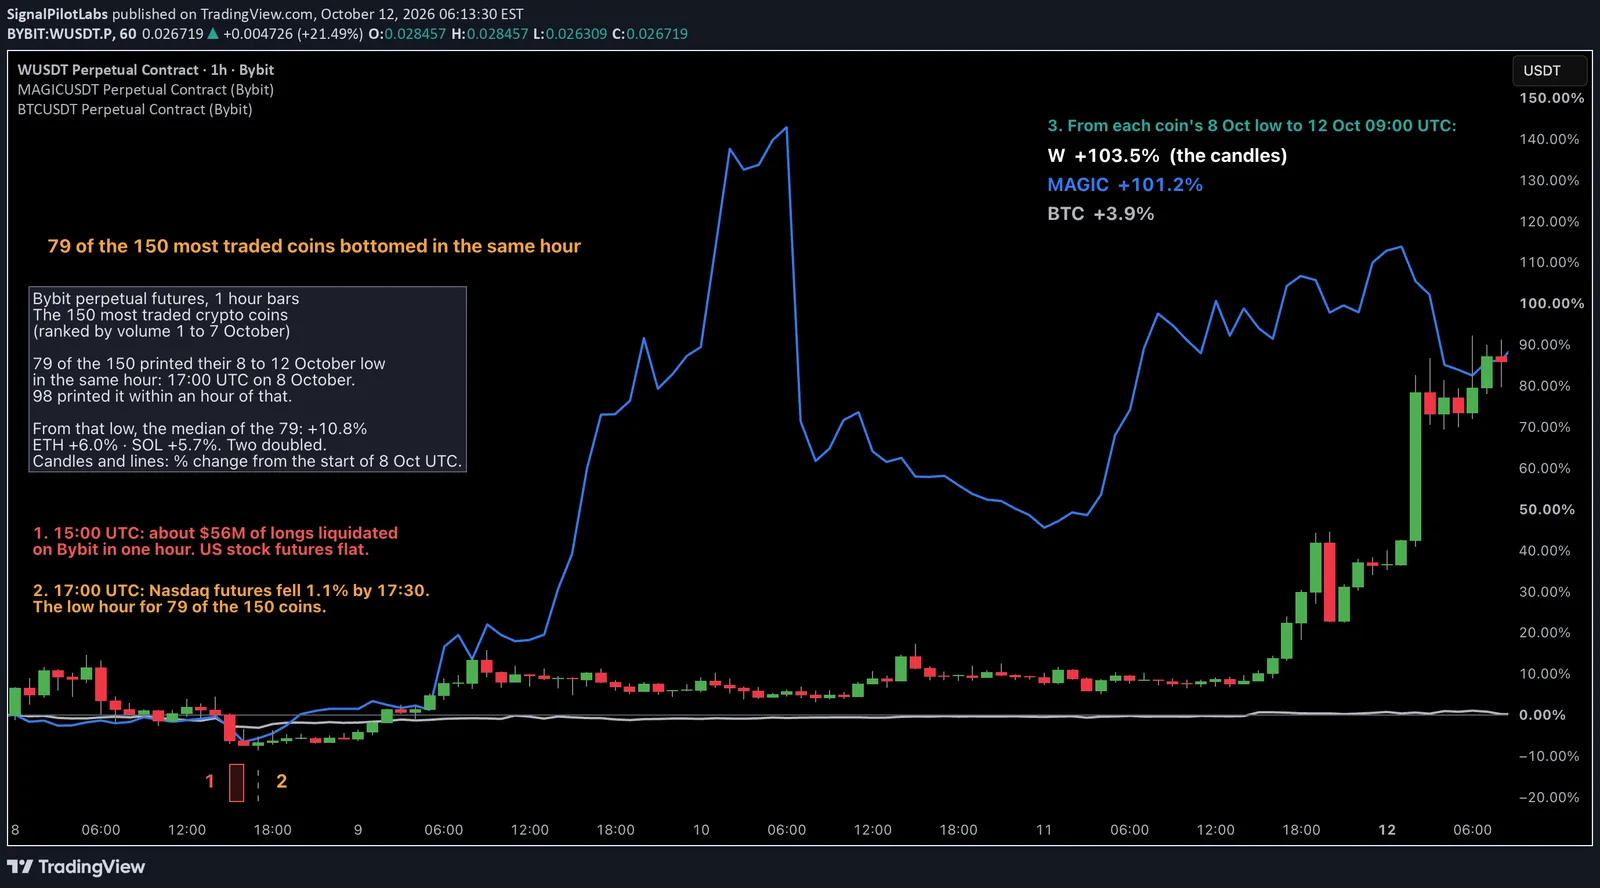
On 8 October, 79 of the 150 most traded crypto coins on Bybit printed their lowest price of the next four days in the same hour. Four days later two of them had doubled from that low, while the median coin had made 10.8%. The low was shared. The bounce was not.
The hour was 17:00 to 18:00 UTC on Thursday 8 October. Another 19 coins printed their low within an hour either side of it, and Bitcoin, Ether and SOL were all among the 79.
By 09:00 UTC on Monday 12 October, W had risen 103.5% from its low and MAGIC 101.2%. Bitcoin had risen 3.9%. This post walks through the day, then the split, then a check you can run yourself the next time the market flushes.
How it was measured
We took every crypto perpetual future on Bybit that was listed before 1 October and ranked them by trading volume from 1 to 7 October, the week before. The top 150 made the list. Ranking on the week before matters: rank on the volume of the days after a move, and the coins that ran pick themselves onto the list. Contracts Bybit classifies as a stock, an ETF, a commodity or a forex pair were left out, and so were the gold tokens XAUT and PAXG.
For each coin we read 1 hour bars from 8 October 00:00 UTC to 12 October 09:00 UTC, found the hour of its lowest low, and measured the close at the end of the window against that low. The window was frozen before we wrote a word, so the numbers couldn’t move while the post was written.
How the day went
The selling started in crypto, on its own. In the 15:00 UTC hour about $56 million of long positions were liquidated on Bybit, across the 77 coins we record, with $19.3 million of it on Bitcoin and $17.5 million on Ether. Between 15:00 and 15:30 UTC Bitcoin fell 1.6% while Nasdaq and S&P futures each moved less than 0.1%. Nothing major was on the US calendar: the Atlanta Fed’s GDPNow estimate at 15:15 UTC came in little changed, at 3.6%.
Two hours later stocks joined in. Between 16:45 and 17:30 UTC Nasdaq futures fell 1.1% and VIX rose about one point. That was the hour the low printed.
| Hour on 8 October (UTC) | Longs liquidated, 77 coins ($ million) | What else moved |
|---|---|---|
| 15:00 to 16:00 | 56.4 | Bitcoin -1.6% by 15:30, stock futures flat |
| 16:00 to 17:00 | 7.5 | |
| 17:00 to 18:00 | 12.6 | Nasdaq futures -1.1% from 16:45 to 17:30, VIX about +1 |
Over the whole of 8 October, longs lost $108 million on those 77 coins and shorts $4.7 million.
The low was shared
79 of the 150 coins printed their low in the 17:00 hour. The next most common hours were 18:00 with 17 coins and 15:00 with 14. Put another way, 112 of the 150 bottomed between 15:00 and 19:00 UTC on 8 October. The other 38 were spread across the four days.
When this many coins share an exact hour, the drop is the market’s, not theirs. No project’s own news lands on 79 coins in the same hour.
The bounce was not
| Coin | From its 8 October low to 12 October 09:00 UTC |
|---|---|
| W | +103.5% |
| MAGIC | +101.2% |
| S | +53.7% |
| ZK | +50.3% |
| Median of the 79 | +10.8% |
| Ether | +6.0% |
| SOL | +5.7% |
| Bitcoin | +3.9% |
Only 4 of the 79 rose more than 50%, and only W and MAGIC doubled. Across all 150 coins, from the start of 8 October to the end of the window, the median coin was down 0.4%, with 72 finishing higher and 78 lower. The low lined everyone up. The four days after spread them out again.
Two doublers, two different crowds
W and MAGIC ended up in the same place, but the positions underneath them weren’t alike.
W’s open interest on Bybit rose 52% from the 17:00 hour to the end of the window, and its funding stayed close to zero the whole time. Its 27 four-hour settlements added up to +0.11%. Positions were added on both sides, and neither side paid much to hold.
MAGIC’s open interest rose 117%, and its funding went the other way. It fell as low as -0.62% in a single four-hour settlement, -1.33% across the window. Negative funding means shorts pay longs, so while MAGIC ran, the shorts were the ones paying to stay in.
The candles don’t show that difference. Open interest and funding do.
How to check this yourself on the next flush
- Note the hour with the most long liquidations. On 8 October it was 15:00 UTC.
- Put your coin on a 1 hour chart next to Bitcoin, in percent, as on the chart above. If its low lands in the same hour as Bitcoin’s, the drop was the market’s.
- From there, read open interest and funding together. Rising open interest with flat funding and rising open interest with deeply negative funding are two different crowds, even when the price looks the same.
What this does not tell you
This is one flush and one four-day window. The count of 79 depends on where the window ends, and the coins that doubled are the tail of the list, not its middle: the median coin made 10.8%. Nothing here says when the next low comes or which coin runs from it. The liquidation totals come from our own recording of Bybit’s public feed for 77 coins, not from every coin listed, and the macro moves are lined up in time, not proven to cause anything.
Observations, not recommendations.
We’re Signal Pilot Labs. We build the Elite Seven, seven indicators for TradingView, and we post what we measure, including the days the whole market moves as one.
See what we build at signalpilot.io.
Published as a TradingView Idea on WUSDT. View the chart on TradingView
Past measurement described after the fact. Nothing here is a recommendation or an indication of future results.