Published as a TradingView Idea on BTCUSDT. View the chart on TradingView
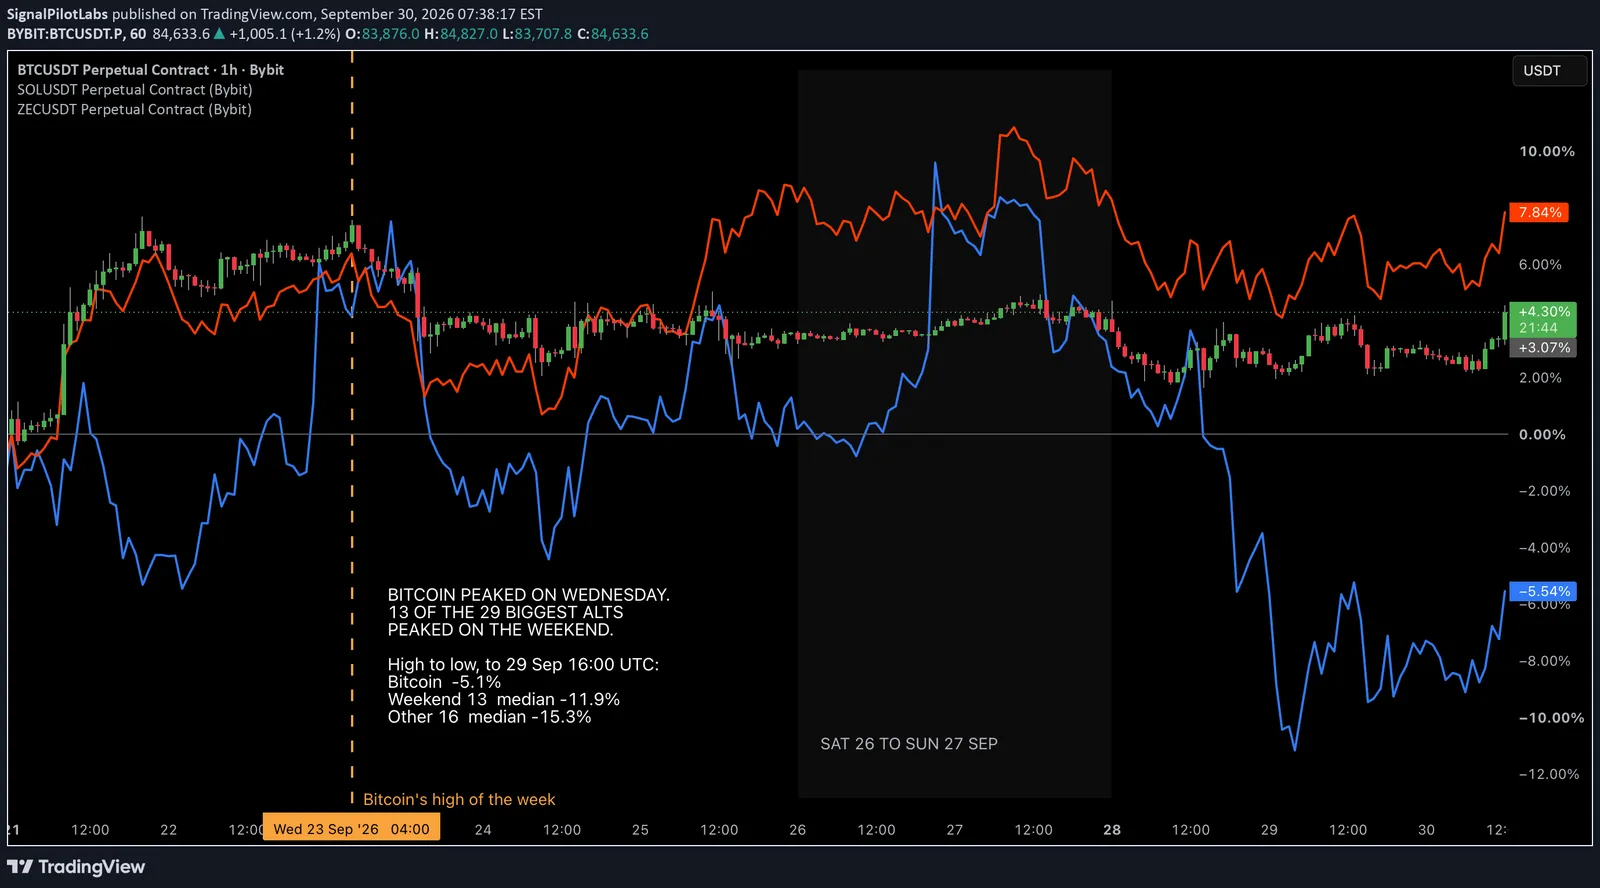
Bitcoin’s highest close of the week came on Wednesday 23 September, in the 04:00 UTC hour, at 87,132. Thirteen of the 29 biggest altcoins on Bybit made their highest close of that same week three or four days later, on Saturday or Sunday. SOL, ZEC and NEAR were three of them.
The chart above is Bitcoin with SOL and ZEC laid over it in percent from the start of Monday 21 September. Bitcoin’s weekend bounce stopped below its Wednesday high. SOL and ZEC went on to new highs for the week.
Who peaked when
Highest hourly close of the week, Monday 21 to Sunday 27 September.
| When it peaked | Coins |
|---|---|
| Monday morning, and never higher after | AVAX, XMR |
| Monday to Wednesday, before Bitcoin | AKE, ETH, BNB, 1000PEPE, UNI, PONS, DOGE |
| The same hour as Bitcoin | XRP, HYPE, USELESS, FARTCOIN |
| One to five hours after Bitcoin | ARB, TRUMP, BCH |
| Saturday | ADA, LTC, TAO, ZEC |
| Sunday | LINK, AAVE, SOL, WLD, ENA, SUI, NEAR, ONDO, PUMPFUN |
What came after
From each coin’s high of the week to its lowest hourly close through 16:00 UTC on 29 September, Bitcoin fell 5.1 percent. The thirteen weekend coins fell a median 11.9 percent. The other sixteen fell a median 15.3 percent.
So peaking later did not mean falling further. This week it went the other way.
Here are the thirteen, in the order they peaked.
| Coin | Highest close, UTC | Fall to 29 September |
|---|---|---|
| ADA | Saturday 01:00 | -8.1% |
| LTC | Saturday 09:00 | -9.2% |
| TAO | Saturday 15:00 | -11.9% |
| ZEC | Saturday 21:00 | -18.9% |
| LINK | Sunday 07:00 | -6.0% |
| AAVE | Sunday 07:00 | -7.6% |
| SOL | Sunday 09:00 | -6.1% |
| WLD | Sunday 11:00 | -18.9% |
| ENA | Sunday 18:00 | -15.4% |
| SUI | Sunday 18:00 | -13.0% |
| NEAR | Sunday 21:00 | -17.3% |
| ONDO | Sunday 23:00 | -15.4% |
| PUMPFUN | Sunday 23:00 | -8.9% |
By 16:00 UTC on the 29th, three of the thirteen, LINK, AAVE and PUMPFUN, were already back above their highs for the week.
How the 30 were chosen
The 30 largest crypto perpetuals on Bybit by trading volume in the week before, 17 to 23 September, so the drop itself could not pick the list.
Four larger contracts were left out because Bybit itself classifies them as a stock, an ETF or a commodity: SanDisk, SOXL, gold and crude oil.
How to read it yourself
Put your coin and Bitcoin on the same 1 hour chart in percent, as above, or open both weekly candles and note which hour made each one’s highest close.
A new high on your coin while Bitcoin sits below its own is a fact about your coin. On its own, it is not a fact about the market.
Two traps we nearly fell into
Where you start the clock. Our first pass started counting on Thursday 24 September. That made Bitcoin look like the last coin to peak, on Sunday, when its real high for the week was Wednesday. A window that opens in the middle of a move hands you a fake top on its first bar.
Where you stop it. We first froze the lows at 00:00 UTC on Tuesday 29 September. Nineteen of the thirty closed lower after that, fifteen of them on the 02:00 or 03:00 UTC close. So every drop here is stamped 16:00 UTC, 29 September, and none of them is called a bottom. Three coins printed a new low on that very close.
What this does not tell you
One week, thirty coins, one exchange. It does not say that a late peak warns of a bigger fall, and this week it went the other way. It does not say where any of these go next.
Every figure here is public Bybit market data, hourly closes read on 29 September and frozen at the 16:00 UTC close. None of it comes from our indicators, and there is no indicator on the chart.
Observations, not recommendations.
Published as a TradingView Idea on BTCUSDT. View the chart on TradingView
Past measurement described after the fact. Nothing here is a recommendation or an indication of future results.