Published as a TradingView Idea on BTCUSDT. View the chart on TradingView
There is a line that turns up in every discussion of risk: correlations go to one in a crash. It is used to argue that diversification is a fair-weather comfort, that the moment it matters your positions stop being separate bets and become one bet with several names on it.
It sounds right, it is repeated by people who know what they are talking about, and we had never checked it on our own book. So we did.
How it was measured
Ten alts we hold or watch, plus Bitcoin, Ethereum and Solana, on the four hour chart. Nine hundred and ninety eight closed bars from Bybit's public data, the forming bar dropped so nothing moves after it is read.
Then we sorted every bar by what Bitcoin did and cut the worst ones out: the worst five percent, ten, twenty and thirty. Four different definitions of a bad day, because a finding that only survives one cut is a finding about the cut.
The number that is supposed to spike, and does not
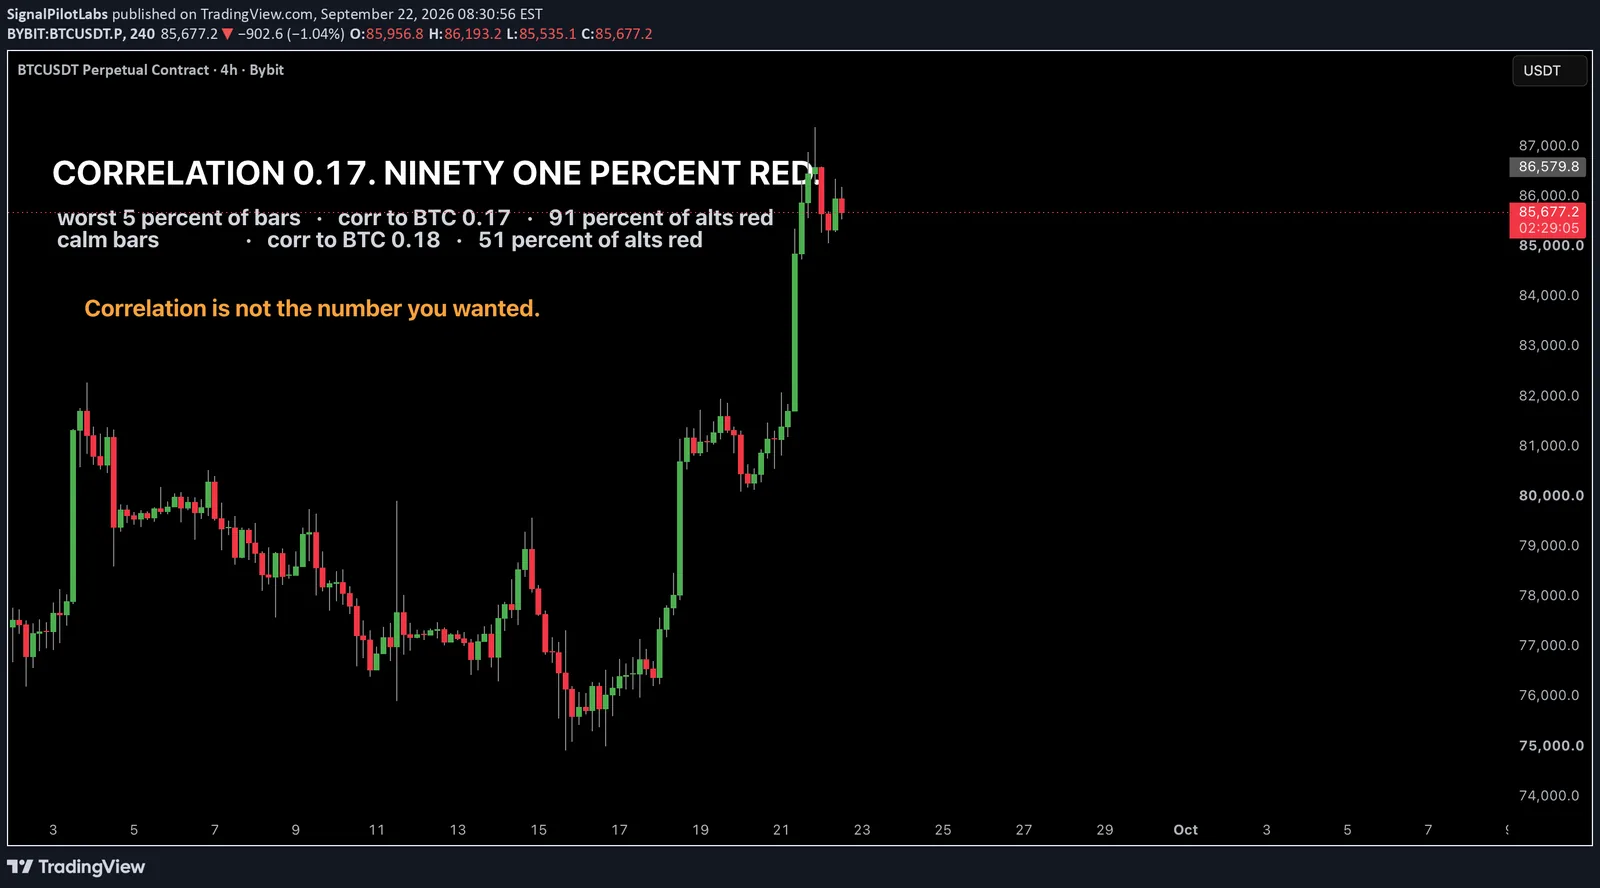
On the calm middle of the sample, the average correlation between an alt and Bitcoin is 0.18.
On the worst five percent of bars, where Bitcoin averages minus 1.75 percent, that same correlation is 0.17. At the worst ten percent it is 0.26. At twenty percent, 0.34. At thirty percent, 0.37.
It wanders inside a narrow band and it never once leaves the range a textbook would call essentially uncorrelated. If correlation is the number you check to know whether your positions move together, you would close that check reassured on the worst days in the sample.
What the book was actually doing on those same bars
On the calm middle, 51 percent of the alts close red on a given bar. That is what a coin flip looks like, and it is what you would expect from ten instruments with no shared direction.
On the worst thirty percent of bars, 81 percent close red. At twenty percent, 84 percent. At ten percent, 88 percent. On the worst five percent, 91 percent of the book is red and the average alt is down 2.21 percent.
Thirty seven of the worst ninety nine bars had every single one of the ten alts close red. Not most of them. All ten.
So the coefficient sits at 0.17 and reports uncorrelated, while nine names in ten go down together.
Why both numbers are right
Correlation does not measure whether things fall together. It measures whether they deviate from their own averages together, in proportion.
In a selloff the alts do all fall, but by wildly different amounts. The spread of returns across the ten names widens from 1.17 percent on calm bars to 1.58 percent on the worst ones. That widening is what holds the coefficient down. Direction agreement goes up, proportional agreement goes down, and correlation only reports the second one.
You can be statistically uncorrelated and lose on everything you own at the same time. Those two facts are not in tension. They are answers to two different questions, and only one of them is the question a book of positions actually asks.
The majors are the exception, and it is worth saying
Run the same cut on Bitcoin, Ethereum and Solana against each other and the pairwise correlation does rise on bad bars, from 0.43 to 0.64.
The cliche is not wrong everywhere. It is closest to right on the handful of instruments that were already moving as one thing, and furthest from right on the long tail where people believe they are diversified. If you hold the three majors, you do not have three positions. If you hold ten alts, you might well have ten, and the correlation matrix will not tell you which situation you are in on the day it matters.
What to check instead
Do not start with a correlation matrix.
Take your last hundred bars. Find the worst ten by whatever you consider the market. Count what fraction of your book closed red on those bars.
That count is the number you wanted. It takes a minute, it needs no statistics, and if it comes out above eighty percent you are holding one position with several names on it, whatever the coefficient says.
Caveats
Ten alts, one venue, four hour bars, 998 of them, and the definition of a bad bar is a choice we made. We published four different cuts precisely because the first framing we tried did not survive being cut a second way: an earlier version of this claimed correlation fell during selloffs, which turned out to depend entirely on how wide the calm band was drawn. At a middle-eighty band calm reads 0.37, at middle-forty it reads 0.18. That reverses the direction of the claim, so we threw it out and kept the finding that holds at every cut.
This measures co-movement, not a strategy. There is no edge claimed here and nothing about what to hold.
Observations, not recommendations.
Published as a TradingView Idea on BTCUSDT. View the chart on TradingView
Past measurement of our own tooling, described after the fact. Nothing here is a recommendation or an indication of future results.