Published as a TradingView Idea on BTCUSDT. View the chart on TradingView
Bitcoin and Solana spent twenty four-hour bars doing the same thing. Their returns over the preceding ninety bars correlated at 0.885, with Ethereum between them at 0.797 and 0.844. That is about as close as separate instruments get, and we read it as one exposure rather than three setups, which is a sizing decision before it is anything else.
Then we did the obvious sanity check. A plain fourteen period RSI on both charts, same timeframe, same closed bar, to see whether the most widely used indicator in the world agreed with how we were reading it.
It put them the wrong way round.
The two numbers
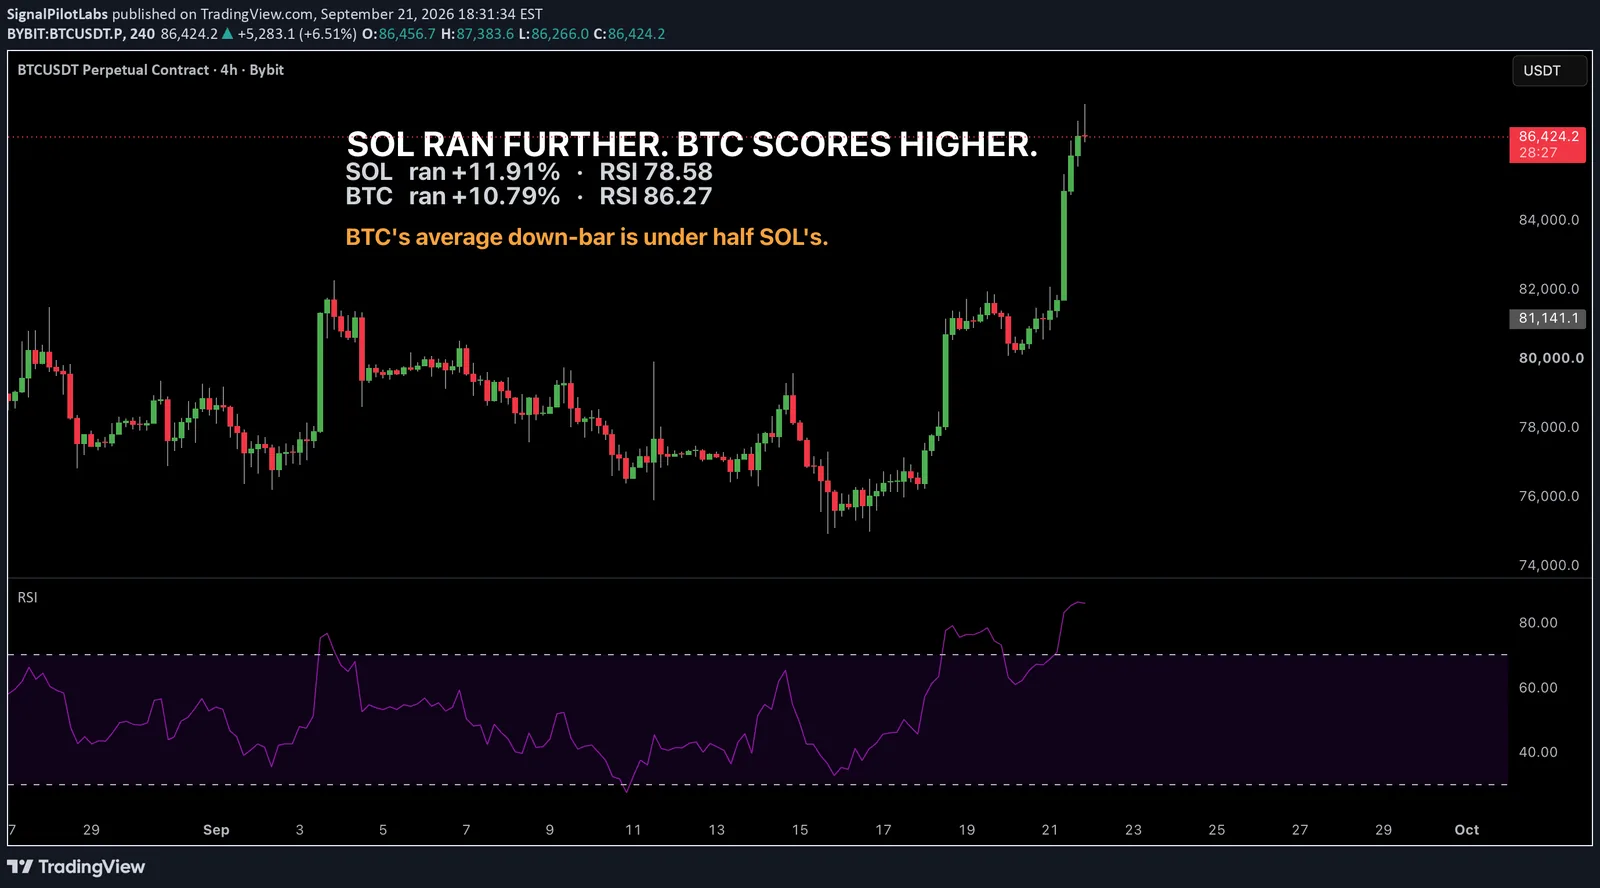
Solana had moved plus 11.91 percent and read 78.58. Bitcoin had moved plus 10.79 percent and read 86.27.
The one that covered more ground scored nearly eight points below the one that covered less. Recomputed at each of the last twelve closed bars, it held on all twelve.
Both sat well above seventy, which the textbook calls overbought. Read plainly, that says Bitcoin was the more stretched of the two. It had moved less.
Why that happens, and it is not a fault in the indicator
RSI is a ratio of average gain to average loss over fourteen bars. It was never a measure of how far price went.
Solana's average up bar was 0.745 percent and its average down bar 0.203 percent, a ratio of 3.669. Bitcoin's average up bar was smaller at 0.571 percent, but its average down bar was far smaller at 0.091 percent, less than half of Solana's, giving a ratio of 6.284.
Feed those ratios back through the formula and they reproduce the two readings exactly: 3.669 gives 78.58, 6.284 gives 86.27, to the second decimal. The arithmetic is the argument here, which is why it is worth showing rather than asserting.
The ratio is what the indicator reads, and the ratio is what separates them. Bitcoin ground higher in small clean steps. Solana covered more ground and gave more of it back along the way.
The window mismatch, stated rather than hidden
There is a subtlety the short-form copy did not carry, and it belongs here.
The move is measured over twenty bars. The oscillator runs over fourteen. Those are different stretches of chart, so telling a reader to rank by both without saying so hands them a confound.
The finding survives a matched window: at fourteen bars Solana still ran further, 7.70 percent against 6.83, and still scored lower, 68.83 against 75.36. But matching the windows is the cleaner test and anyone repeating this should do it that way.
Those last four figures will not reconcile with the two at the top of this page, and they are not meant to. A Wilder smoothed RSI carries far more than fourteen bars of history, so a reading taken over exactly fourteen is a different measure of the same quantity. What carries across the two is the ordering, and the ordering is the claim.
Three ways a cross-check can disagree with you
Your read is wrong. The tool is wrong. Or the tool is answering a different question than the one you asked.
The third is the most common and by far the easiest to miss, because from the outside a disagreement of the third kind looks exactly like information. It carries a number, the number is correct, and the number is about something else.
This was the third kind. Nothing here says Bitcoin was extended or that Solana was not. It says that sorting these two by an oscillator sorts them by how smooth the ride was, and then acting as though you had sorted them by how far they had run is where the mistake enters.
Run it on yours
Take two instruments you already believe are one move, and check that belief with a correlation rather than an impression. Then put a standard oscillator on both, same timeframe, same closed bar, and ideally the same lookback. Rank them by the oscillator. Rank them by the actual move.
If the two rankings disagree, do not reach for which one is right. Work out what each is made of. Here one of them is a ratio of average gain to average loss, and once you know that, the disagreement stops being a signal and becomes a definition.
Caveats
One timeframe, one closed bar, two instruments with a third for context. This is not a measurement of whether RSI predicts anything and there is no edge claimed.
It is also perishable. An earlier cut of this rested on a clean three way ordering across Bitcoin, Ethereum and Solana where the ranking reversed exactly. Twelve hours later Bitcoin had run and that ordering was gone, while the Solana and Bitcoin pair held. A reading is a photograph, not a law.
Observations, not recommendations.
Published as a TradingView Idea on BTCUSDT. View the chart on TradingView
Past measurement of our own tooling, described after the fact. Nothing here is a recommendation or an indication of future results.