Published as a TradingView Idea on BTCUSDT. View the chart on TradingView
There is a piece of trading folklore that says an untouched level is special. The naked point of control, a shelf where enormous volume traded and price has never returned, is supposed to pull price toward it, or stop price at it, or represent unfinished business that the market must eventually settle.
It is an appealing story and it has the shape of something testable, so we tested it.
The experiment the indicator hands you for free
Testing a level is normally hard because of selection. The bars that reach a level are not a random sample of bars. They travelled far enough to get there, which means they were trending or volatile or both. Compare them to ordinary bars and you measure travel, not the level.
A volume profile solves this by accident. It gives you two kinds of level that both require the same travel to reach: the naked point of control, untouched by definition, and the value area edges, revisited constantly. Both are volume levels. Both sit at prices that matter. The only property separating them is whether price has been back.
Compare those two groups and the selection bias is identical on both sides. It cancels. No shuffle required, no synthetic control, no assumptions about what a normal bar looks like.
The design that failed, and why it is the more useful half
The first version used the ordinary weekly POC as the control, and it collapsed so completely that the collapse became the lesson.
The flags a volume profile exposes have uniform-looking names. They are not uniform things. Some fire once, on the bar price arrives. Others stay true for as long as some condition holds. Nothing in the name distinguishes them, and if you mix the two you are comparing an event against a state.
Run lengths on a single symbol over 2,289 bars make the difference obvious:
| flag | bars true | runs | mean run | what it is |
|---|---|---|---|---|
| naked weekly POC | 275 | 263 | 1.05 | clean event |
| weekly value area high | 472 | 304 | 1.55 | event |
| weekly value area low | 308 | 252 | 1.22 | event |
| ordinary weekly POC | 1,747 | 273 | 6.40 | state |
| daily POC | 2,288 | 1 | 2,288 | always on |
The ordinary weekly POC is true on 76 per cent of bars. Using it as a disjoint control deleted almost the entire sample: 103 touches survived out of roughly 10,300. The test never got the chance to be wrong, because it had nothing left to measure.
The fix was to compare the naked POC against the value area edges instead, all three of which are clean events, differing in the one property under test.
If you take nothing else from this: check the run length of a flag before you build anything on it. A mean run above two means you are holding a state, whatever the label says.
What we found
With approach measured over the previous five bars and the outcome over the following ten, across 22 symbols and about 58,000 daily bars:
| group | touches | mean reversal (ATR) | turned price |
|---|---|---|---|
| naked POC | 4,398 | −0.003 | 50.2% |
| value area edges | 19,780 | −0.116 | 47.9% |
The gap is 0.114 ATR. It holds on 15 of the 21 instruments the sweep below covers. p is 0.067.
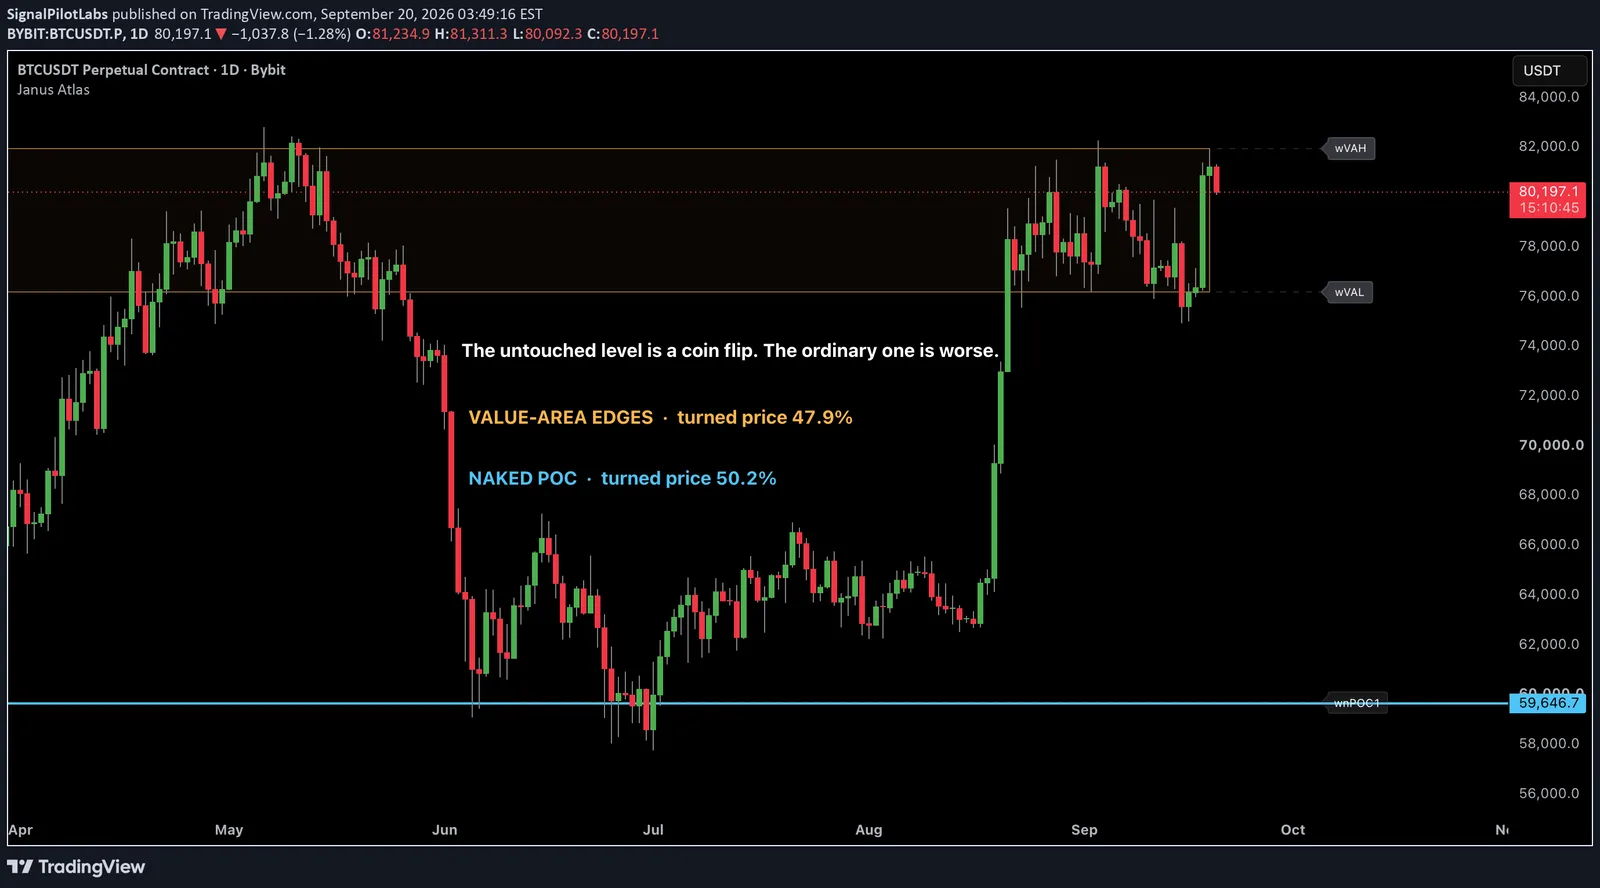
The naked level is a coin flip, and that is the honest description of it. Fifty point two per cent is not an edge and minus 0.003 ATR is not a move.
The result is in the other row. Value area edges turn price less than half the time, which makes them continuation friendly. Price reaches them and carries on. So the ordinary volume level is not neutral, it leans against you, and the untouched one is the member of the family that simply does not.
The folklore says the naked POC is a magnet. It is not. It is the one level that stops making your entry worse.
The parameter that decides the whole thing
Here is the part worth more than the finding.
We swept both the look back, which defines what counts as approaching a level, and the forward horizon, which defines how long you hold. Instruments where the effect holds, out of 21:
| look 3 | look 5 | look 10 | |
|---|---|---|---|
| fwd 3 | 17 | 15 | 14 |
| fwd 5 | 14 | 13 | 9 |
| fwd 10 | 15 | 15 | 10 |
| fwd 20 | 15 | 16 | 11 |
Read it by column, not by row.
The forward horizon does almost nothing. Hold for three bars or twenty and the answer barely moves, which is itself informative: whatever this is, it is not a holding-period effect.
The look back does everything. At three and five bars the effect holds in seven of the eight cells. At ten bars it holds in one of the four. Same data, same levels, same instruments, one knob.
Which means the result is not really about untouched levels. It is about short approaches to untouched levels. A price that has drifted toward the shelf over ten bars gets nothing from it. A price that arrived in three gets something small.
And that is the generalisable part. If your level test survives one look back definition and dies at another, you have not measured the level, you have measured the approach. Most published level tests never state their look back at all.
What this joins
This is the third result in a row pointing the same way.
Level confluence, where several levels agree, turned out to be counterproductive. Stacking systems performed worse than shuffling them. And now untouched levels turn out to be neutral in a family where the ordinary ones are negative.
None of those is a claim that levels do not matter. They are claims that the specific folklore attached to levels, the confluence, the stacking, the magnetism, does not survive a control.
Caveats
Twenty two symbols and one indicator's definition of a volume level. Daily bars only. A p of 0.067 is not significance and we are not going to call it that.
We are publishing the failing column deliberately. Taking the three bar look back, reporting 17 of 21 and leaving the rest out would produce a much better looking post and would be precisely the selection this whole series exists to argue against.
Observations, not recommendations.
Published as a TradingView Idea on BTCUSDT. View the chart on TradingView
Past measurement of our own tooling, described after the fact. Nothing here is a recommendation or an indication of future results.