Published as a TradingView Idea on SOLUSDT. View the chart on TradingView
On 7 October about $41 million of longs were liquidated on Bybit in one hour, and Pentarch printed Momentum Thrust Bearish on Bitcoin and Ether as it happened. We measured 1,121 of those prints on crypto coins over four months. The coin kept falling the next hour less often than its peers, and six hours later the median move was up. Ether on 7 October was the exception, and that’s part of the lesson.
At 01:30 UTC on 7 October the crypto market fell through a floor nobody had announced. Over the next hour about $41 million of long positions were liquidated on Bybit alone. Ether led with $16.6 million, Bitcoin followed with $12.1 million, and the short side barely registered. US index futures moved less than 0.2% in that hour, the dollar index less than 0.1%, and the 10-year Treasury yield didn’t move. No US economic release was scheduled. It was a long squeeze in the Asian morning, with New York and London closed and no move outside crypto to point to.
Pentarch printed Momentum Thrust Bearish on the 1 hour chart of Bitcoin and Ether while it happened.
A print like that reads like the start of something. Momentum is pointing down, hard, and the word “thrust” doesn’t help. So we went back and measured what followed it, every time.
How it was measured
Momentum Thrust Bearish is one of Pentarch’s signals, drawn as an arrow on the chart and available as an alert. It prints on a closed bar when price breaks down through its recent range while ATR, a measure of volatility, is widening.
We took every print on the 1 hour chart across Bybit perpetual futures from 9 June to 1 October 2026. A repeat within three bars counted once, so each run of prints counts as one. That left 1,121 first fires on crypto coins and 263 on stock and commodity contracts.
For each one we asked: did the coin keep falling over the next hour? A share on its own says little, because markets move together. If everything fell that hour, a print that “worked” may just have been the tide. So every print was compared with other coins on the same hour that had a similar run-up over the previous twenty bars, and any coin printing the same event that hour was left out of the comparison.
What followed, on crypto
| Momentum Thrust Bearish, 1 hour chart | Prints | Kept falling 1 hour later | Other coins, same hour | Median move 6 hours later |
|---|---|---|---|---|
| Crypto | 1,121 | 36.2% | 41.5% | +0.61% |
| Stocks and commodities | 263 | 49.8% | 47.6% | +0.00% |
The coin kept falling the next hour 36.2% of the time. The comparison coins fell 41.5% of the time. Six hours later the median move after the print was +0.61%.
The gap held at longer horizons: 39.8% against 42.1% at three hours, 35.5% against 39.2% at six.
So on crypto the bearish thrust more often came late in a push than at its start. A reasonable reading is that by the time downside momentum is strong enough to print, a lot of the forced selling has already happened. In a long squeeze that’s the liquidations themselves. That’s an interpretation, not a measurement.
On stock and commodity contracts the effect wasn’t there: 49.8% against 47.6%, with a flat median. Different market, different behaviour, and we’re only describing crypto.
One example on the chart
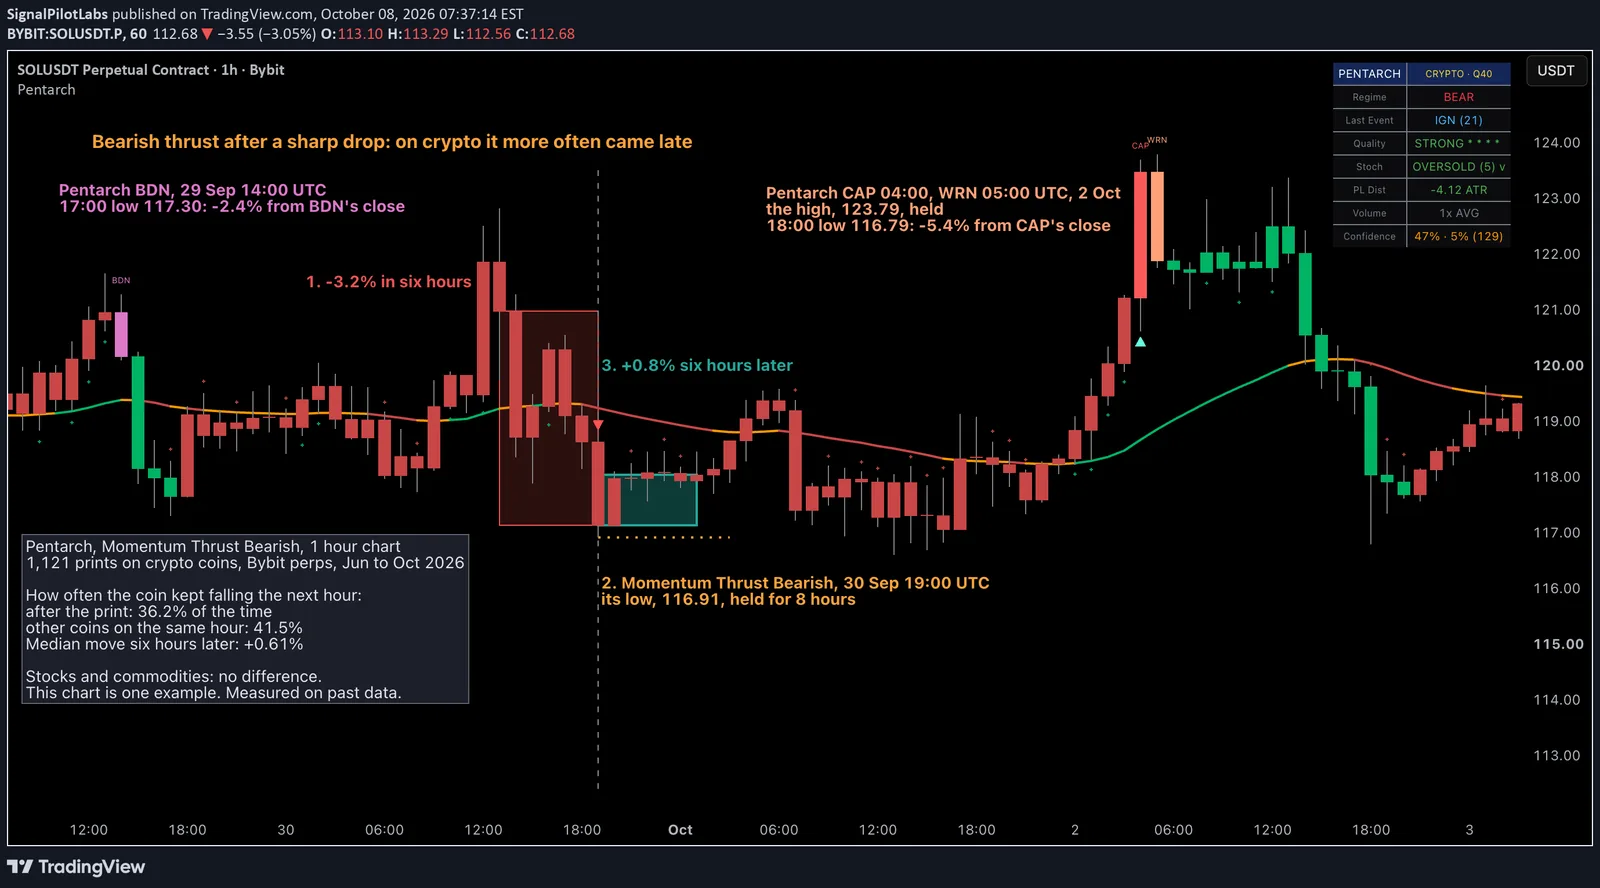
SOL, 1 hour chart, 30 September 2026. From the 13:00 UTC close to the 19:00 UTC close SOL fell from 120.97 to 117.13, 3.2% in six hours. Pentarch printed Momentum Thrust Bearish on the 19:00 bar, the first in more than three bars.
That bar’s low, 116.91, held for the next eight hours and didn’t give way until 13:00 UTC the following afternoon. Six hours after the print SOL closed at 118.04, 0.8% higher.
It’s one example, chosen to show the case clearly. The numbers above cover all 1,121.
And one that went the other way
Ether on 7 October is the honest counterweight. It printed the same thrust on the 01:00 UTC bar, made its flush low of 2,577 an hour later, and by 10:00 UTC had gone lower again, to 2,560. Bitcoin and Solana made lower lows on the same bar.
That’s the 36% side of the number. The print tilts the odds by a few points. It doesn’t mark the bottom, and treating it as if it does is how a measurement turns into a bad habit.
How to use it
- After a sharp drop on a crypto coin, watch Pentarch on the 1 hour chart for Momentum Thrust Bearish.
- Read the first print as a sign the push may be late rather than a fresh start. In the past it more often came near the end of a move.
- Use the print bar’s low as the line to watch. If later bars take it out, as Ether’s did on 7 October, the push wasn’t finished.
- Check which market you’re on. Stock and commodity contracts showed no difference.
How we checked it wasn’t noise
Every test was written down before it ran.
First, a price twin: each print against coins that had made the same move on the same bar, so the result isn’t just “coins that fell bounced”. Second, a volume twin: the same comparison, also matched on volume. Third, we flipped the direction of each hour’s result at random, 2,000 times, to see how often luck alone produces a gap this size. Luck matched it about 2 times in 1,000. The result also pointed the same way in both halves of the window.
It held up in all three. It’s still a measurement of the past.
What this does not tell you
A few points of probability is not a trade. Over one hour the moves are small, and on short holds fees take most of what’s there. It’s one timeframe and about four months of data, measured on data we already had. The comparison with same-hour peers removes the market’s move, but it can’t remove everything those coins had in common.
There’s no entry, stop or target in this, on purpose.
Observations, not recommendations.
We’re Signal Pilot Labs. We build the Elite Seven, seven indicators for TradingView, and we post what we measure, the results that flatter us and the ones that don’t.
See what we build at signalpilot.io.
Published as a TradingView Idea on SOLUSDT. View the chart on TradingView
Past measurement described after the fact. Nothing here is a recommendation or an indication of future results.