Published as a TradingView Idea on TSLA. View the chart on TradingView
How far does a big tech stock move in an ordinary week? We measured the seven largest US tech stocks over the last 52 weeks, from each week’s high to its low, so you know what normal looks like for the stock you hold before calling a week unusual.
What we measured
TradingView 4 hour candles, regular trading hours only, for Apple (AAPL), Microsoft (MSFT), Nvidia (NVDA), Amazon (AMZN), Alphabet (GOOGL), Meta (META) and Tesla (TSLA), with two ETFs as yardsticks: SPY for the S&P 500 and QQQ for the Nasdaq 100. A week runs from Monday’s open to Friday’s close and counts if it has at least three trading days. Its range is the week’s high minus its low, as a percent of where it opened. The last year is the 52 weeks starting 13 October 2025 to 5 October 2026, and the year before is printed beside it, never mixed in.
A normal week
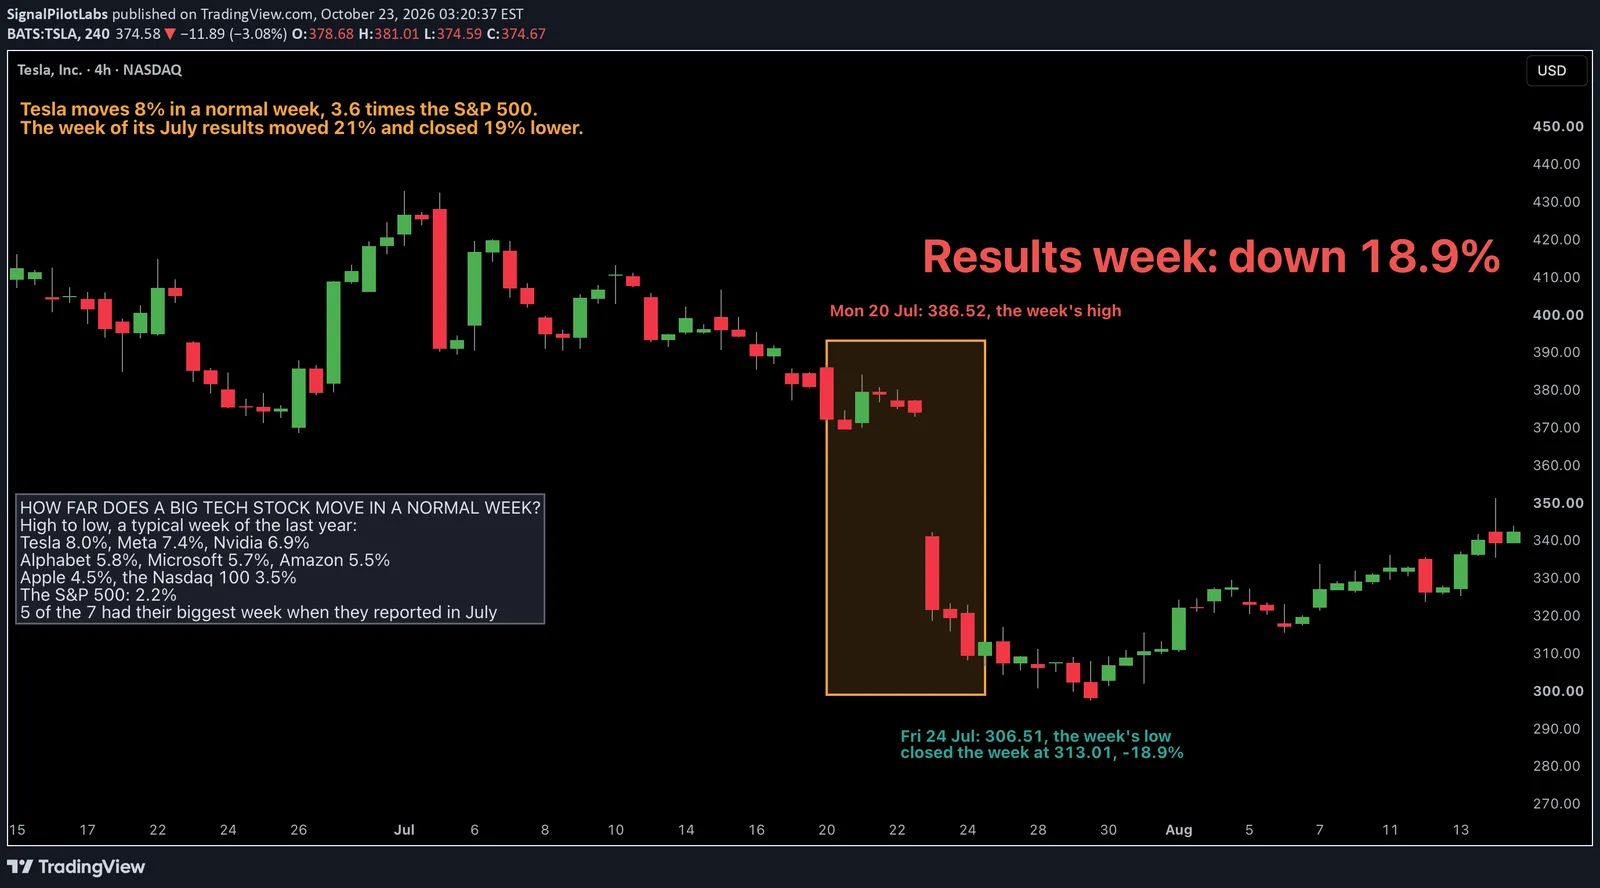
The median weekly range, high to low, was 8.0% for Tesla, 7.4% for Meta and 6.9% for Nvidia. Alphabet’s was 5.8%, Microsoft’s 5.7%, Amazon’s 5.5% and Apple’s 4.5%. QQQ’s was 3.5% and SPY’s 2.2%.
Tesla’s normal week is 3.6 times the S&P 500’s. Even Apple, the calmest of the seven, moves about twice as far. The S&P 500 moved more than 5% in one week of the 52; Tesla did in 49 of them.
| Stock | Median weekly range (%) | One week in ten, at least (%) | Weeks over 5% (of 52) | Weeks over 10% (of 52) | Median close vs open (%) | Biggest week | Its range (%) | Its close vs open (%) | The year before: median range (%) |
|---|---|---|---|---|---|---|---|---|---|
| TSLA | 8.0 | 11.7 | 49 | 11 | 3.0 | 20 Jul 2026 | 20.7 | -18.9 | 10.7 |
| META | 7.4 | 13.6 | 39 | 14 | 3.9 | 6 Jul 2026 | 16.9 | +12.5 | 5.9 |
| NVDA | 6.9 | 11.5 | 46 | 12 | 3.6 | 3 Nov 2025 | 15.6 | -9.5 | 7.3 |
| GOOGL | 5.8 | 10.3 | 32 | 7 | 2.6 | 20 Jul 2026 | 12.8 | -8.9 | 5.8 |
| MSFT | 5.7 | 8.9 | 32 | 4 | 2.5 | 27 Jul 2026 | 20.2 | +19.1 | 3.6 |
| AMZN | 5.5 | 8.8 | 35 | 4 | 2.6 | 27 Jul 2026 | 20.0 | +15.2 | 5.5 |
| AAPL | 4.5 | 8.4 | 19 | 2 | 1.9 | 27 Jul 2026 | 13.3 | -7.7 | 4.2 |
| QQQ | 3.5 | 5.8 | 14 | 0 | 1.5 | 13 Apr 2026 | 6.9 | +6.4 | 3.2 |
| SPY | 2.2 | 4.4 | 1 | 0 | 0.9 | 13 Apr 2026 | 5.3 | +4.8 | 2.4 |
The median is not the whole story. Meta’s normal week is smaller than Tesla’s, but Meta moved more than 10% in 14 weeks and Tesla in 11. One week in ten, Meta moved 13.6% or more.
Where the week closed is a smaller number than how far it travelled. The median close-to-open move was 3.0% for Tesla, 3.9% for Meta, 3.6% for Nvidia and 1.9% for Apple. SPY’s was 0.9%.
We measured the same thing on metals in our post on gold, silver and copper, where gold’s normal week is 5.1%.
Normal changes
The year before (weeks from 14 October 2024), Tesla’s median was 10.7% and Microsoft’s 3.6%. This year Tesla calmed to 8.0%, and Microsoft’s normal week grew to 5.7%, past Amazon and Apple. SPY went from 2.4% to 2.2%.
The chart: Tesla, June to August 2026, the week of 20 July shaded
Tesla opened the week at 385.99 and made its high, 386.52, on Monday. It reported its quarterly results after the close on Wednesday 22 July. On Thursday it opened at 341.03, 8.9% under Wednesday’s close of 374.17, and closed the day 14.6% lower. It reached 306.51 on Friday and closed the week at 313.01: a 20.7% range, down 18.9%, in a stock whose normal week is 8.0%.
Results weeks
Five of the seven had their biggest week of the year in the week they reported in July. Alphabet reported the same evening as Tesla and closed 7.2% lower the next day. Microsoft reported on 29 July and closed 15.1% higher the next day. Amazon and Apple reported on 30 July: the next day Amazon closed 15.0% higher and Apple 7.4% lower.
The other two: Meta’s biggest week was the week of 6 July 2026, and Nvidia’s the week of 3 November 2025.
How to check it on your own chart
- Open the stock on a 4 hour chart with regular trading hours and take one week, from Monday’s open to Friday’s close.
- Take the week’s high minus its low and divide by the week’s open.
- Compare it with the table: about 8% for Tesla, 4.5% for Apple, 2.2% for the S&P 500. Twice the median was a big week.
- Note when the stock reports its results. Five of the seven had their biggest week of the year then.
What this does not tell you
What next week will do, or which way. 52 weeks is one year. A median says what usually happens, and a results week is the kind of week it does not cover.
What it’s good for is knowing the size of an ordinary week for the stock you hold, and when its results are due.
Observations, not recommendations.
We’re Signal Pilot Labs. We build the Elite Seven, seven indicators for TradingView, and we post what we measure, including the parts that didn’t work.
See what we build at signalpilot.io.
Published as a TradingView Idea on TSLA. View the chart on TradingView
Past measurement described after the fact. Nothing here is a recommendation or an indication of future results.