Published as a TradingView Idea on BTCUSDT. View the chart on TradingView
A 20% drop feels temporary. For some coins it was. For others the old high never came back. Every one of the 50 most traded coins is in the table below, so you can find yours.
What we measured
The 50 most traded crypto perpetuals on Bybit, ranked by turnover from 11 September to 10 October 2026. Daily closes from January 2024 to 13 October 2026, or from the listing day for newer coins. A drop is the first day a coin closed 20% or more below its highest close of the previous 30 days. It is won back on the first close at that high again, and a new drop can only start after the last one was won back. We scored only drops that began by 13 October 2025, so every one had at least a year. The rules were written down before the run.
How often it came back
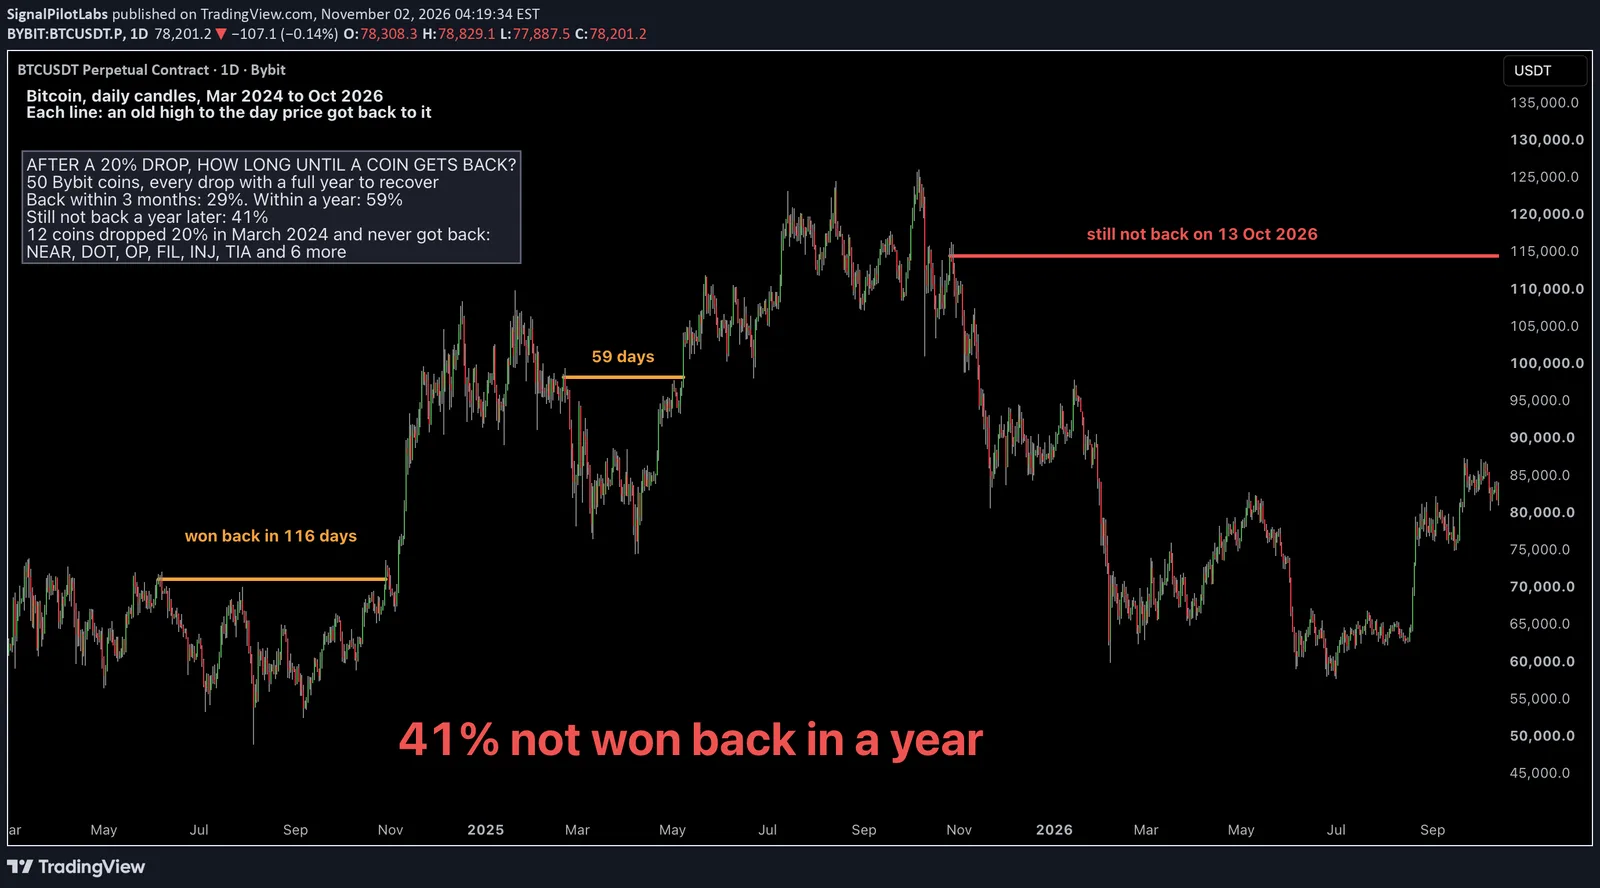
102 drops. 18% were won back within a month, 29% within three months and 59% within a year. The other 41% were still below the old high a year later. When one came back within the year, the median wait was 91 days.
Three came back after more than a year: ETH after 508 days, VVV after 417 and QNT after 649. The other 39 were still not back on 13 October 2026.
The ones that never came back
18 coins had a single 20% drop in the whole period and have not closed at the old high since. 12 of them fell in March 2024: NEAR, DOT, OP, FIL, INJ, TIA, ARB, TAO, STRK, LSK, MOVR and RLC. Two and a half years on, not one has been back. NEAR’s old high was 8.878, DOT’s 11.574 and OP’s 4.7027.
The big three
BTC won back its July 2024 drop in 116 days and its March 2025 drop in 59. Its November 2025 drop, from 114,498, was still not back on 13 October 2026. ETH took 508 days to win back its March 2024 drop. SOL took 212 days, then 30, and its February 2025 drop is still not back.
| Coin | Drops scored | Won back within 3 months | Won back within a year | Not back within a year | Median days to win back |
|---|---|---|---|---|---|
| BTC | 2 | 1 | 2 | 0 | 87.5 |
| ETH | 2 | 0 | 0 | 2 | 508 |
| SOL | 3 | 1 | 2 | 1 | 121 |
| XRP | 4 | 1 | 3 | 1 | 165 |
| ZEC | 5 | 3 | 5 | 0 | 71 |
| NEAR | 1 | 0 | 0 | 1 | |
| HYPE | 4 | 2 | 4 | 0 | 88 |
| DOGE | 3 | 1 | 2 | 1 | 115.5 |
| ENA | 1 | 0 | 0 | 1 | |
| SUI | 4 | 2 | 3 | 1 | 23 |
| ONDO | 4 | 2 | 3 | 1 | 48 |
| PUMPFUN | 2 | 1 | 1 | 1 | 35 |
| ADA | 2 | 0 | 1 | 1 | 246 |
| 1000PEPE | 4 | 2 | 3 | 1 | 59 |
| QNT | 2 | 0 | 1 | 1 | 442 |
| WLD | 2 | 1 | 1 | 1 | 4 |
| UNI | 2 | 0 | 1 | 1 | 263 |
| LSK | 1 | 0 | 0 | 1 | |
| AKE | 0 | 0 | 0 | 0 | |
| ARB | 1 | 0 | 0 | 1 | |
| AVAX | 1 | 0 | 0 | 1 | |
| LINK | 2 | 0 | 1 | 1 | 258 |
| TAO | 1 | 0 | 0 | 1 | |
| AAVE | 4 | 2 | 3 | 1 | 2 |
| LTC | 4 | 2 | 3 | 1 | 30 |
| HBAR | 4 | 2 | 3 | 1 | 39 |
| BNB | 2 | 0 | 2 | 0 | 163 |
| XPL | 1 | 0 | 0 | 1 | |
| SAND | 2 | 0 | 1 | 1 | 263 |
| TRUMP | 1 | 0 | 0 | 1 | |
| STRK | 1 | 0 | 0 | 1 | |
| BCH | 2 | 1 | 1 | 1 | 22 |
| XLM | 2 | 0 | 1 | 1 | 242 |
| ZRO | 2 | 0 | 1 | 1 | 122 |
| USELESS | 1 | 1 | 1 | 0 | 65 |
| FARTCOIN | 1 | 0 | 0 | 1 | |
| PENGU | 2 | 0 | 1 | 1 | 192 |
| XMR | 4 | 2 | 4 | 0 | 86.5 |
| APT | 1 | 0 | 0 | 1 | |
| INJ | 1 | 0 | 0 | 1 | |
| VVV | 1 | 0 | 0 | 1 | 417 |
| BR | 1 | 0 | 1 | 0 | 361 |
| DOT | 1 | 0 | 0 | 1 | |
| OP | 1 | 0 | 0 | 1 | |
| MOVR | 1 | 0 | 0 | 1 | |
| RLC | 1 | 0 | 0 | 1 | |
| FIL | 1 | 0 | 0 | 1 | |
| TIA | 1 | 0 | 0 | 1 | |
| DASH | 2 | 0 | 2 | 0 | 292 |
| AERO | 4 | 3 | 3 | 1 | 17 |
The chart
BTC, daily, since March 2024. Each line runs from the old high to the day it was won back. The red one is still running.
How often the same coins print a 10% wick in a day is in our post on 10% wick days, with AKE at 91 days and Bitcoin at none.
What this does not tell you
What comes next. The old high here is the highest close of the 30 days before the drop, not the all-time high. Coins listed after 2024 had fewer drops to score. Past data, one exchange, daily closes.
What it’s good for is testing the idea that a coin always comes back. Within a year, 59% of these drops did.
Observations, not recommendations.
We’re Signal Pilot Labs. We build the Elite Seven, seven indicators for TradingView, and we post what we measure, including the parts that didn’t work.
See what we build at signalpilot.io.
Published as a TradingView Idea on BTCUSDT. View the chart on TradingView
Past measurement described after the fact. Nothing here is a recommendation or an indication of future results.