Published as a TradingView Idea on AKEUSDT. View the chart on TradingView
A 10% wick is a day when price ran 10% away from the open and came back before the close. On some coins it is a weekly event. On Bitcoin it didn’t happen once in a year. Every one of the 50 most traded coins is in the table below, so you can find yours.
What we measured
The 50 most traded crypto perpetuals on Bybit, ranked by turnover from 11 September to 10 October 2026, each listed for the whole year. Daily candles, UTC, 14 October 2025 to 13 October 2026: 365 days per coin. A wick is the part of a candle beyond its body. A 10% wick day is one where the upper or the lower wick is 10% of the open or more. A day that falls 10% and closes there has a body, not a wick, and doesn’t count: the point is price going there and coming back. The rules were written down before the run.
Where it happens most
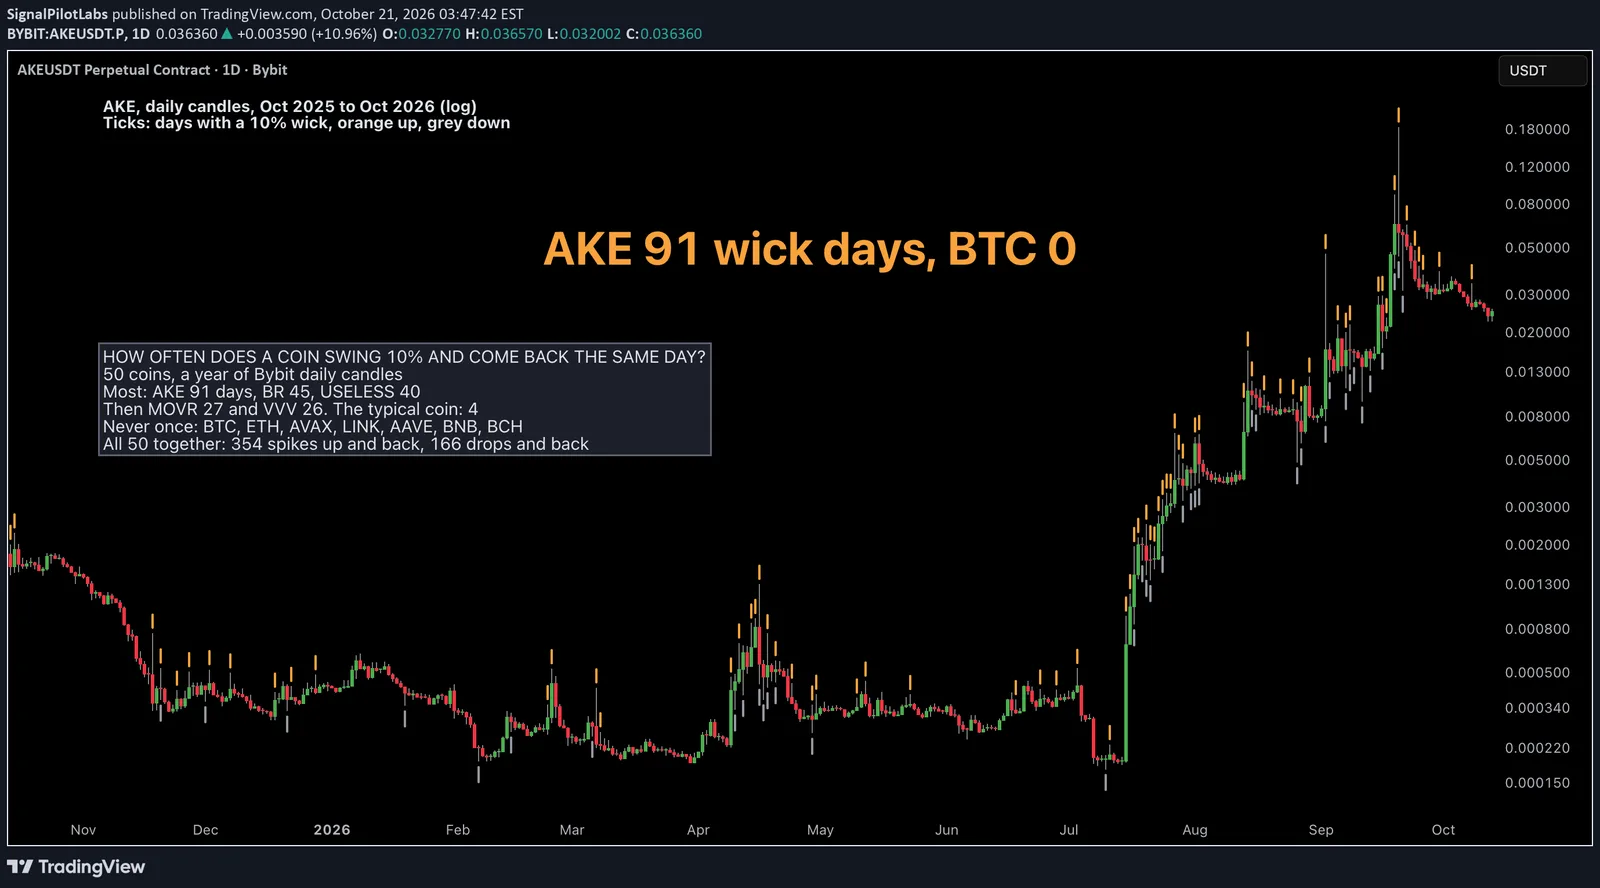
AKE: 91 days, about one day in four, with 72 upper wicks and 39 lower ones (some days had both). Then BR 45, USELESS 40, MOVR 27 and VVV 26. The median coin had 4.
Where it never happened
BTC, ETH, AVAX, LINK, AAVE, BNB and BCH: not one 10% wick all year. Bitcoin’s low was 10% under its open on only 2 days, 31 January and 5 February 2026, and it still closed 6.6% and 14.0% down: a body, not a wick.
Mostly up
Across all 50 coins there were 354 upper wicks and 166 lower ones. A spike that faded was more than twice as common as a flush that recovered.
| Coin | 10% wick days | Upper wick days | Lower wick days | Days the low was 10% under the open |
|---|---|---|---|---|
| AKE | 91 | 72 | 39 | 98 |
| BR | 45 | 38 | 16 | 59 |
| USELESS | 40 | 27 | 15 | 91 |
| MOVR | 27 | 24 | 5 | 36 |
| VVV | 26 | 18 | 8 | 44 |
| LSK | 24 | 22 | 3 | 25 |
| ZEC | 21 | 12 | 9 | 36 |
| XPL | 16 | 10 | 6 | 44 |
| DASH | 15 | 14 | 3 | 27 |
| FARTCOIN | 14 | 8 | 7 | 51 |
| STRK | 14 | 11 | 3 | 26 |
| WLD | 13 | 9 | 6 | 31 |
| ZRO | 13 | 11 | 3 | 18 |
| ENA | 8 | 5 | 3 | 19 |
| TIA | 8 | 5 | 3 | 18 |
| TRUMP | 8 | 6 | 2 | 18 |
| TAO | 7 | 2 | 5 | 20 |
| UNI | 7 | 5 | 2 | 17 |
| RLC | 7 | 7 | 0 | 10 |
| PUMPFUN | 6 | 2 | 4 | 38 |
| NEAR | 5 | 3 | 2 | 21 |
| QNT | 5 | 4 | 2 | 10 |
| SAND | 5 | 4 | 2 | 17 |
| ARB | 5 | 4 | 1 | 20 |
| ONDO | 4 | 1 | 3 | 14 |
| PENGU | 4 | 2 | 2 | 21 |
| FIL | 4 | 3 | 1 | 24 |
| XMR | 4 | 4 | 0 | 9 |
| AERO | 4 | 4 | 0 | 18 |
| HYPE | 3 | 2 | 1 | 14 |
| APT | 3 | 2 | 1 | 16 |
| INJ | 3 | 2 | 1 | 16 |
| XLM | 3 | 3 | 0 | 5 |
| SUI | 2 | 1 | 1 | 14 |
| ADA | 2 | 1 | 1 | 11 |
| OP | 2 | 1 | 1 | 17 |
| XRP | 2 | 2 | 0 | 5 |
| HBAR | 2 | 2 | 0 | 6 |
| SOL | 1 | 0 | 1 | 7 |
| DOGE | 1 | 0 | 1 | 6 |
| 1000PEPE | 1 | 1 | 1 | 15 |
| LTC | 1 | 0 | 1 | 4 |
| DOT | 1 | 0 | 1 | 10 |
| BTC | 0 | 0 | 0 | 2 |
| ETH | 0 | 0 | 0 | 5 |
| AVAX | 0 | 0 | 0 | 11 |
| LINK | 0 | 0 | 0 | 8 |
| AAVE | 0 | 0 | 0 | 15 |
| BNB | 0 | 0 | 0 | 6 |
| BCH | 0 | 0 | 0 | 12 |
The chart
AKE, daily, on a log scale, because it went from 0.00017 to 0.185 inside the year. Every 10% wick day is marked: orange over an upper wick, grey under a lower one.
How far each coin dips before a move works, in percent and in ATR, is in our post on how far your coin dips, with the same 50 coins.
What this does not tell you
Which way comes next, or why. Daily candles close at 00:00 UTC, so a wick on one clock can be a body on another. One year, one exchange.
What it’s good for is placing a stop. On AKE, price was 10% under the day’s open on 98 days of the year. On Bitcoin, 2.
Observations, not recommendations.
We’re Signal Pilot Labs. We build the Elite Seven, seven indicators for TradingView, and we post what we measure, including the parts that didn’t work.
See what we build at signalpilot.io.
Published as a TradingView Idea on AKEUSDT. View the chart on TradingView
Past measurement described after the fact. Nothing here is a recommendation or an indication of future results.