Published as a TradingView Idea on SPX. View the chart on TradingView
Every year has a bad week. We measured how bad, for the S&P 500, the Nasdaq 100 and the Russell 2000, every year since 1988, so you know what an ordinary bad week looks like before the next one arrives.
What we measured
TradingView’s weekly candles for the three indices. A week’s move is its close against the previous week’s close, and a week belongs to the year it opens in. For each year from 1988, the first year all three have in full, to 2025, we took each index’s worst week. The rules were written down before the run.
The worst week of a year
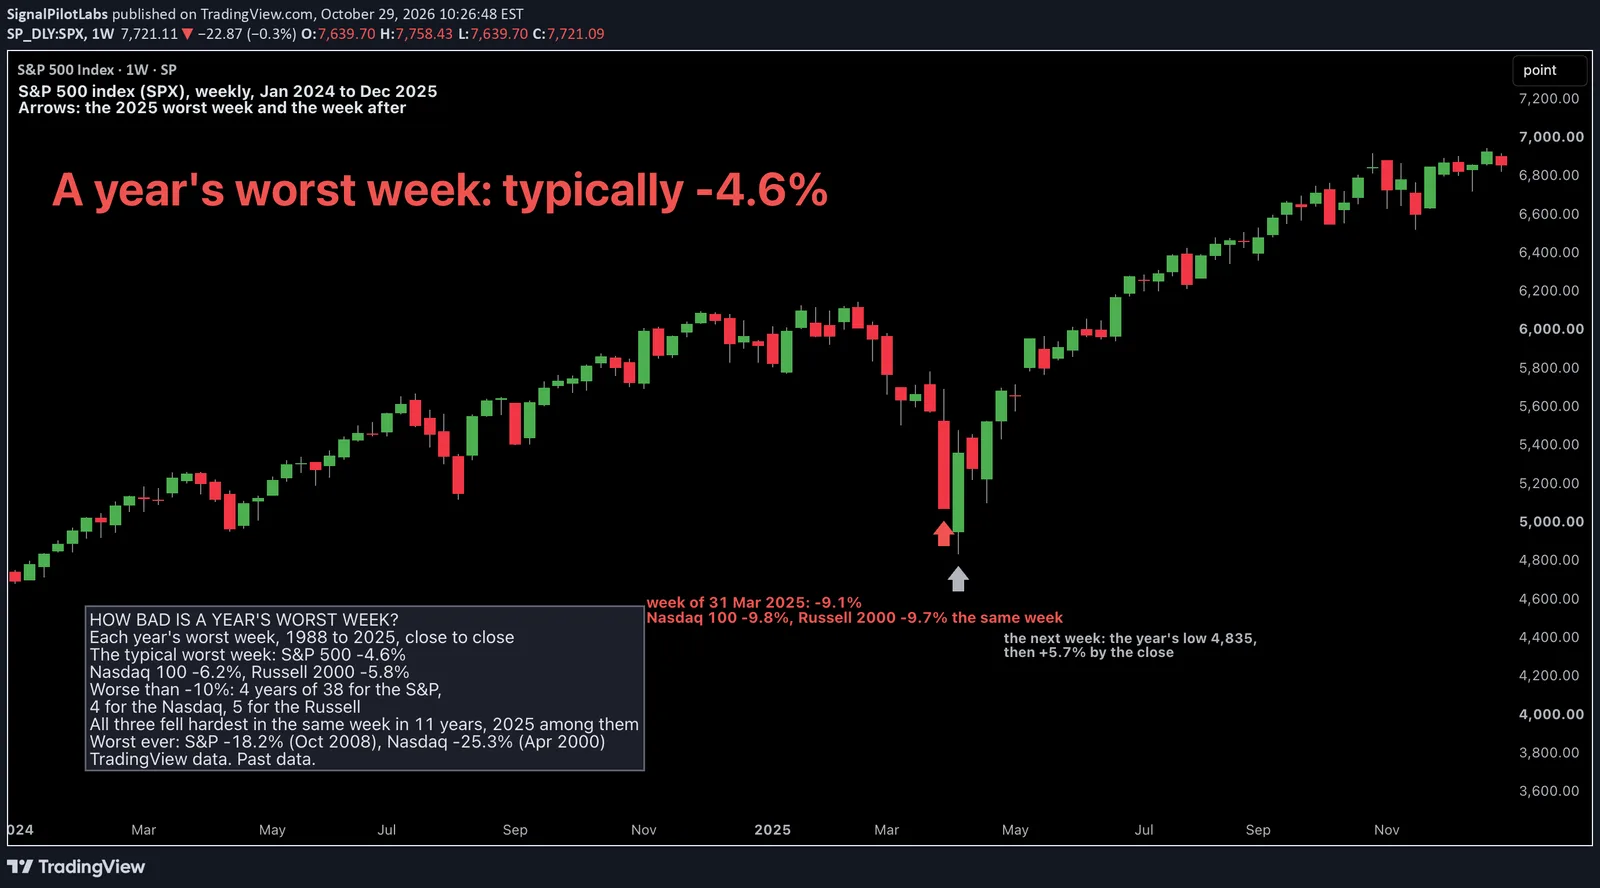
Over the 38 years, the median worst week was -4.6% for the S&P 500, -6.2% for the Nasdaq 100 and -5.8% for the Russell 2000. So in a typical year, the S&P 500’s worst week cost about 4.6%. The Nasdaq 100 and the small caps went deeper.
| Index, 1988 to 2025 | Median worst week (%) | Worst ever (%) | Worst ever, week of | Mildest worst week (%) | Years below -5% | Years below -10% |
|---|---|---|---|---|---|---|
| S&P 500 | -4.6 | -18.2 | 6 Oct 2008 | -1.3 | 16 | 4 |
| Nasdaq 100 | -6.2 | -25.3 | 10 Apr 2000 | -2.7 | 27 | 4 |
| Russell 2000 | -5.8 | -16.5 | 9 Mar 2020 | -2.2 | 25 | 5 |
The worst weeks in this span were -18.2% for the S&P 500, in the week of 6 October 2008, -25.3% for the Nasdaq 100, in the week of 10 April 2000, and -16.5% for the Russell 2000, in the week of 9 March 2020. A worst week deeper than -10% came in only 4 or 5 of the 38 years. The calmest year’s worst week was -1.3% for the S&P 500, in 1995.
Together or apart
All three had their worst week of the year in the same week in 11 of the 38 years: the big shocks like 2000, 2001, 2008 and 2025, but also quieter years like 2012 and 2013. In the other 27 years, each index had its own worst week.
Every year
Each index’s worst week of each year, by the week’s opening date, and whether all three fell in the same week.
| Year | S&P 500, week of | S&P 500 (%) | Nasdaq 100, week of | Nasdaq 100 (%) | Russell 2000, week of | Russell 2000 (%) | Same week |
|---|---|---|---|---|---|---|---|
| 1988 | 21 Mar 1988 | -4.7 | 21 Mar 1988 | -4.5 | 8 Aug 1988 | -2.2 | |
| 1989 | 9 Oct 1989 | -7.0 | 23 Oct 1989 | -5.3 | 9 Oct 1989 | -4.2 | |
| 1990 | 20 Aug 1990 | -5.0 | 8 Oct 1990 | -6.5 | 20 Aug 1990 | -7.8 | |
| 1991 | 3 Jun 1991 | -2.7 | 11 Nov 1991 | -3.7 | 24 Jun 1991 | -2.9 | |
| 1992 | 21 Sep 1992 | -2.0 | 23 Mar 1992 | -4.9 | 15 Jun 1992 | -3.2 | |
| 1993 | 19 Apr 1993 | -2.7 | 15 Nov 1993 | -3.7 | 15 Feb 1993 | -3.4 | |
| 1994 | 20 Jun 1994 | -3.4 | 20 Jun 1994 | -5.4 | 28 Mar 1994 | -5.8 | |
| 1995 | 23 Oct 1995 | -1.3 | 17 Jul 1995 | -6.1 | 2 Oct 1995 | -2.8 | |
| 1996 | 8 Apr 1996 | -2.9 | 26 Feb 1996 | -5.9 | 8 Jul 1996 | -4.7 | |
| 1997 | 11 Aug 1997 | -3.5 | 8 Dec 1997 | -8.6 | 8 Dec 1997 | -3.5 | |
| 1998 | 31 Aug 1998 | -5.2 | 28 Sep 1998 | -8.2 | 24 Aug 1998 | -9.4 | |
| 1999 | 11 Oct 1999 | -6.6 | 12 Apr 1999 | -6.5 | 20 Sep 1999 | -4.0 | |
| 2000 | 10 Apr 2000 | -11.2 | 10 Apr 2000 | -25.3 | 10 Apr 2000 | -16.4 | ✓ |
| 2001 | 17 Sep 2001 | -11.6 | 17 Sep 2001 | -17.5 | 17 Sep 2001 | -14.0 | ✓ |
| 2002 | 15 Jul 2002 | -8.0 | 22 Apr 2002 | -9.7 | 15 Jul 2002 | -6.6 | |
| 2003 | 21 Jan 2003 | -4.5 | 13 Jan 2003 | -6.4 | 22 Sep 2003 | -6.7 | |
| 2004 | 2 Aug 2004 | -3.4 | 26 Apr 2004 | -6.4 | 2 Aug 2004 | -5.7 | |
| 2005 | 11 Apr 2005 | -3.3 | 11 Apr 2005 | -5.2 | 3 Jan 2005 | -5.9 | |
| 2006 | 5 Jun 2006 | -2.8 | 10 Jul 2006 | -4.7 | 8 May 2006 | -5.0 | |
| 2007 | 23 Jul 2007 | -4.9 | 5 Nov 2007 | -8.1 | 23 Jul 2007 | -7.0 | |
| 2008 | 6 Oct 2008 | -18.2 | 6 Oct 2008 | -13.7 | 6 Oct 2008 | -15.6 | ✓ |
| 2009 | 2 Mar 2009 | -7.0 | 17 Feb 2009 | -5.2 | 2 Mar 2009 | -9.8 | |
| 2010 | 3 May 2010 | -6.4 | 3 May 2010 | -7.6 | 3 May 2010 | -8.9 | ✓ |
| 2011 | 1 Aug 2011 | -7.2 | 1 Aug 2011 | -7.1 | 1 Aug 2011 | -10.3 | ✓ |
| 2012 | 14 May 2012 | -4.3 | 14 May 2012 | -5.3 | 14 May 2012 | -5.4 | ✓ |
| 2013 | 15 Apr 2013 | -2.1 | 15 Apr 2013 | -2.7 | 15 Apr 2013 | -3.2 | ✓ |
| 2014 | 8 Dec 2014 | -3.5 | 6 Oct 2014 | -3.9 | 6 Oct 2014 | -4.7 | |
| 2015 | 17 Aug 2015 | -5.8 | 17 Aug 2015 | -7.4 | 7 Dec 2015 | -5.1 | |
| 2016 | 4 Jan 2016 | -6.0 | 4 Jan 2016 | -7.0 | 4 Jan 2016 | -7.9 | ✓ |
| 2017 | 20 Mar 2017 | -1.4 | 26 Jun 2017 | -2.7 | 7 Aug 2017 | -2.7 | |
| 2018 | 17 Dec 2018 | -7.1 | 17 Dec 2018 | -8.3 | 17 Dec 2018 | -8.4 | ✓ |
| 2019 | 29 Jul 2019 | -3.1 | 29 Jul 2019 | -4.0 | 4 Mar 2019 | -4.3 | |
| 2020 | 16 Mar 2020 | -15.0 | 16 Mar 2020 | -12.5 | 9 Mar 2020 | -16.5 | |
| 2021 | 25 Jan 2021 | -3.3 | 22 Feb 2021 | -4.9 | 12 Jul 2021 | -5.1 | |
| 2022 | 13 Jun 2022 | -5.8 | 18 Jan 2022 | -7.5 | 18 Jan 2022 | -8.1 | |
| 2023 | 6 Mar 2023 | -4.5 | 6 Mar 2023 | -3.7 | 6 Mar 2023 | -8.1 | ✓ |
| 2024 | 3 Sep 2024 | -4.2 | 3 Sep 2024 | -5.9 | 29 Jul 2024 | -6.7 | |
| 2025 | 31 Mar 2025 | -9.1 | 31 Mar 2025 | -9.8 | 31 Mar 2025 | -9.7 | ✓ |
| 2026, to 23 October | 1 Jun 2026 | -2.6 | 12 Oct 2026 | -5.5 | 2 Mar 2026 | -4.1 |
Recent years
In 2022 the worst weeks were -5.8% for the S&P 500, -7.5% for the Nasdaq 100 and -8.1% for the Russell 2000. In 2023 they were -4.5%, -3.7% and -8.1%, all in the week of the SVB collapse. In 2024 they were -4.2%, -5.9% and -6.7%. In 2025 they were -9.1%, -9.8% and -9.7%, all in the tariff week of 31 March. So far in 2026, to 23 October, they are -2.6%, -5.5% and -4.1%.
The chart: the S&P 500 in 2024 and 2025
The tariff week took the S&P 500 from 5,580.95 to 5,074.09, down 9.1%. The next week it made the year’s low, 4,835.04, and still closed 5.7% higher, at 5,363.35. By December it was near 6,900.
How far big tech moves in a normal week, high to low, is in our post on big tech’s normal week, one company at a time.
The SPX’s new all-time highs, and the month after each, are in our post on new highs since 1988, counted month by month.
What this does not tell you
When the next bad week comes or how deep it goes. A median says what a typical year held; a few years held far worse. Past data.
What it is good for is sizing: in half of these years the S&P 500 had a week of -4.6% or worse, and the Nasdaq 100 a week of -6.2% or worse.
Observations, not recommendations.
We’re Signal Pilot Labs. We build the Elite Seven, seven indicators for TradingView, and we post what we measure, including the parts that didn’t work.
See what we build at signalpilot.io.
Published as a TradingView Idea on SPX. View the chart on TradingView
Past measurement described after the fact. Nothing here is a recommendation or an indication of future results.