Published as a TradingView Idea on SPX. View the chart on TradingView
An all-time high in the S&P 500 makes headlines, and some read it as a top. We counted how often the index makes one, and what the next month did, from January 1988 to September 2026.
What we measured
TradingView daily closes for the S&P 500 (SP:SPX), price only, without dividends, from 1978, so every high is read against the whole record. A new high is a daily close above every close before it. A new-high month is a calendar month with at least one. For every month, we took the next month’s change and split the months by whether they had a new high.
What we found
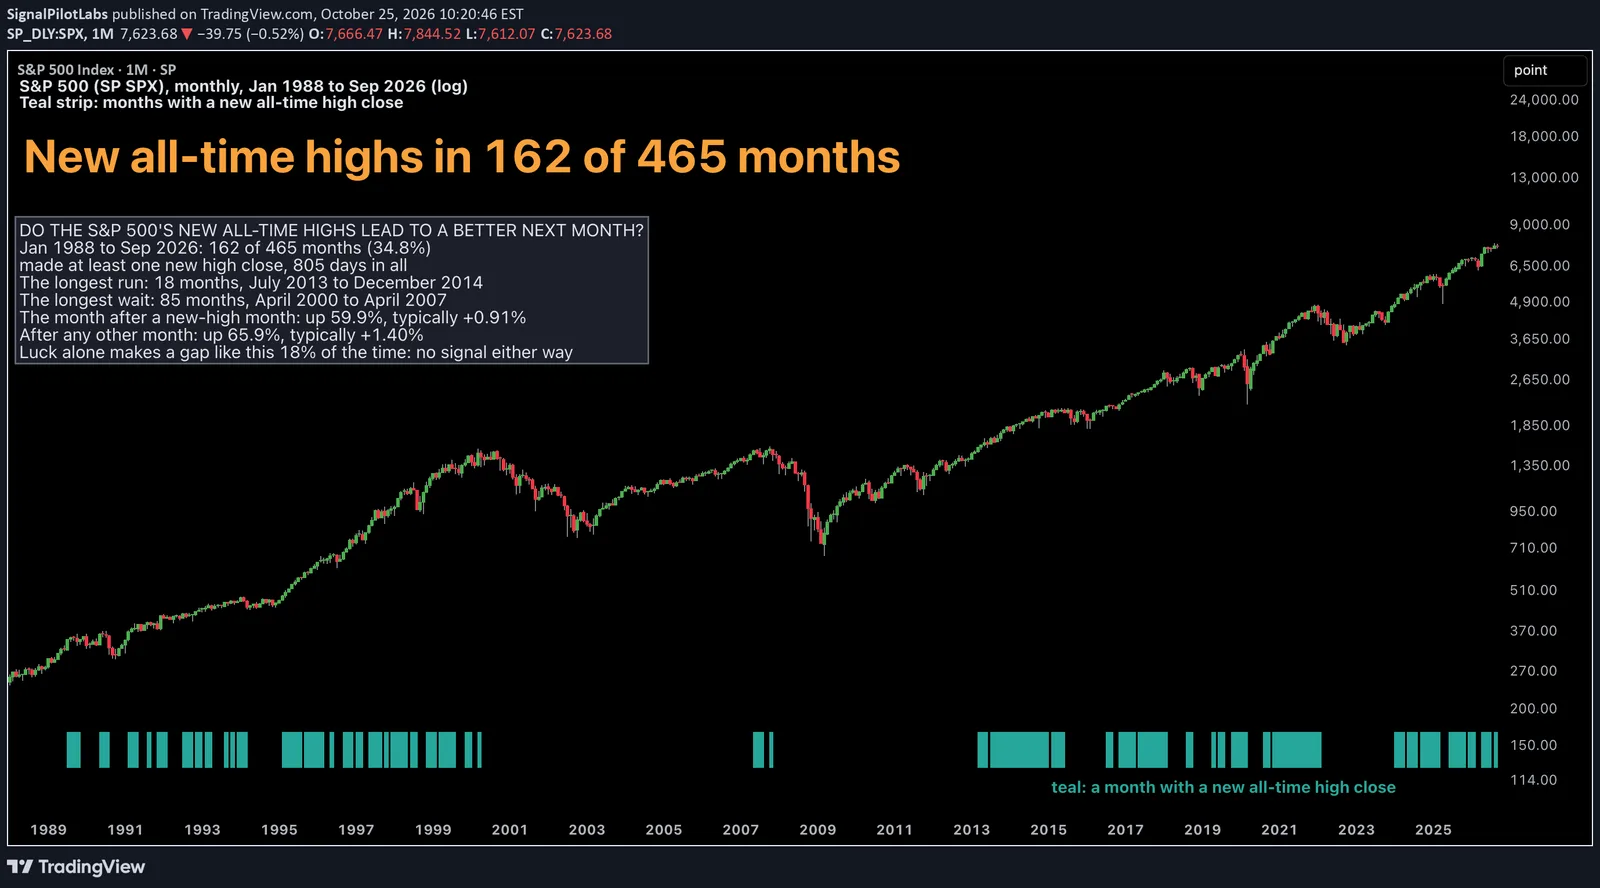
162 of the 465 months had at least one new all-time closing high, 34.8%, and there were 805 such days in all.
They bunch. Every month of 2014 and of 2021 had one; no month from 2001 to 2006 or from 2008 to 2012 did. The longest run was 18 months in a row, July 2013 to December 2014. The longest wait was 85 months, April 2000 to April 2007. They came more often since 2007: 95 of 237 months, or 40.1%, against 67 of 228, or 29.4%, from 1988 to 2006.
After a new-high month, the S&P rose the next month 59.9% of the time, with a median of +0.91%. After any other month it rose 65.9% of the time, with a median of +1.40%.
| Year | Months with a new high | New-high days |
|---|---|---|
| 1988 | 0 | 0 |
| 1989 | 4 | 13 |
| 1990 | 3 | 6 |
| 1991 | 6 | 22 |
| 1992 | 6 | 18 |
| 1993 | 5 | 16 |
| 1994 | 2 | 5 |
| 1995 | 10 | 77 |
| 1996 | 6 | 39 |
| 1997 | 8 | 45 |
| 1998 | 8 | 47 |
| 1999 | 8 | 35 |
| 2000 | 1 | 4 |
| 2001 | 0 | 0 |
| 2002 | 0 | 0 |
| 2003 | 0 | 0 |
| 2004 | 0 | 0 |
| 2005 | 0 | 0 |
| 2006 | 0 | 0 |
| 2007 | 4 | 9 |
| 2008 | 0 | 0 |
| 2009 | 0 | 0 |
| 2010 | 0 | 0 |
| 2011 | 0 | 0 |
| 2012 | 0 | 0 |
| 2013 | 9 | 45 |
| 2014 | 12 | 53 |
| 2015 | 4 | 10 |
| 2016 | 4 | 18 |
| 2017 | 11 | 62 |
| 2018 | 3 | 19 |
| 2019 | 6 | 35 |
| 2020 | 6 | 33 |
| 2021 | 12 | 70 |
| 2022 | 1 | 1 |
| 2023 | 0 | 0 |
| 2024 | 10 | 57 |
| 2025 | 8 | 39 |
| 2026 | 5 | 27 |
Is it luck?
We shuffled the new-high labels across the months 10,000 times. A gap at least that far from zero came up 18% of the time. Both halves leaned the same way, -0.43 and -0.61 points, but the gap is a size chance makes often. No signal either way.
What to do with it
A new high has not been a reason to sell, or a reason to buy more. On this data, the month after one looked like any other month. New highs are common: about one month in three. Our post on the VIX above 30 measured what the S&P 500 did the month after fear spiked.
On the chart
The S&P 500, monthly, January 1988 to September 2026, on a log scale. The teal strip along the bottom marks every month with a new all-time closing high.
How to count new highs yourself
- Take the index’s daily closes from well before the period you study, so the first highs are read against the whole record.
- Mark every close above all the closes before it, and every month with at least one.
- Compare the month after a marked month with the month after the others, then shuffle the marks many times to see how often chance makes the same gap.
What this does not tell you
What the next month will do. Price only, without dividends. Past data.
Observations, not recommendations.
We’re Signal Pilot Labs. We build the Elite Seven, seven indicators for TradingView, and we post what we measure, including the parts that didn’t work.
See what we build at signalpilot.io.
Published as a TradingView Idea on SPX. View the chart on TradingView
Past measurement described after the fact. Nothing here is a recommendation or an indication of future results.