Published as a TradingView Idea on SPX. View the chart on TradingView
The VIX is the stock market’s fear gauge. When it climbs above 30, the headlines usually read like a crash. We checked what the S&P 500 did over the month after, every time since 1990.
What we measured
TradingView daily closes of the VIX and the S&P 500 from 3 January 1990 to 16 October 2026. A signal day is the VIX’s first close above 30 after at least 21 trading days at 30 or below, so each spike counts once. The next month is the S&P 500’s change over the following 21 trading days, and the first dip is its lowest close in those days against the signal day’s close. Any day is the same month measured from every day in the period. We wrote the rules and the bar down before reading the VIX.
What we found
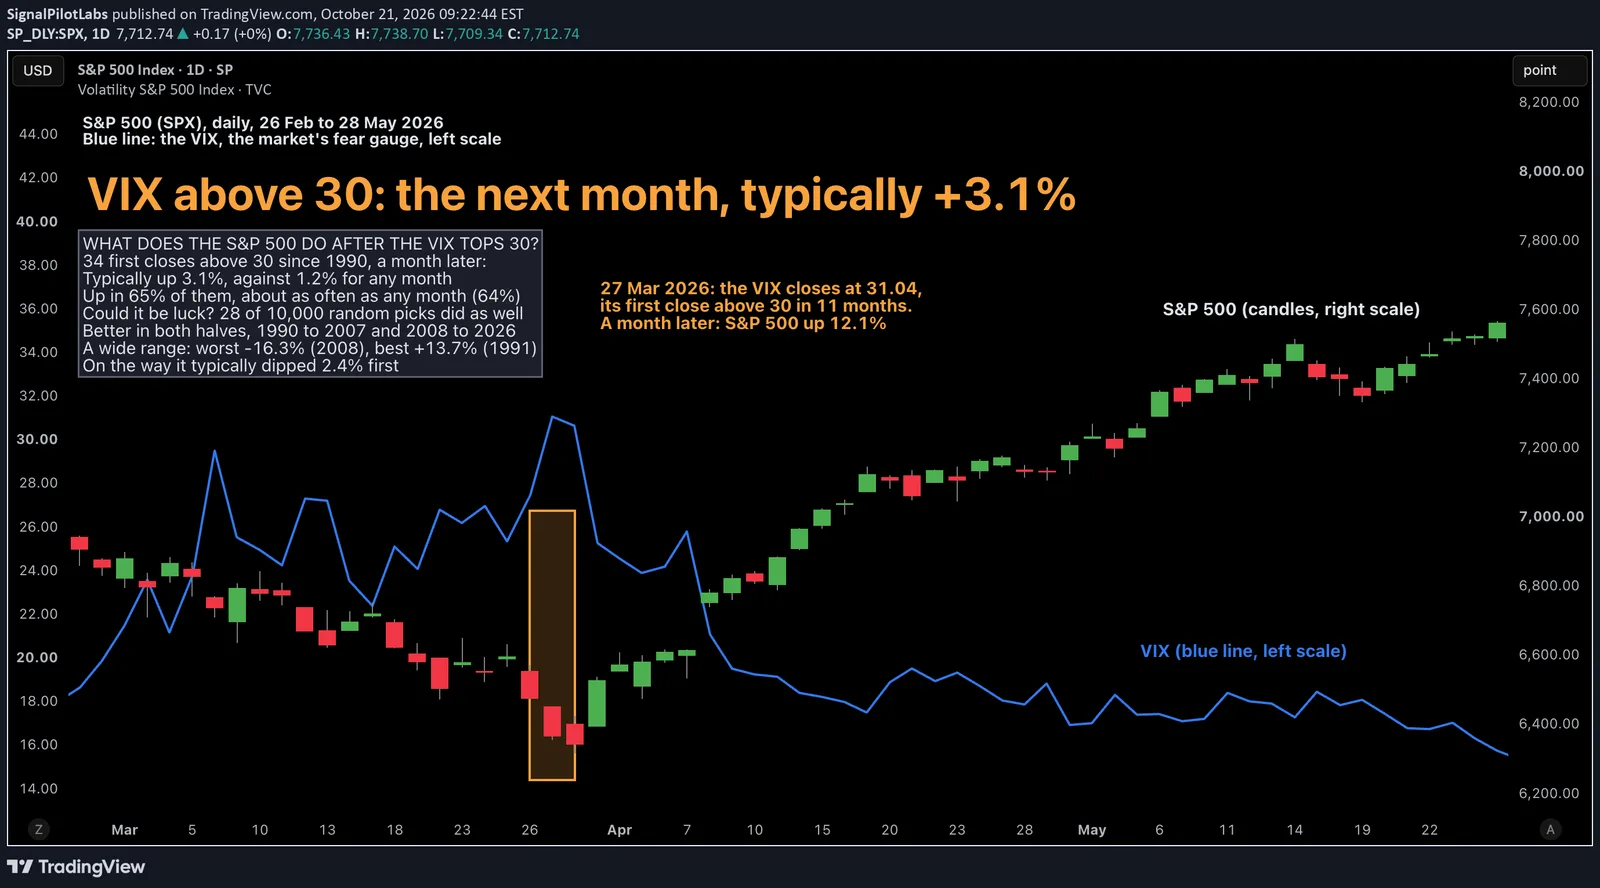
There were 34 signal days. A month later the S&P 500 was typically up 3.1%, against 1.2% for any day. It was up after 22 of the 34, 64.7%, about as often as any day (63.9%). The typical gain was bigger, not more frequent.
| Days | Count | Typical next month (%) | Up (%) | Worst (%) | Best (%) | Typical first dip (%) |
|---|---|---|---|---|---|---|
| Any day | 9,239 | +1.2 | 63.9 | -33.0 | +25.1 | -1.7 |
| The VIX’s first close above 30 | 34 | +3.1 | 64.7 | -16.3 | +13.7 | -2.4 |
| Every close above 30 | 733 | +3.6 | 71.2 | -30.0 | +25.1 | -2.9 |
Counting every close above 30, not only the first, gives 733 days that overlap one another. Their typical next month was +3.6%, and they rose 71.2% of the time.
Is it luck?
We picked 34 days at random from the whole period, 10,000 times. Only 28 of those sets had a typical month as high as the signal days. Both halves agree: the 14 signals from 1990 to 2007 beat the usual month by 2.7 points, and the 20 from 2008 to 2026 by 1.2 points. We had set that bar before looking: under 5% by luck and better in both halves.
The range is wide
12 of the 34 months ended lower. The worst came after 15 September 2008, down 16.3%, and after 27 February 2020, down 14.7%. On the way, the S&P 500 typically dipped 2.4% below the signal day’s close first, against 1.7% for any day.
| Signal day | VIX close | S&P 500 close | Next month (%) | First dip (%) |
|---|---|---|---|---|
| 1990-08-06 | 35.91 | 334.43 | -3.0 | -8.2 |
| 1991-01-08 | 30.38 | 314.90 | +13.7 | -1.1 |
| 1997-10-27 | 31.12 | 876.97 | +8.4 | +0.0 |
| 1997-12-24 | 30.27 | 932.70 | +3.9 | -0.5 |
| 1998-08-04 | 31.06 | 1,072.12 | -7.6 | -10.7 |
| 1998-12-14 | 31.31 | 1,141.20 | +6.2 | +0.0 |
| 2000-04-14 | 33.49 | 1,346.22 | +8.9 | +0.0 |
| 2000-12-20 | 31.74 | 1,264.74 | +7.6 | +0.0 |
| 2001-03-12 | 30.32 | 1,180.30 | -1.0 | -6.5 |
| 2001-09-07 | 30.99 | 1,085.78 | +0.5 | -11.1 |
| 2002-07-09 | 30.22 | 952.83 | -8.0 | -16.2 |
| 2003-01-24 | 31.51 | 861.40 | -2.7 | -5.1 |
| 2007-08-15 | 30.67 | 1,406.70 | +5.5 | +0.0 |
| 2007-11-12 | 31.09 | 1,439.18 | +3.3 | -2.2 |
| 2008-01-22 | 31.01 | 1,310.50 | +2.4 | +0.0 |
| 2008-03-14 | 31.16 | 1,288.14 | +3.6 | -0.9 |
| 2008-09-15 | 31.70 | 1,192.70 | -16.3 | -24.6 |
| 2009-10-30 | 30.69 | 1,036.19 | +7.0 | +0.0 |
| 2010-05-06 | 32.80 | 1,128.15 | -6.9 | -6.9 |
| 2011-08-04 | 31.66 | 1,200.07 | -2.2 | -6.7 |
| 2015-08-24 | 40.74 | 1,893.21 | +2.4 | -1.4 |
| 2018-02-05 | 37.32 | 2,648.94 | +2.9 | -2.6 |
| 2018-12-21 | 30.11 | 2,416.62 | +9.3 | -2.7 |
| 2020-02-27 | 39.16 | 2,978.76 | -14.7 | -24.9 |
| 2020-09-03 | 33.60 | 3,455.06 | -1.3 | -6.3 |
| 2020-10-26 | 32.46 | 3,400.97 | +6.9 | -3.9 |
| 2021-01-27 | 37.21 | 3,750.78 | +1.6 | -1.0 |
| 2021-12-01 | 31.13 | 4,513.03 | +5.6 | +0.0 |
| 2022-01-25 | 31.17 | 4,356.46 | -1.6 | -3.0 |
| 2022-04-26 | 33.51 | 4,175.21 | -4.7 | -6.6 |
| 2022-09-26 | 32.25 | 3,655.05 | +5.6 | -2.1 |
| 2024-08-05 | 38.56 | 5,186.34 | +6.4 | +0.0 |
| 2025-04-03 | 30.02 | 5,396.51 | +4.7 | -7.7 |
| 2026-03-27 | 31.04 | 6,368.86 | +12.1 | -0.4 |
On the chart
The latest signal, 27 March 2026: the VIX closed at 31.04, its first close above 30 in 11 months. A month later the S&P 500 was up 12.1%. The candles are the S&P 500; the blue line is the VIX on its own scale, the left axis.
What to do with it
Over these 36 years, a VIX above 30 was not on its own a sign of a worse month ahead for the S&P 500. It was a sign of a wider one: a typical dip of 2.4% first, and a few deep falls among the 34.
How to check the next spike yourself
- Note the first day the VIX closes above 30 after at least a month at 30 or below.
- Write down the S&P 500’s close that day.
- Count 21 trading days and compare the close, and note the lowest close on the way.
What this does not tell you
Which spike turns into 2008. A count of 34 signals in 36 years is small, and these are index prices without dividends. Past data.
Observations, not recommendations.
We’re Signal Pilot Labs. We build the Elite Seven, seven indicators for TradingView, and we post what we measure, including the parts that didn’t work.
See what we build at signalpilot.io.
Published as a TradingView Idea on SPX. View the chart on TradingView
Past measurement described after the fact. Nothing here is a recommendation or an indication of future results.