Published as a TradingView Idea on BTCUSDT. View the chart on TradingView
Crypto trades seven days a week, but it doesn’t move the same way all seven. We measured how much 50 coins move on a weekend day against a weekday. Every coin is in the table below, so you can find yours.
What we measured
The 50 most traded crypto perpetuals on Bybit, ranked by turnover from 11 September to 10 October 2026, each listed for the whole year. Daily closes, UTC, 14 October 2025 to 13 October 2026: 104 weekend days and 261 weekdays. A day’s move is how far it closed from the day before, up or down. For each coin, its median weekend move divided by its median weekday move. The rules were written down before the run.
The answer
47 of the 50 coins moved less at the weekend. The median coin’s weekend days moved 0.71 times a weekday.
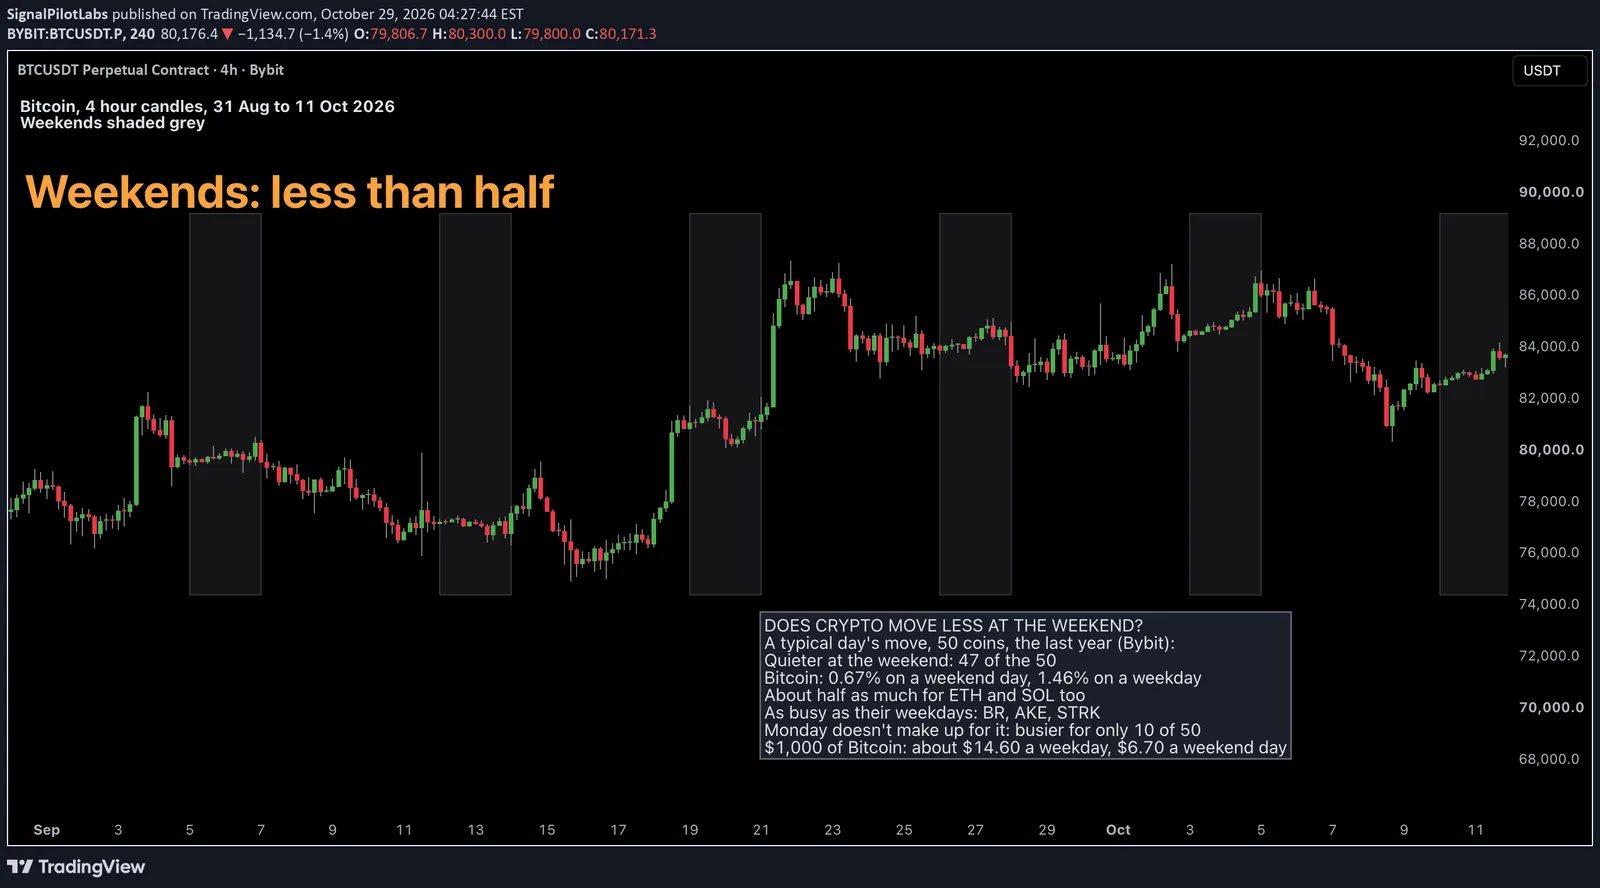
The biggest coins went the quietest. Bitcoin moved 0.67% on a weekend day against 1.46% on a weekday, 0.46 times. ETH 0.49, XRP 0.49, ADA 0.51 and SOL 0.53.
Three didn’t slow down at all: BR 1.06, AKE 1.02 and STRK 1.01. QNT, MOVR, LSK, USELESS, RLC and TAO stayed above 0.9.
Two things we checked so it isn’t misread
The daily range, high to low, shrinks less than the close does: a median of 0.80 times. A quiet close isn’t a quiet day.
And Monday doesn’t make up for it. Monday moved more than Tuesday to Friday on only 10 of the 50 coins.
In the table, the weekend ratio is the weekend day’s median move over the weekday’s, the range ratio is the same for the high to low range, and the Monday ratio is Monday’s median move over Tuesday to Friday’s.
| Coin | Weekend day, median move (%) | Weekday, median move (%) | Weekend ratio | Range ratio | Monday ratio |
|---|---|---|---|---|---|
| BTC | 0.67 | 1.46 | 0.46 | 0.53 | 1.07 |
| ETH | 0.94 | 1.92 | 0.49 | 0.62 | 1.07 |
| XRP | 0.92 | 1.89 | 0.49 | 0.66 | 0.91 |
| ADA | 1.41 | 2.75 | 0.51 | 0.69 | 0.82 |
| SOL | 1.21 | 2.28 | 0.53 | 0.69 | 0.99 |
| ENA | 2.01 | 3.73 | 0.54 | 0.74 | 0.68 |
| DOGE | 1.16 | 2.04 | 0.57 | 0.73 | 0.77 |
| XPL | 2.79 | 4.47 | 0.62 | 0.78 | 0.60 |
| SUI | 1.76 | 2.78 | 0.63 | 0.75 | 0.82 |
| LTC | 1.09 | 1.71 | 0.64 | 0.83 | 0.88 |
| AAVE | 1.86 | 2.88 | 0.64 | 0.83 | 0.91 |
| LINK | 1.49 | 2.31 | 0.64 | 0.73 | 1.10 |
| INJ | 2.11 | 3.27 | 0.64 | 0.80 | 1.28 |
| ZEC | 2.72 | 4.21 | 0.65 | 0.82 | 0.98 |
| ARB | 1.69 | 2.61 | 0.65 | 0.78 | 0.85 |
| XLM | 1.57 | 2.35 | 0.67 | 0.72 | 1.00 |
| NEAR | 1.88 | 2.80 | 0.67 | 0.79 | 0.92 |
| SAND | 1.86 | 2.73 | 0.68 | 0.78 | 0.75 |
| TIA | 2.18 | 3.18 | 0.69 | 0.81 | 1.08 |
| PENGU | 2.53 | 3.66 | 0.69 | 0.74 | 1.00 |
| OP | 2.15 | 3.10 | 0.69 | 0.83 | 0.82 |
| 1000PEPE | 1.77 | 2.52 | 0.70 | 0.77 | 0.87 |
| ZRO | 2.24 | 3.16 | 0.71 | 0.75 | 1.25 |
| FARTCOIN | 2.99 | 4.20 | 0.71 | 0.72 | 0.89 |
| PUMPFUN | 3.13 | 4.39 | 0.71 | 0.84 | 0.71 |
| HBAR | 1.53 | 2.14 | 0.72 | 0.81 | 0.93 |
| ONDO | 2.12 | 2.95 | 0.72 | 0.73 | 0.95 |
| AVAX | 1.57 | 2.18 | 0.72 | 0.78 | 0.87 |
| DOT | 1.81 | 2.43 | 0.75 | 0.79 | 0.71 |
| UNI | 1.97 | 2.63 | 0.75 | 0.76 | 0.96 |
| HYPE | 2.20 | 2.91 | 0.76 | 0.76 | 1.03 |
| TRUMP | 1.86 | 2.38 | 0.78 | 0.84 | 0.79 |
| WLD | 2.59 | 3.24 | 0.80 | 0.85 | 1.18 |
| FIL | 2.07 | 2.55 | 0.81 | 0.87 | 0.88 |
| BNB | 1.09 | 1.35 | 0.81 | 0.77 | 0.74 |
| VVV | 3.32 | 3.97 | 0.84 | 0.83 | 1.25 |
| APT | 2.14 | 2.53 | 0.85 | 0.78 | 1.07 |
| AERO | 2.88 | 3.37 | 0.85 | 0.82 | 0.74 |
| DASH | 2.90 | 3.36 | 0.86 | 0.87 | 0.68 |
| BCH | 1.56 | 1.77 | 0.88 | 0.85 | 1.00 |
| XMR | 1.97 | 2.23 | 0.88 | 0.85 | 0.86 |
| TAO | 2.53 | 2.81 | 0.90 | 0.82 | 0.59 |
| RLC | 2.01 | 2.22 | 0.90 | 0.86 | 0.93 |
| USELESS | 5.44 | 6.01 | 0.91 | 0.82 | 0.90 |
| LSK | 2.09 | 2.28 | 0.92 | 0.97 | 0.65 |
| MOVR | 2.53 | 2.75 | 0.92 | 0.91 | 0.88 |
| QNT | 1.84 | 1.92 | 0.96 | 0.84 | 0.82 |
| STRK | 3.07 | 3.04 | 1.01 | 0.89 | 0.92 |
| AKE | 4.93 | 4.84 | 1.02 | 1.08 | 0.88 |
| BR | 4.22 | 3.98 | 1.06 | 1.02 | 0.59 |
The chart
Bitcoin, 4 hour, the last six weeks of the year we measured (31 August to 11 October 2026), every weekend shaded grey. We picked this window after seeing the year’s numbers, so here is its own: weekend days moved 0.42% against 1.11% on weekdays, 0.38 times, close to the year’s 0.46. BR, the coin whose weekends were the least quiet, is in the table: 1.06 times.
How far 50 coins move in a normal week is in our post on 50 coins’ normal week, from Bitcoin’s 8.1% to AKE’s 45.0%.
What this does not tell you
Which way, or whether it holds next year. One year, one exchange, daily closes at 00:00 UTC, medians. It doesn’t tell you to buy or sell.
What it’s good for is sizing what you expect. On $1,000 of Bitcoin, a normal weekday moved about $14.60 and a normal weekend day about $6.70. On BR the weekend was no quieter. Look up your coin’s weekend ratio in the table before you hold it into a weekend.
Observations, not recommendations.
We’re Signal Pilot Labs. We build the Elite Seven, seven indicators for TradingView, and we post what we measure, including the parts that didn’t work.
See what we build at signalpilot.io.
Published as a TradingView Idea on BTCUSDT. View the chart on TradingView
Past measurement described after the fact. Nothing here is a recommendation or an indication of future results.