Published as a TradingView Idea on NVDA. View the chart on TradingView
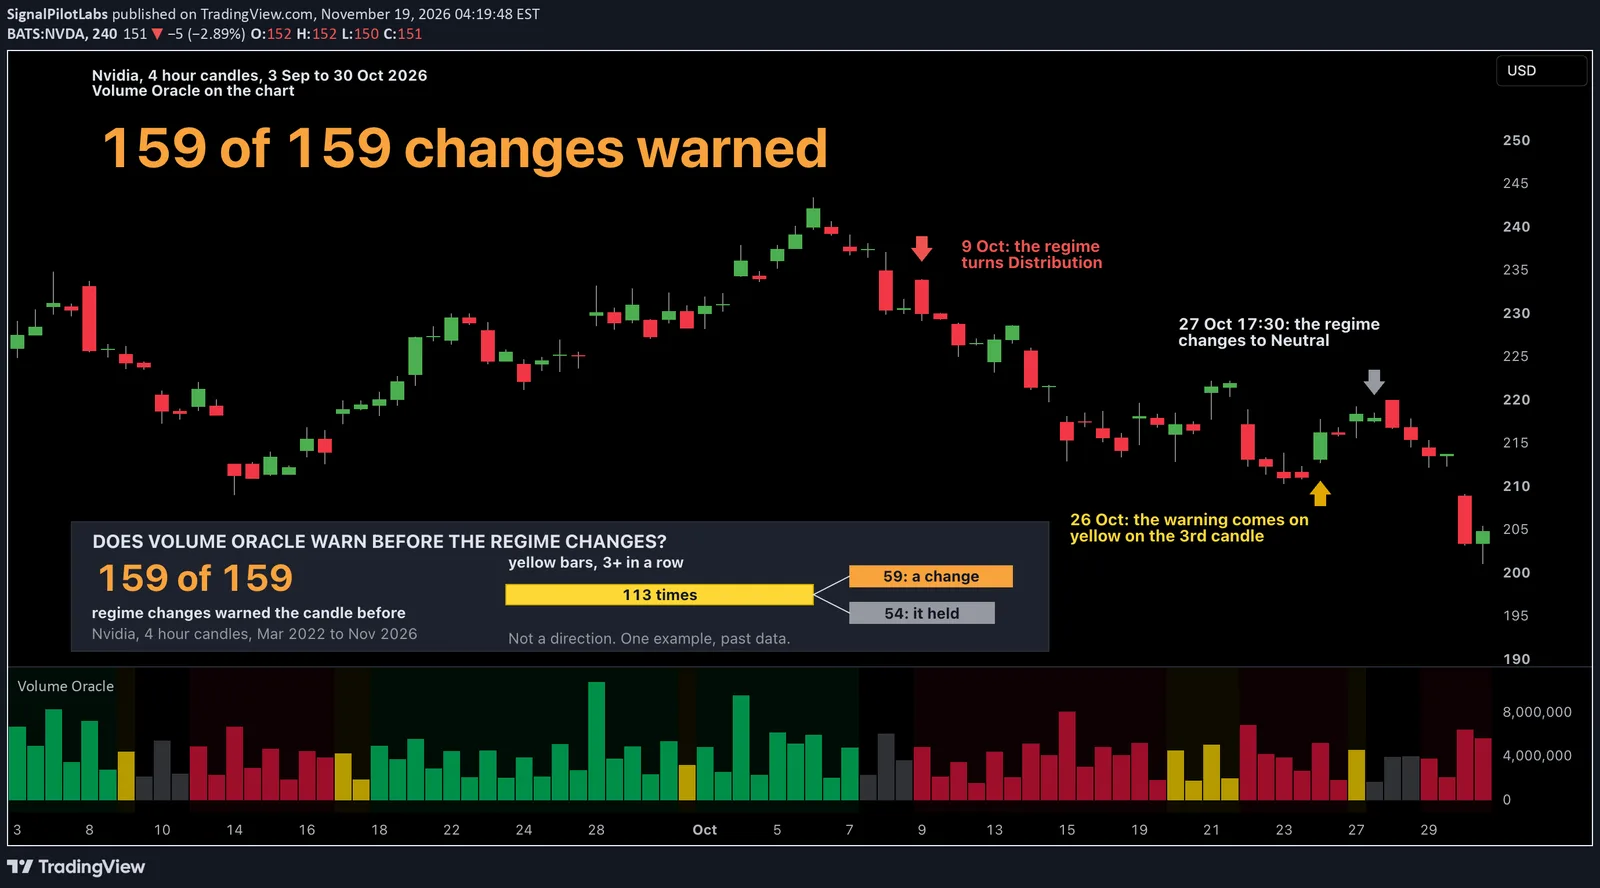
Does Volume Oracle warn before Nvidia’s regime changes? On the 4 hour chart, all 159 since March 2022 had a warning on the candle before.
Volume Oracle sorts the market into regimes: Accumulation, Distribution or Neutral. It scores each candle, and the regime changes when that score crosses its flip level for two candles. Its table shows the score and the level when you hover over it. Before it changes, the regime loses strength, and Volume Oracle warns through a ladder: FADING, WEAKENING, CRITICAL, then FLIPPED when the score has crossed zero. After three warning candles in a row, the volume bars and the background turn yellow.
We measured what that yellow means on Nvidia’s 4 hour chart.
What we measured
Every 4 hour candle of NASDAQ:NVDA in regular trading hours, March 2022 to 17 November 2026: 2,347 candles, two per session, with version 2 of Volume Oracle. A warning run is a row of candles carrying the Regime Weakening alert inside one regime, and yellow is a run of three or more. A yellow run ends in a change if the next candle switches to another one, and recovers if the next candle stays in the same one without a warning. The questions and the rules were written down before the run, and the last three years are shown beside the whole history.
The volume is TradingView’s free Nvidia feed, Cboe’s exchange, about 8.7 million shares a day: a share of all Nvidia trades, not the whole market.
What we found
Nvidia was in Accumulation 60.2% of the time, Distribution 35.7% and Neutral 4.0%. The first typically lasted 8 candles, about four sessions, and the second 7.
The regime changed out of Accumulation or Distribution 159 times. Every one of the 159 had a warning on the candle before. Usually it was short: a median of 2 warning candles.
The yellow came on 113 times. After it, the regime changed in 59 of them and recovered in the other 54. So yellow means a change is in play, not that one is coming.
And most changes didn’t wait for the yellow: 100 of the 159 came after only one or two warning candles.
| Measure | All, March 2022 to November 2026 | Last 3 years, from 13 October 2023 |
|---|---|---|
| Candles | 2,347 | 1,546 |
| Accumulation, share of candles (%) | 60.2 | 59.6 |
| Distribution, share of candles (%) | 35.7 | 35.4 |
| Neutral, share of candles (%) | 4.0 | 5.0 |
| Median Accumulation, candles | 8 | 8 |
| Median Distribution, candles | 7 | 7.5 |
| Regime changes out of Accumulation or Distribution | 159 | 108 |
| With a warning on the candle before | 159 | 108 |
| Median warning candles before a change | 2 | 2 |
| Changes after only 1 or 2 warning candles | 100 | 64 |
| Yellow runs (3 or more warning candles) | 113 | 82 |
| Yellow, then a regime change | 59 | 44 |
| Yellow, then the regime recovered | 54 | 38 |
The last three years read the same: all 108 had a warning, and 82 yellow runs ended in 44 changes and 38 recoveries.
On the chart
Nvidia, 4 hour, 3 September to 30 October 2026. The regime turned Distribution on the 13:30 UTC candle of 9 October. On 20 and 21 October the bars went yellow, and Distribution held. The warning came back at 13:30 UTC on the 26th, and on the third warning candle, at 13:30 UTC on the 27th, the bars turned yellow. On the next candle, at 17:30 UTC on the 27th, the regime changed to Neutral.
It’s one example, picked by a rule we wrote before looking: the most recent yellow run that ended in a change. The numbers above cover all of them.
How far Nvidia moves in a normal week, 6.9% from high to low, is in our post on big tech’s normal week, beside Tesla, Apple and the S&P 500.
How to do it
- Add Volume Oracle to Nvidia’s 4 hour chart. The volume bars show the regime: green Accumulation, red Distribution, grey Neutral. The background tints green or red with them.
- Watch the status line in its table. FADING, WEAKENING, CRITICAL or FLIPPED means the regime is losing strength.
- Read yellow as a change in play, not one coming. On Nvidia it ended in a change about half the time and recovered the other half.
- Don’t wait for yellow: most changes came after one or two warning candles.
What this does not tell you
Which way price goes, how far, or whether the next regime holds. A regime change doesn’t tell you to buy or sell. One stock, one timeframe, four and a half years, one exchange’s volume, past data.
Observations, not recommendations.
We’re Signal Pilot Labs. We build the Elite Seven, seven indicators for TradingView, and we post what we measure, including the parts that didn’t work.
See what we build at signalpilot.io.
Published as a TradingView Idea on NVDA. View the chart on TradingView
Past measurement described after the fact. Nothing here is a recommendation or an indication of future results.