Published as a TradingView Idea on 1000PEPEUSDT. View the chart on TradingView
Does a daily close above the Bull Market Support Band mark a trend change? The band is the zone between the 20 period simple and the 21 period exponential moving average, and OmniDeck draws it. On the daily chart a close above the band’s top is a cross up, a close below its bottom a cross down. A cross up looks like a trend turning, but most did not last.
What we measured
Every BMSB cross on the daily chart of the 50 most traded crypto perpetuals on Bybit, from 14 October 2024 to 13 November 2026, that was later closed by an opposite cross: 1,700 up and 1,675 down. The band is computed the way OmniDeck’s source computes it, on the close. For each cross: how many days until price crossed back, how far it ran in between (the best close past the cross), and where it stood at the cross back. Bitcoin is also measured from its first Bybit daily candle, 25 March 2020. The rules were written down before the run.
What a cross gave
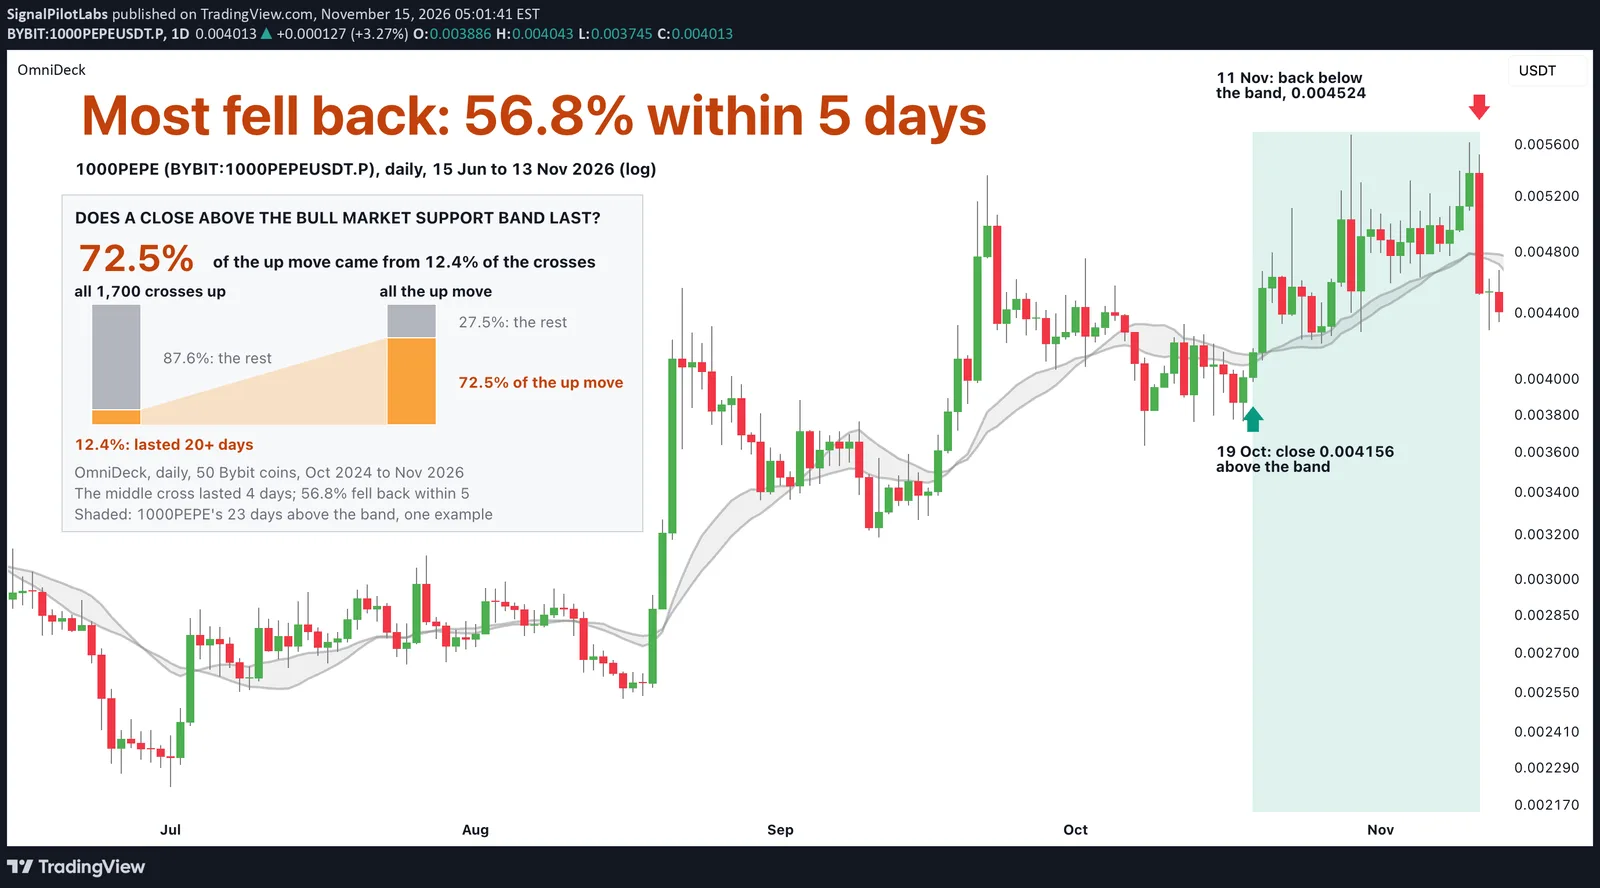
Most didn’t last. The median up cross, the middle one when they are lined up by length, lasted 4 days, and 56.8% crossed back within 5 days. At the median, the best close was only 2.4% above the cross.
A few lasted. 12.4% of up crosses held for 20 days or more, and those few carried 72.5% of all the up move, counted in ATR (the average daily range) across every cross. Bitcoin since March 2020 shows the same shape: 107 up crosses, about half back within 5 days, and the 21.5% that lasted 20 days or more carried 80.7% of the run.
The cross back came late. At the median, the close on the day price crossed back below the band was 3.9% under the cross up’s close.
| Crosses | Number | Median days to the cross back | Back within 5 days (%) | Lasted 20 days or more (%) | Median best close past the cross (%) | Median close at the cross back (%) | Share of the run from the 20+ day ones (%) |
|---|---|---|---|---|---|---|---|
| Up crosses, 50 coins | 1,700 | 4 | 56.8 | 12.4 | 2.4 | -3.9 | 72.5 |
| Down crosses, 50 coins | 1,675 | 7 | 45.4 | 19.1 | 4.7 | -3.3 | 58.7 |
| Bitcoin up crosses since March 2020 | 107 | 5 | 51.4 | 21.5 | 2.2 | -2.1 | 80.7 |
| Bitcoin down crosses since March 2020 | 107 | 7 | 41.1 | 15.0 | 3.0 | -1.6 | 52.1 |
Down crosses lasted longer: a median of 7 days, 45.4% back within 5 days, and 19.1% held for 20 days or more.
SuperTrend, another of OmniDeck’s systems, showed the same thing in our post on SuperTrend flips: the flip back came late.
Coin by coin
On every one of the 50 coins, at least 40% of the up crosses crossed back within 5 days, and on 41 of them half or more did. BNB’s lasted longest, a median of 9 days. SAND’s crossed back fastest: 74.4% within 5 days. XPL had no up cross that lasted 20 days.
| Coin | Up crosses | Median days | Back within 5 days (%) | Lasted 20 days or more (%) |
|---|---|---|---|---|
| BTC | 33 | 5 | 57.6 | 18.2 |
| ETH | 32 | 4.5 | 56.3 | 21.9 |
| SOL | 30 | 5.5 | 50.0 | 20.0 |
| XRP | 38 | 4 | 60.5 | 13.2 |
| ZEC | 41 | 3 | 58.5 | 14.6 |
| NEAR | 32 | 5 | 53.1 | 18.8 |
| HYPE | 40 | 5 | 57.5 | 10.0 |
| DOGE | 27 | 5 | 51.9 | 18.5 |
| ENA | 33 | 4 | 60.6 | 12.1 |
| SUI | 30 | 6 | 43.3 | 13.3 |
| ONDO | 45 | 2 | 66.7 | 11.1 |
| PUMPFUN | 23 | 6 | 47.8 | 8.7 |
| ADA | 41 | 4 | 61.0 | 7.3 |
| 1000PEPE | 34 | 3.5 | 61.8 | 20.6 |
| QNT | 35 | 4 | 57.1 | 11.4 |
| WLD | 36 | 4 | 61.1 | 5.6 |
| UNI | 35 | 5 | 51.4 | 11.4 |
| LSK | 36 | 3.5 | 69.4 | 8.3 |
| AKE | 19 | 4 | 68.4 | 21.1 |
| ARB | 32 | 4.5 | 56.3 | 15.6 |
| AVAX | 42 | 3 | 59.5 | 14.3 |
| LINK | 37 | 5 | 54.1 | 13.5 |
| TAO | 31 | 6 | 48.4 | 12.9 |
| AAVE | 39 | 4 | 53.8 | 15.4 |
| LTC | 39 | 5 | 51.3 | 15.4 |
| HBAR | 38 | 4 | 60.5 | 7.9 |
| BNB | 33 | 9 | 45.5 | 24.2 |
| XPL | 24 | 3 | 54.2 | 0.0 |
| SAND | 39 | 3 | 74.4 | 5.1 |
| TRUMP | 18 | 4.5 | 50.0 | 5.6 |
| STRK | 28 | 4 | 53.6 | 10.7 |
| BCH | 39 | 4 | 53.8 | 15.4 |
| XLM | 35 | 6 | 45.7 | 8.6 |
| ZRO | 36 | 5 | 52.8 | 16.7 |
| USELESS | 18 | 6 | 44.4 | 22.2 |
| FARTCOIN | 27 | 8 | 40.7 | 14.8 |
| PENGU | 34 | 3 | 67.6 | 11.8 |
| XMR | 41 | 6 | 46.3 | 22.0 |
| APT | 39 | 4 | 61.5 | 7.7 |
| INJ | 40 | 4 | 60.0 | 12.5 |
| VVV | 26 | 4.5 | 53.8 | 23.1 |
| BR | 32 | 5 | 53.1 | 6.3 |
| DOT | 29 | 6 | 48.3 | 6.9 |
| OP | 39 | 3 | 64.1 | 7.7 |
| MOVR | 32 | 3 | 62.5 | 9.4 |
| RLC | 41 | 5 | 61.0 | 7.3 |
| FIL | 41 | 3 | 68.3 | 4.9 |
| TIA | 36 | 4.5 | 52.8 | 2.8 |
| DASH | 43 | 4 | 65.1 | 7.0 |
| AERO | 32 | 5.5 | 50.0 | 18.8 |
On the chart
1000PEPE, Bybit’s contract for 1,000 PEPE, daily, 15 June to 13 November 2026, on a log scale, where equal steps on the price axis are equal percentage moves. On 19 October it closed at 0.004156, above the band, and OmniDeck marked a cross up. It stayed above for 23 days. The best close was 0.005374 on 10 November, 29% above the cross, after an intraday high of 0.00568 on 29 October. The next day it fell 15.8% and closed back below the band at 0.004524, still 8.9% above the cross.
This is one of the long crosses, picked by a rule we wrote before looking: the most recent up cross that lasted 20 days or more. The median cross lasted 4 days and ran 2.4%. The point is the shape: a small share of crosses carry most of the move.
How to do it
- In OmniDeck’s settings, turn on Bull Market Support Band and use the daily chart.
- Treat a fresh cross up as a test, not a turn. More than half crossed back within 5 days.
- Watch whether it lasts. The 1 in 8 that held for 20 days carried most of the move.
- Don’t count on the cross back to protect the gain. By then, at the median, the cross had given it all back.
What this does not tell you
This describes what crosses did. It doesn’t compare them with random days, and the best close of a run is only known afterwards. No fees, daily candles on one exchange, past data. The 1000PEPE run is one of the long ones, not a typical cross.
Observations, not recommendations.
We’re Signal Pilot Labs. We build the Elite Seven, seven indicators for TradingView, and we post what we measure, including the parts that didn’t work.
See what we build at signalpilot.io.
Published as a TradingView Idea on 1000PEPEUSDT. View the chart on TradingView
Past measurement described after the fact. Nothing here is a recommendation or an indication of future results.