Published as a TradingView Idea on ZROUSDT. View the chart on TradingView
A coin closes above last week’s high. Is that a breakout, or a spike that will be back under the line by tomorrow? We measured it on the 50 most traded crypto coins on Bybit, over two separate years, and one number separated the two: how far the close landed above the line.
What we measured
Janus Atlas draws last week’s high on the chart as pwH. We took every week, on all 50 coins, that opened below last week’s high, and found the first 1 hour close above it. Then we checked one thing: was the price still above the line 24 hours later?
We measured 12 October 2025 to 12 October 2026 first. Then we checked the result on the year before it, 12 October 2024 to 12 October 2025, which played no part in finding it. The coins are the 50 most traded crypto perpetuals on Bybit from 11 September to 10 October 2026.
What we found
Of all the breaks, 53.6% were still above the line a day later, and 53.8% in the earlier year. Only about a quarter never closed back below it in those 24 hours: 25.5%, and 22.2% in the earlier year.
The size of the break made the difference. ATR here is the 14 bar ATR on the 1 hour chart.
| Year | Breaks | Still above 24 hours later (%) | Close at least 0.25 ATR above (%) | Close under 0.25 ATR above (%) |
|---|---|---|---|---|
| Oct 2025 to Oct 2026 | 927 | 53.6 | 56.8 | 46.3 |
| Oct 2024 to Oct 2025 | 946 | 53.8 | 57.4 | 46.5 |
That’s about 10 points in both years, on more than 900 breaks each year, and p = 0.001 on the year we hadn’t looked at.
One thing didn’t separate them: how many other levels sat near the break. Janus’s confluence stars at the break bar showed no clear difference in either year. The stars tell you where levels stack. For this question, the distance did the work.
One break on the chart
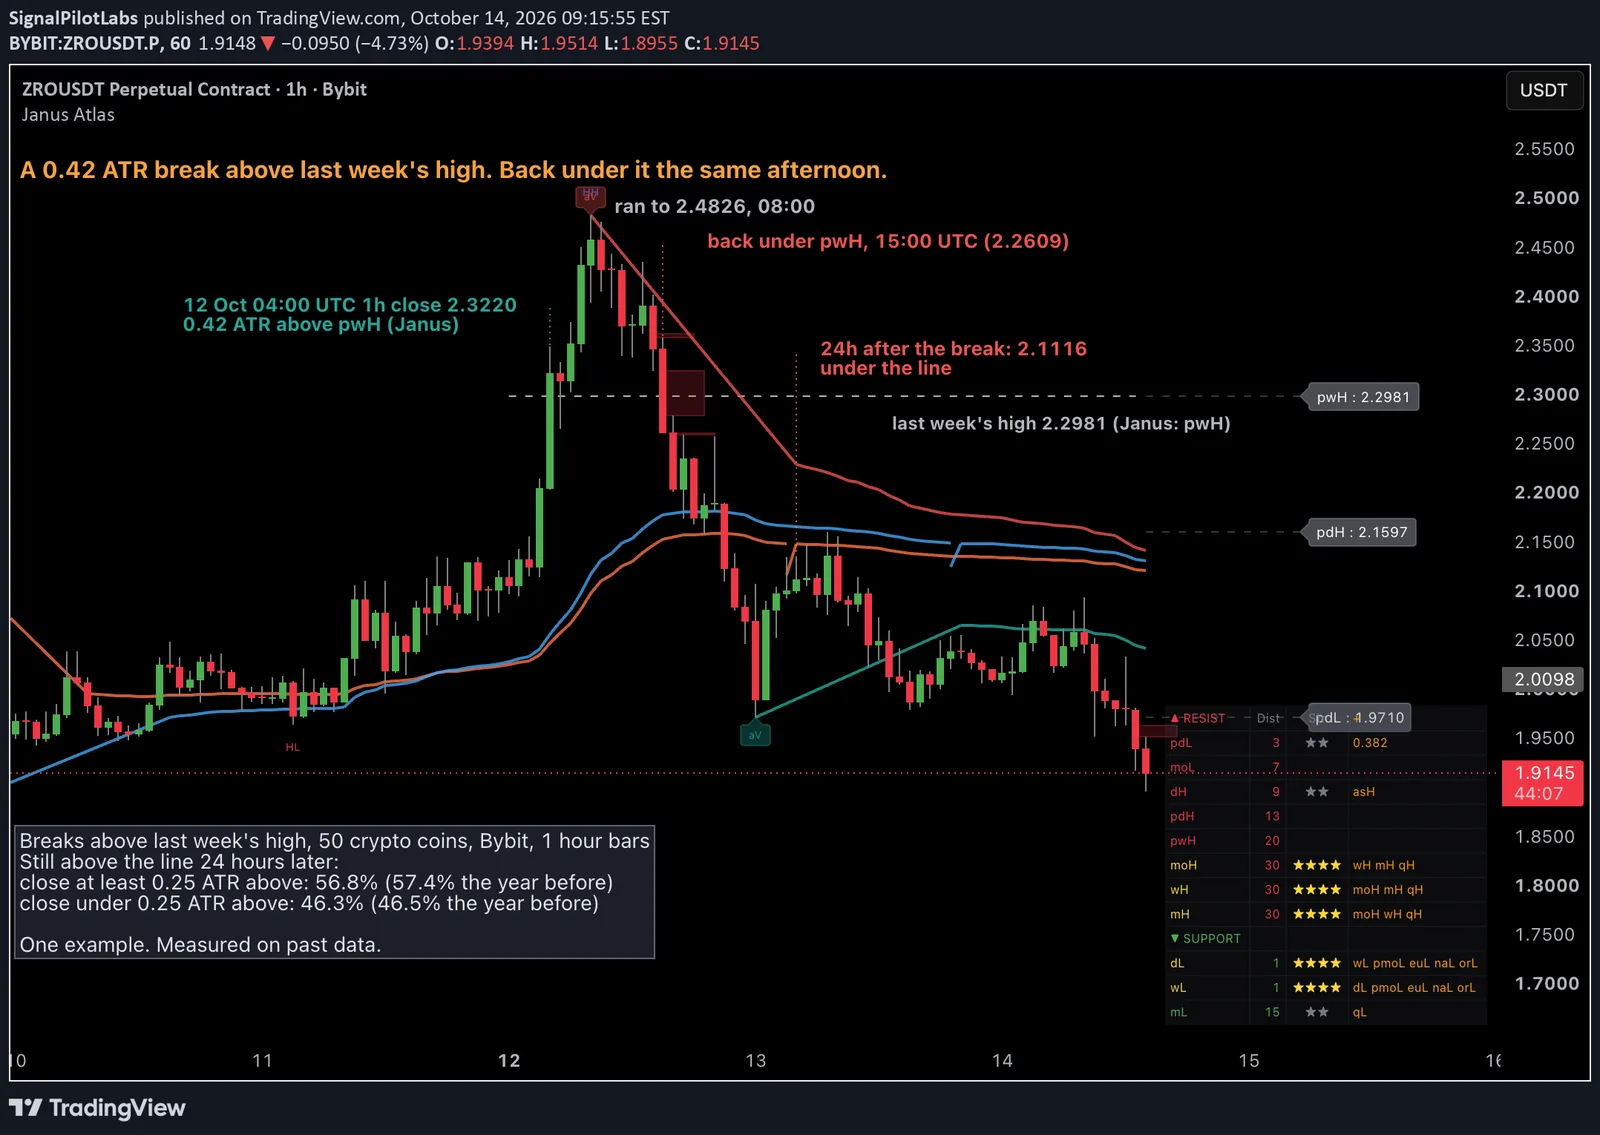
ZRO, 1 hour, 12 October 2026. Last week’s high was 2.2981, set on 6 October at 15:00 UTC, and Janus draws it as pwH. ZRO opened the week below it, and the 04:00 UTC bar on 12 October closed at 2.3220: 1.04% above the line, or 0.42 ATR. That’s the bigger kind of break. It ran to 2.4826 by 08:00 UTC, closed back under the line at 15:00 UTC, and 24 hours after the break it was at 2.1116. Bigger breaks held more often, not always, and this one is in the 43% that didn’t. It’s the most recent break among the 50 coins whose 24 hours were complete when we built the chart. We picked it by that rule, not by how it ended.
How to check it on your own chart
- In Janus Atlas settings, turn on Previous Periods and switch on PW H, so last week’s high (pwH) is on your chart. Turn on Show Price on Labels to see its exact price.
- Wait for a 1 hour close above pwH. A wick through it isn’t a break.
- Take that close minus the pwH price and divide by the 1 hour ATR(14). At 0.25 ATR or more, you’re in the group that held 57% of the time. Below that, 46%.
- Even the bigger breaks failed about 43% of the time. Keep a stop, and size the position from it.
What this does not tell you
It’s a 24 hour check on one level, measured on 1 hour bars. It says whether a break was still above the line a day later, not how far it ran. The difference is about 10 points, not a certainty. Bitcoin on its own had too few breaks to say anything, about 20 a year. Past data, two years, one exchange.
Observations, not recommendations.
We’re Signal Pilot Labs. We build the Elite Seven, seven indicators for TradingView, and we post what we measure, including the parts that didn’t work.
See what we build at signalpilot.io.
Published as a TradingView Idea on ZROUSDT. View the chart on TradingView
Past measurement described after the fact. Nothing here is a recommendation or an indication of future results.