Published as a TradingView Idea on ZROUSDT. View the chart on TradingView
SuperTrend is one of the ten systems in OmniDeck. It flips when price closes through a band set by ATR, the coin’s normal candle size. A flip says the trend changed side. It doesn’t say how far the move will go, so we measured that, coin by coin.
How OmniDeck’s SuperTrend works
OmniDeck runs three SuperTrend bands, at 2, 3 and 4 times the 10 bar ATR, and flips when two of the three agree, on a closed candle. A dot marks each flip on the chart.
What we measured
Every SuperTrend flip on the 4 hour chart of 44 crypto perpetual futures on Bybit, 14 October 2025 to 25 October 2026, that was later followed by an opposite flip: 2,581 flips. For each one, how far did price run the flip’s way before the next flip, in percent and in ATR (14)? The rules were written down before we read the data.
What a flip gave
The typical run, the median: Bitcoin 2.9%, or 2.2 ATR. Ether 3.1%, or 1.9 ATR. Solana 4.9%, or 2.7 ATR. All altcoins together 6.4%, or 2.2 ATR. ZRO 12.6%, or 3.0 ATR, the largest of the 44.
All 43 altcoins ran further than Bitcoin in percent. In ATR, 36 of the 43 were within a quarter of Bitcoin’s 2.2. The percent mostly tells you how much a coin moves. In ATR a flip gave about the same on Bitcoin as on a small altcoin.
Across all 2,581, price ran at least 1 ATR the flip’s way 72% of the time, at least 2 ATR 53%, and at least 3 ATR 40%.
All 44 coins
Bitcoin, Ether and Solana first, then the rest from the largest typical run down. Kept is where the close stood when the opposite flip printed, against the flip’s close, in the flip’s direction: a minus sign means price was already back past the flip.
| Coin | Flips | Typical run (%) | Typical run (ATR) | Kept at the opposite flip (%) | Candles flip to flip |
|---|---|---|---|---|---|
| BTC | 65 | 2.9 | 2.2 | -1.6 | 27 |
| ETH | 60 | 3.1 | 1.9 | -2.6 | 27.5 |
| SOL | 62 | 4.9 | 2.7 | -2.5 | 23.5 |
| ZRO | 51 | 12.6 | 3.0 | -3.2 | 33 |
| PORTAL | 47 | 10.9 | 2.1 | -5.3 | 25 |
| EPIC | 45 | 10.3 | 2.1 | -3.1 | 32 |
| DYDX | 59 | 10.0 | 3.1 | -3.5 | 30 |
| KAITO | 45 | 10.0 | 3.1 | -2.9 | 31 |
| VVV | 59 | 9.9 | 2.0 | -5.8 | 26 |
| ZEC | 58 | 9.7 | 2.7 | -2.9 | 31 |
| ENA | 61 | 9.6 | 2.6 | -4.2 | 26 |
| GPS | 53 | 9.5 | 2.2 | -6.6 | 30 |
| SOPH | 63 | 9.0 | 2.5 | -3.1 | 28 |
| FARTCOIN | 69 | 8.9 | 1.8 | -6.0 | 23 |
| WLD | 65 | 8.2 | 2.3 | -5.5 | 23 |
| DASH | 53 | 8.0 | 2.4 | -3.7 | 33 |
| STRK | 61 | 8.0 | 2.2 | -3.2 | 25 |
| ACE | 69 | 7.6 | 1.9 | -6.7 | 24 |
| PENGU | 55 | 7.6 | 2.4 | -3.2 | 32 |
| BANK | 56 | 7.4 | 1.8 | -5.9 | 33 |
| AAVE | 58 | 7.2 | 2.9 | -3.6 | 28 |
| KAS | 52 | 7.1 | 2.8 | -1.6 | 37.5 |
| HOME | 51 | 7.0 | 2.5 | -4.9 | 23 |
| HYPE | 53 | 7.0 | 2.8 | -2.8 | 28 |
| 1000PEPE | 55 | 6.8 | 2.4 | -3.7 | 26 |
| 1000RATS | 63 | 6.7 | 1.8 | -4.8 | 23 |
| SUI | 54 | 6.5 | 2.2 | -3.5 | 35 |
| ADA | 57 | 6.4 | 2.6 | -2.9 | 27 |
| ONDO | 68 | 5.9 | 2.0 | -3.4 | 21.5 |
| TAO | 56 | 5.6 | 2.7 | -3.5 | 27 |
| IOTX | 58 | 5.4 | 1.7 | -5.1 | 20 |
| APT | 63 | 5.3 | 2.1 | -4.7 | 22 |
| SEI | 55 | 5.2 | 2.0 | -3.4 | 28 |
| TRUMP | 60 | 5.2 | 2.2 | -3.9 | 25.5 |
| COW | 62 | 5.1 | 2.0 | -3.3 | 25.5 |
| XRP | 62 | 4.9 | 2.2 | -2.0 | 23 |
| NEAR | 61 | 4.8 | 1.7 | -4.4 | 18 |
| HBAR | 66 | 4.8 | 2.4 | -2.8 | 26 |
| CRV | 64 | 4.4 | 1.8 | -4.5 | 25.5 |
| UNI | 57 | 4.2 | 1.9 | -3.9 | 21 |
| XMR | 54 | 3.9 | 1.7 | -3.7 | 24 |
| LTC | 65 | 3.4 | 1.8 | -2.8 | 22 |
| BCH | 67 | 3.2 | 1.5 | -2.9 | 25 |
| BNB | 64 | 3.1 | 2.7 | -1.5 | 28 |
The flip back comes late
When the opposite flip printed, the close was already back past the first flip’s close in 68% of cases. The run happens early; the flip back mostly confirms it’s over. The ones that hold can be very large. ZRO’s previous flip up, at 1.0251 on 17 September, ran to 2.2981 before the next flip, 124%.
On the chart
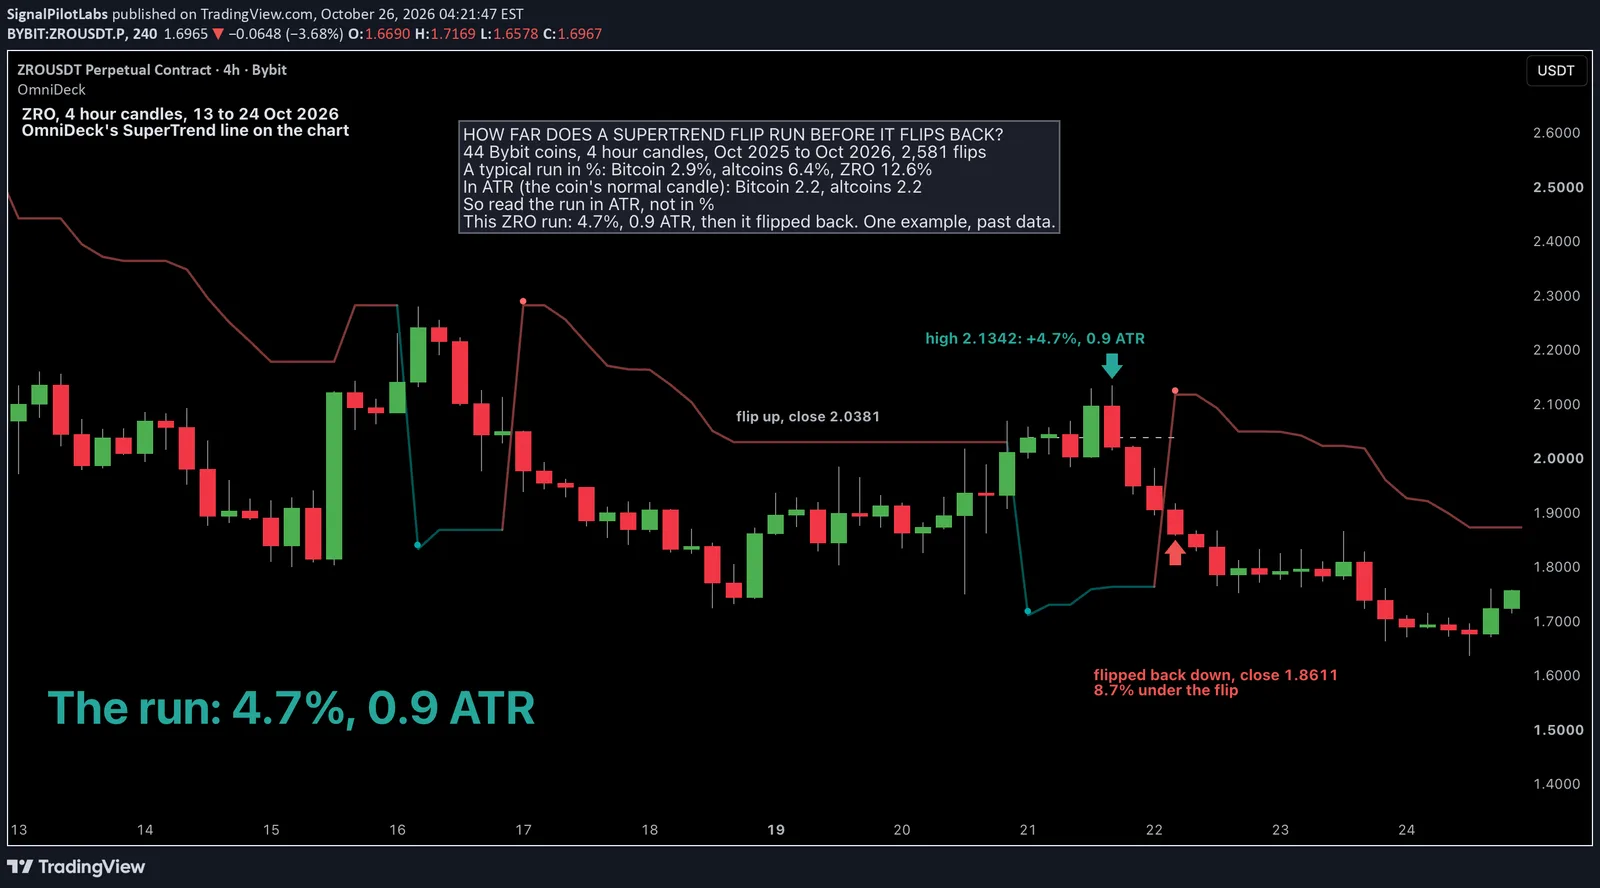
ZRO, 4 hour, 13 to 24 October 2026. The SuperTrend flipped up on the 00:00 UTC candle of 21 October, with a close of 2.0381. Four candles later ZRO reached 2.1342, 4.7% and 0.9 ATR above the flip. On the 04:00 UTC candle of 22 October it flipped back down, closing at 1.8611, 8.7% under the flip.
ZRO’s flip up on 12 October is the move our 14 October post read with Janus Atlas: it ran 12.6%, 3.0 ATR. This one ran less than 1 ATR and gave it all back, the short end of the table. The example was picked by a rule we wrote before looking: the most recent finished flip on the coin with the largest typical run. The numbers above cover all 2,581.
How to do it
- In OmniDeck’s settings, switch off the systems you don’t need and keep SuperTrend on. A dot marks each flip.
- Note the flip candle’s close and the coin’s ATR (14) on that candle.
- Read the move in ATR. About 2 ATR was typical on every coin we measured. On Bitcoin that’s around 3%, on a coin like ZRO more than 10%.
- Don’t wait for the next flip to tell you the run is over. In two thirds of cases price was back past the first flip by the time it printed.
What this does not tell you
This describes what flips gave. It doesn’t compare them with random entries, and the top of a run is only known afterwards. No fees. One timeframe, one exchange, one year, past data.
Observations, not recommendations.
We’re Signal Pilot Labs. We build the Elite Seven, seven indicators for TradingView, and we post what we measure, including the parts that didn’t work.
See what we build at signalpilot.io.
Published as a TradingView Idea on ZROUSDT. View the chart on TradingView
Past measurement described after the fact. Nothing here is a recommendation or an indication of future results.