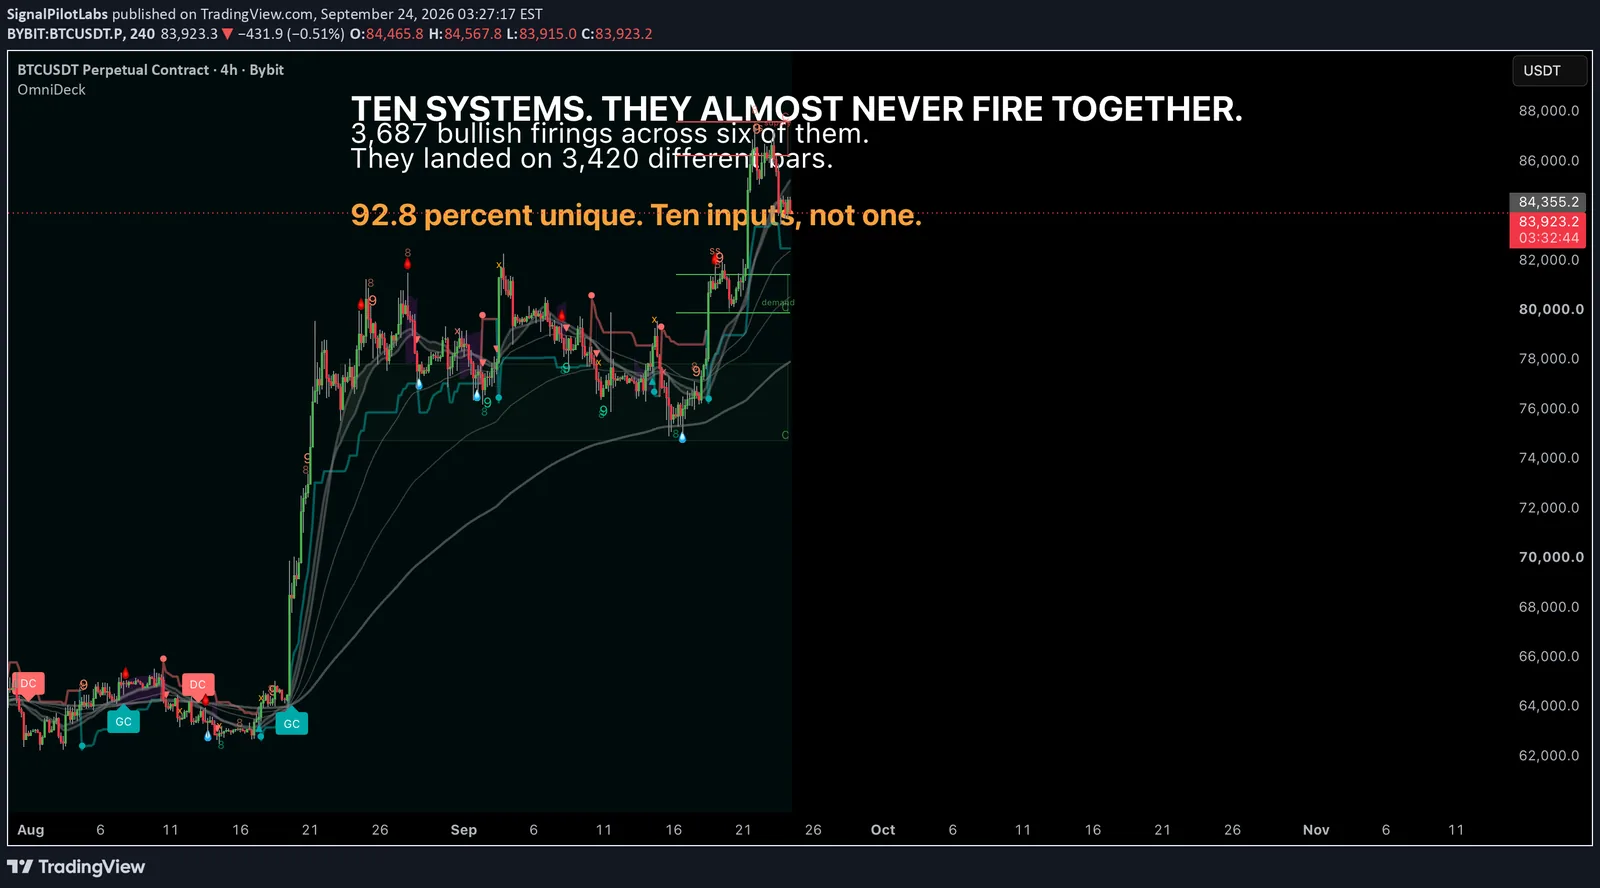
Published as a TradingView Idea on BTCUSDT. View the chart on TradingView
There is one fair objection to every all in one indicator, and you should hold your own tools to it. Is this ten inputs, or is it one input wearing ten hats?
A moving average cross, a trend flip and a band break can look like three independent opinions while being three views of the same number. If they are, a screen full of agreement is not confluence. It is one signal counted three times, and it will feel most convincing exactly when it is most redundant.
The useful part is that this is measurable in an afternoon, on your own charts, with no statistics beyond counting. Here is the method first, because it is yours to reuse, and our own numbers after it.
The method, in three steps
Take each subsystem separately and give every firing a key made of three things: the symbol, the timeframe, and the bar. A cross on SOLUSDT on the four hour chart at 08:00 is one key. The same cross on the one hour chart is a different key, and so is the same cross on a different symbol.
Count the keys. Not the firings, the distinct keys. If six subsystems fired a thousand times between them and produced a thousand distinct keys, no two of them ever landed on the same bar. If they produced six hundred, they are standing on top of each other a great deal.
Then take them two at a time. Count the bars where both fired, and divide that count by how often each one fired on its own.
Why that division has two answers
This is the step most people do once and should do twice.
Two subsystems share a number of bars, and that number has two denominators, because the two subsystems do not fire equally often. Divide by the busy one and the overlap looks negligible. Divide by the quiet one and it can look enormous. Both fractions are arithmetically correct and they describe completely different situations.
The one that matters is the larger. The subsystem that fires less often is the one at risk of being a copy, because it has fewer firings to be original in. If a system fires four hundred times and three hundred of those bars are also covered by a busier system, it is adding very little, and dividing by the busier system’s two thousand firings will hide that behind a comfortable fifteen percent.
So keep the larger of the two. It is the honest one, and it is the one that answers the question you actually asked.
What we got on OmniDeck
We ran it on six of OmniDeck’s bullish subsystems over eight weeks, across 111 symbols and nine timeframes from five minutes to daily. That is 366 symbol and timeframe cells with something in them.
Those six fired 3,687 times, and those 3,687 firings landed on 3,420 different bars.
That is 92.8 percent unique. The overlap across the whole bullish set is 7.2 percent.
The most redundant pair in the set is the Bull Market Support Band cross and the SuperTrend flip. They land on the same bar 124 times. Read one way that is 6.9 percent of the band’s 1,786 firings. Read the other way it is 31 percent of the trend flip’s 403, because the band fires more than four times as often as the flip does. The larger number is the honest one, and 31 percent is the figure we would defend. The median pair in the set overlaps on 2.0 percent, read the same way.
The bearish side mirrors it. 3,740 firings on 3,462 distinct bars, which is 92.6 percent unique, with the same pair at the top and the same asymmetry: 5.8 percent of the band’s firings, 27 percent of the trend flip’s.
We also added a seventh system to the bullish set as a check, the EMA golden cross, which fires 172 times in the window. Uniqueness came out at 92.7 percent. The finding does not depend on which six we picked.
What that means, stated narrowly
The systems are not copies of each other. When two of them line up on the same bar, that is a genuinely uncommon event rather than an arithmetic certainty.
That is worth knowing before you read any consensus display, ours or anyone else’s. A count of agreeing systems is only as meaningful as the independence of the things being counted. Ten agreeing inputs that are really one input is not a ten. It is a one with a loud user interface, and the number on the screen looks identical in both cases.
What it does not mean
It does not mean agreement predicts. Independence of firing and predictive power are two different questions, and this measurement answers only the first one. Anyone who shows you an overlap table and calls it an edge has skipped a step.
It also does not mean more agreement is better. That is its own test, with its own null, and it deserves its own post rather than a sentence at the end of this one.
Run it on your own setup
Pick any two indicators you use together. Log the bars where each one fires for a month. Count the shared bars, divide by each one’s own total, and keep the larger percentage.
If the answer is above about half, you are not looking at two opinions, and the comfort you feel when they agree is manufactured.
Caveats
Same bar is a strict test. A system that agrees one bar later counts as a disagreement here, so these overlap figures are a floor rather than a ceiling. A looser window would find more of it.
This is in sample and descriptive. It counts what fired, on our own event record, between 30 July and 23 September 2026, and nothing in it is a claim about what happens next.
Observations, not recommendations.
Published as a TradingView Idea on BTCUSDT. View the chart on TradingView
Past measurement of our own tooling, described after the fact. Nothing here is a recommendation or an indication of future results.