Published as a TradingView Idea on USOIL. View the chart on TradingView
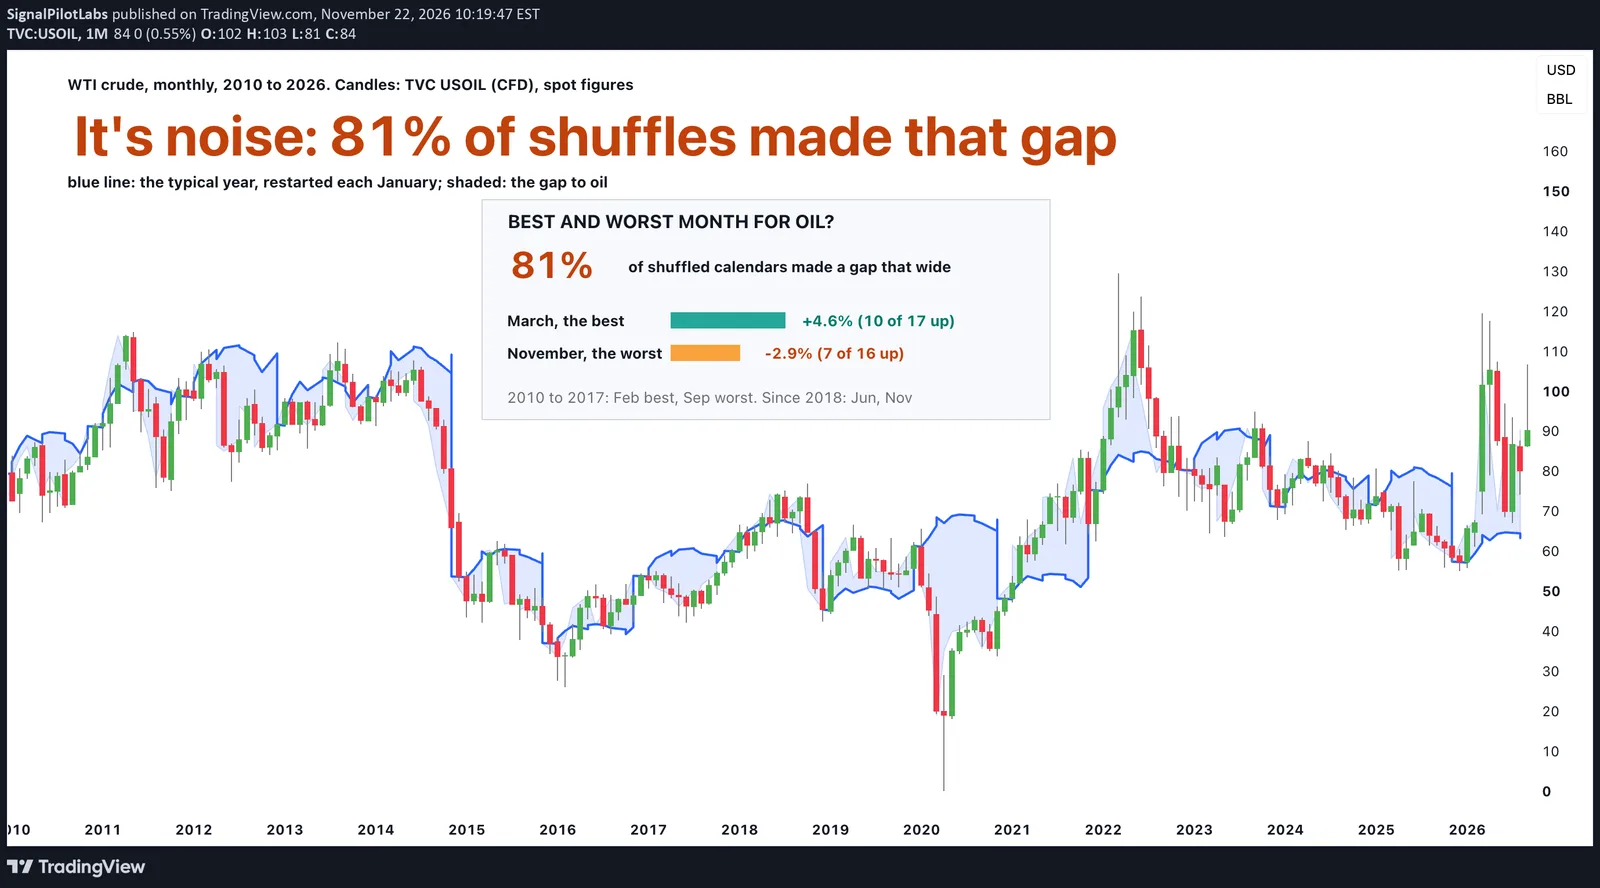
Does oil have a good month and a bad month? March looked best (+4.6%) and November worst (-2.9%), but luck matched that gap 81% of the time. We took every month from January 2010 to September 2026 and measured the change in the WTI crude price in each.
What we measured
The WTI spot price at Cushing (FRED DCOILWTICO on TradingView), monthly, January 2010 to September 2026: 201 months. Spot has no futures roll inside a month. A month’s change is its close against the previous month’s close. Each calendar month gets 17 of them (January to September) or 16 (October to December), and for each we took the median (the middle one) and how many times oil rose.
What we found
March came out best: a median change of +4.6%, up in 10 of 17 years. November came out worst: -2.9%, up in 7 of 16.
| Month | Median change (%) | Years oil rose | 2010 to 2017 (%) | 2018 to 2026 (%) | Futures CFD (%) |
|---|---|---|---|---|---|
| March | +4.6 | 10 of 17 | +1.7 | +4.6 | +5.1 |
| December | +4.5 | 9 of 16 | +4.5 | +2.4 | +3.9 |
| February | +3.9 | 11 of 17 | +4.9 | +3.8 | +3.2 |
| April | +3.1 | 11 of 17 | +2.5 | +4.0 | +2.9 |
| June | +2.6 | 10 of 17 | -1.5 | +7.9 | +2.5 |
| July | +0.6 | 11 of 17 | +2.0 | +0.6 | +0.5 |
| January | -0.4 | 8 of 17 | -1.2 | +7.2 | +0.8 |
| August | -0.4 | 7 of 17 | +1.2 | -5.9 | -1.8 |
| October | -1.0 | 7 of 16 | 0.0 | -1.2 | -1.4 |
| September | -1.8 | 7 of 17 | -4.8 | -1.8 | -2.5 |
| May | -2.1 | 7 of 17 | -1.7 | -2.3 | -1.5 |
| November | -2.9 | 7 of 16 | +3.0 | -6.1 | -3.5 |
Is the gap real or luck?
Twelve months will always have a best and a worst. To see how wide a gap luck alone makes, we dealt the 201 changes out to random month labels 10,000 times and took the best-to-worst gap each time. A gap as wide as March to November, 7.5 points, came up in 81% of the shuffles. It’s the size random labels make.
The halves agree with that. From 2010 to 2017 the best month was February and the worst September; from 2018 to 2026, June and November. November itself rose in the first half (+3.0%) and fell in the second (-6.1%).
The futures CFD most charts show (TVC USOIL) gives the same March and November, so the roll inside each futures month is not what made them.
What to do with it
Don’t plan an oil trade around the calendar month. Our post on natural gas in winter and summer asked the same calendar question of gas. Its winter weeks ran 1.3 times as wide as summer in 12 of 16 years; oil’s months showed no such pattern.
On the chart
Oil’s monthly candles from TradingView’s TVC USOIL, the futures CFD, January 2010 to September 2026. The blue line is the typical year: each month moves by its median change, starting again from each December’s close; the shaded area is the gap between that line and what oil did. Most years leave the line far behind. We drew the line after the first build in place of two strips of March and November cells; the figures are unchanged.
How to check a season on your own market
- Gather as many years of monthly closes as you can, and turn each one into a move against the close a month earlier.
- Sort the changes into the twelve calendar months, then note each month’s middle change and how often it rose.
- Reassign the months at random, many times over, and see how often the gap between the best and worst month comes out as wide as yours.
- Split the years in two. A real season shows up in both halves.
What this does not tell you
Which way oil will go in any month. Sixteen or seventeen years per month is a small sample, and a calendar month is not a cause. Past data.
Observations, not recommendations.
We’re Signal Pilot Labs. We build the Elite Seven, seven indicators for TradingView, and we post what we measure, including the parts that didn’t work.
See what we build at signalpilot.io.
Published as a TradingView Idea on USOIL. View the chart on TradingView
Past measurement described after the fact. Nothing here is a recommendation or an indication of future results.