Published as a TradingView Idea on NG1!. View the chart on TradingView
Natural gas is a heating fuel, so its price should swing more in winter. We measured how wide a normal week was in each calendar month, from 2010 to 2025.
What we measured
TradingView daily candles for natural gas futures (NYMEX NG1!, the front month). A week’s range runs from its high to its low, Monday to Friday, over the week’s first price. The front month switches contracts near the end of each month, so every week near a switch was left out, about one week in three in every month: 561 weeks kept.
What we found
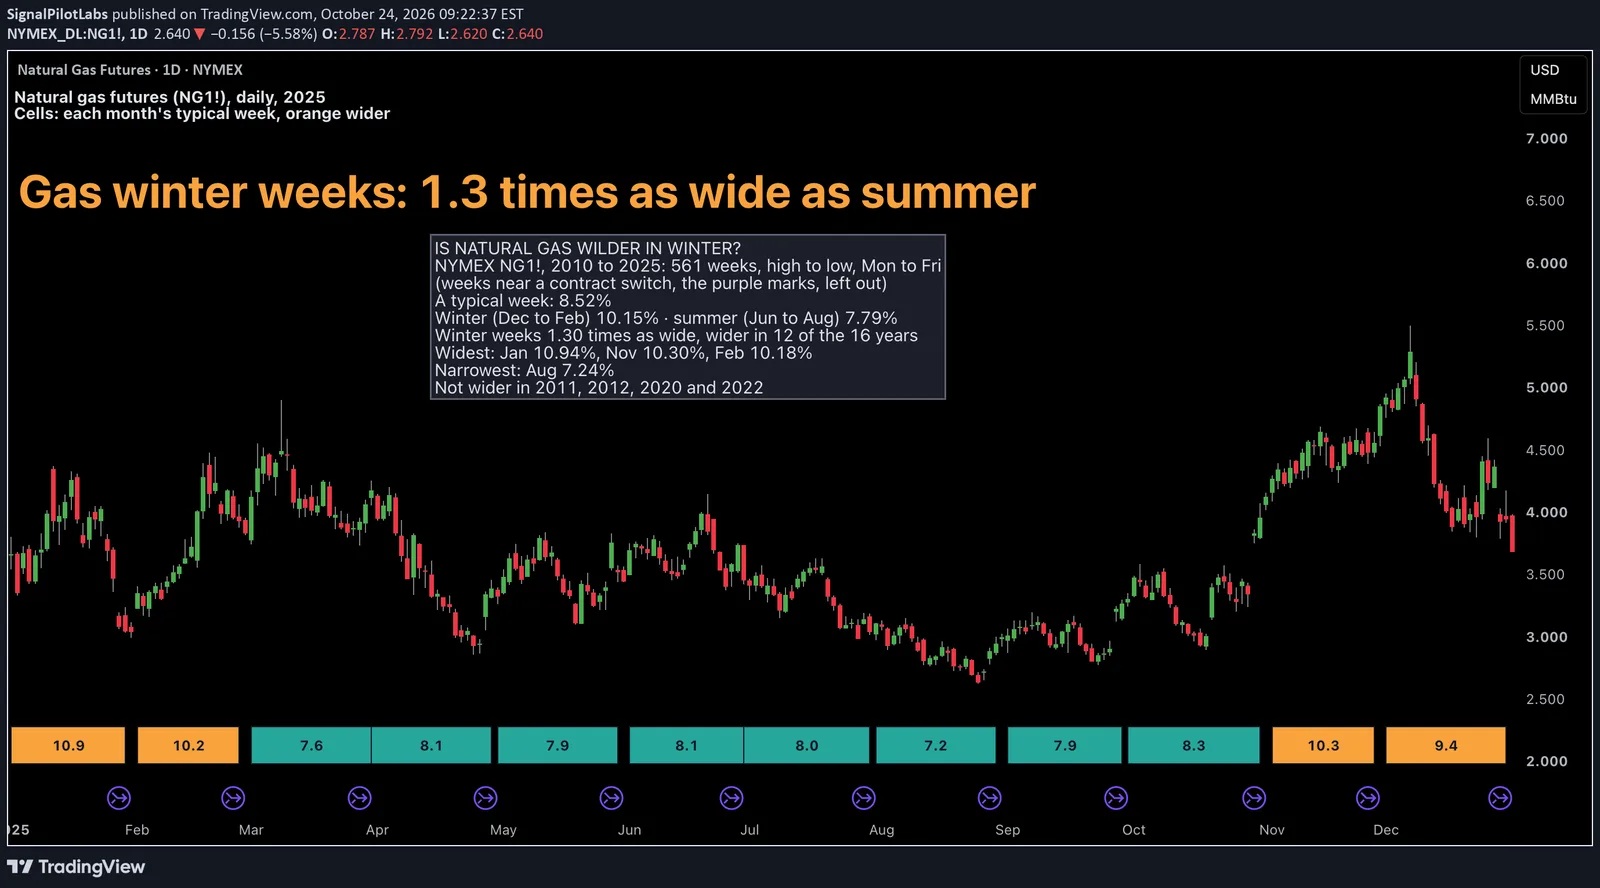
A normal week moved 8.52% high to low. The four widest months were January 10.94%, November 10.30%, February 10.18% and December 9.43%. The narrowest was August at 7.24%.
| Month | Median weekly range (%) | Weeks |
|---|---|---|
| January | 10.94 | 48 |
| February | 10.18 | 42 |
| March | 7.63 | 48 |
| April | 8.08 | 46 |
| May | 7.92 | 48 |
| June | 8.15 | 46 |
| July | 7.98 | 48 |
| August | 7.24 | 48 |
| September | 7.90 | 46 |
| October | 8.31 | 48 |
| November | 10.30 | 45 |
| December | 9.43 | 48 |
Winter weeks, December to February, ran 10.15%, and summer weeks, June to August, 7.79%: about 1.3 times as wide.
Every year?
Not every year, but most: winter was wider than summer in 12 of the 16 years. The exceptions were 2011, 2012, 2020 and 2022, when the summer weeks ran wider. If it were a coin toss each year, 12 or more of 16 would come up about 4% of the time, a check we added after the run.
What to do with it
Size a natural gas position for the season. A stop set for a summer week meets a winter week about 30% wider at the median. Our post on gold, silver and copper measured the same weekly range for metals.
On the chart
Natural gas, daily, 2025. The cells along the bottom give each month’s median weekly range over 2010 to 2025: orange where it is above the 8.52% median, teal where it is below. The purple marks are TradingView’s contract switches.
How to check a market’s seasons yourself
- Take daily candles and work out each week’s high to low inside the week.
- Leave out the weeks with a contract switch, then group the rest by calendar month.
- Compare the seasons year by year, not only on the average.
What this does not tell you
How wide this winter’s weeks will be, or which way gas will go. Past data.
Observations, not recommendations.
We’re Signal Pilot Labs. We build the Elite Seven, seven indicators for TradingView, and we post what we measure, including the parts that didn’t work.
See what we build at signalpilot.io.
Published as a TradingView Idea on NG1!. View the chart on TradingView
Past measurement described after the fact. Nothing here is a recommendation or an indication of future results.