Published as a TradingView Idea on NG1!. View the chart on TradingView
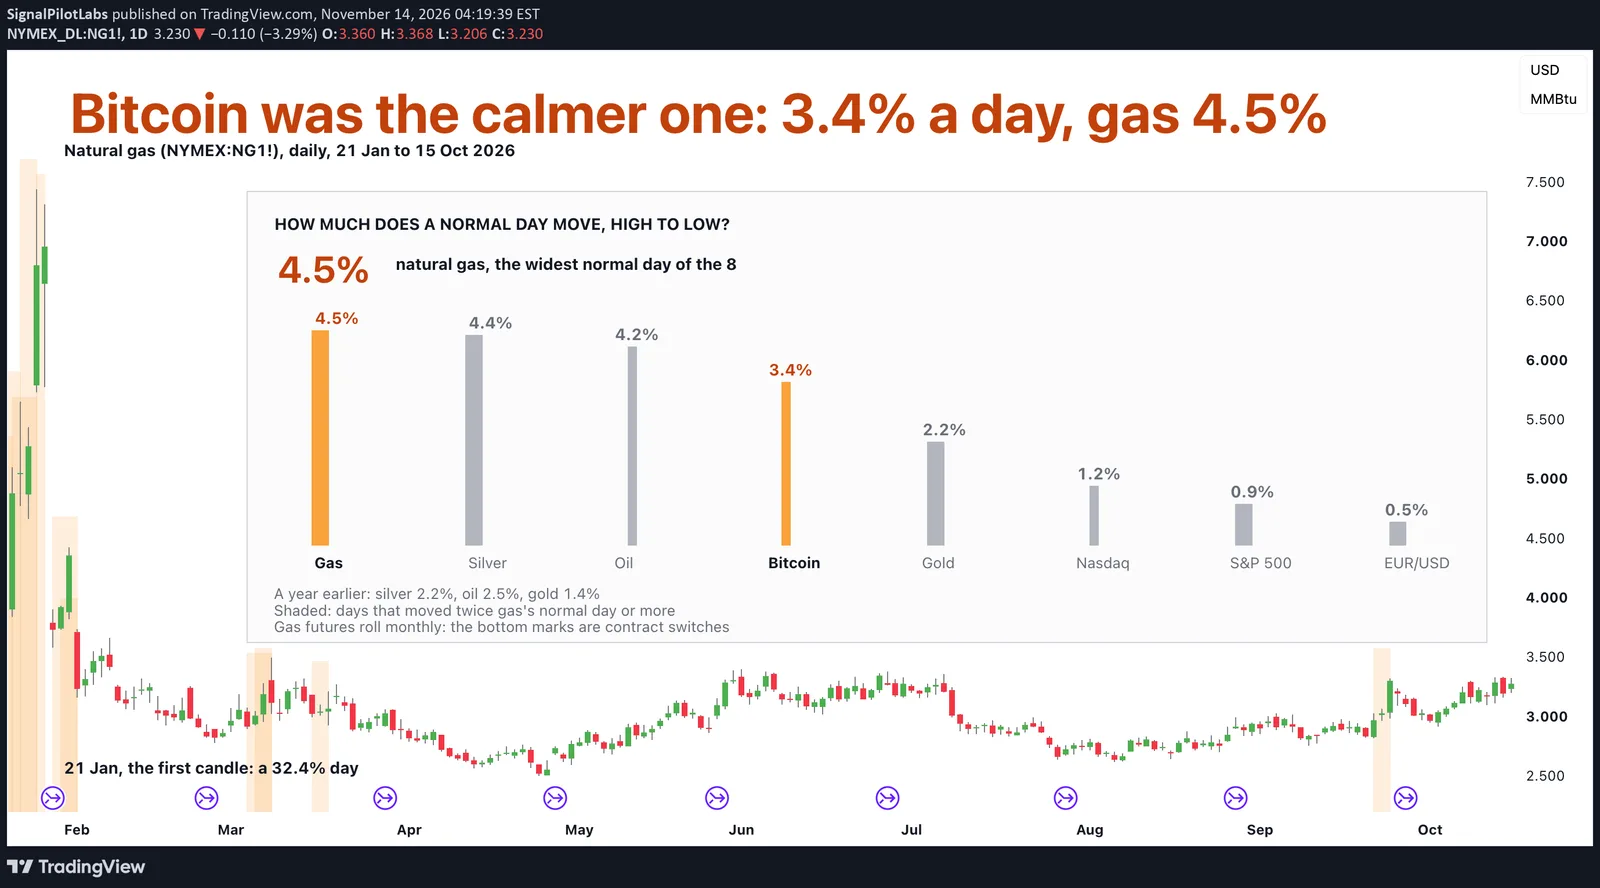
Does Bitcoin move more in a day than oil, gas or silver? Over the last year it moved less than all three. On a typical day natural gas moved 4.5% from high to low, and Bitcoin 3.4%.
What we measured
We took TradingView daily candles for 8 markets, from 16 October 2025 to 15 October 2026: gold, silver, WTI oil, natural gas, EUR/USD, the S&P 500, the Nasdaq 100 and Bitcoin. For each day we measured the high minus the low, as a share of the open. The normal day is the median day, the middle one when all the year’s days are lined up by size. Bitcoin trades every day while the others trade only on weekdays, so we compare it on its Monday to Friday candles. We wrote these rules down before we read a single candle.
How to work out a day’s range
Each day’s range is its high minus its low, divided by its open. On 21 January 2026 natural gas opened at 3.903, reached 5.099 and fell as low as 3.834. So 5.099 minus 3.834, divided by 3.903, is 32.4%, the widest day gas had all year.
What we found
Natural gas moved the most, 4.5% on a normal day. Then came silver at 4.4% and WTI oil at 4.2%. All three swung wider than Bitcoin, which covered 3.4% on weekdays (3.0% counting weekends).
Below Bitcoin, gold moved 2.2% a day and the Nasdaq 100 moved 1.2%. That left the S&P 500 at 0.9% and EUR/USD at 0.5%.
Against that S&P 500 day, a typical day in gas was 5.2 times as wide. Silver’s was 5.1 times, oil’s 4.8 and Bitcoin’s 4.0, while EUR/USD moved about half as much as the index.
Gas also moved more than 2% on 250 of its 251 days. That happened on 8 of the S&P 500’s days.
Did the order hold all year?
We split the year into two halves at 15 April. Gas and silver out-moved Bitcoin in both. Oil did so only in the second half: 3.2% against Bitcoin’s 3.9% in the first, then 4.8% against 2.9%.
And a year earlier the order was different again. Then silver’s normal day was 2.2% and oil’s 2.5%, both below Bitcoin, whose own day barely changed.
The biggest days
Oil’s biggest day was 39.1%, on 9 March 2026, and it closed 13.2% lower. Silver’s top day was 38.6% on 30 January, and gas’s 32.4% on the 21st. Bitcoin’s top day was 18.7%, on 6 February. The S&P 500’s top day was 3.5%, on 20 November 2025.
All 8 markets
| Market | A normal day, high to low (%) | Times the S&P 500 | Days over 2% | Days measured | A year earlier (%) |
|---|---|---|---|---|---|
| Natural gas | 4.5 | 5.2 | 250 | 251 | 5.1 |
| Silver | 4.4 | 5.1 | 255 | 258 | 2.2 |
| WTI oil | 4.2 | 4.8 | 228 | 251 | 2.5 |
| Bitcoin, weekdays | 3.4 | 4.0 | 230 | 261 | 3.4 |
| Bitcoin, all days | 3.0 | 3.5 | 275 | 365 | 2.9 |
| Gold | 2.2 | 2.5 | 145 | 258 | 1.4 |
| Nasdaq 100 | 1.2 | 1.4 | 36 | 251 | 1.1 |
| S&P 500 | 0.9 | 1.0 | 8 | 251 | 0.9 |
| EUR/USD | 0.5 | 0.6 | 0 | 259 | 0.7 |
On the chart
The chart shows natural gas, daily, from 21 January to 15 October 2026: the market with the widest normal day, picked by a rule we set before measuring. Its biggest day is the first candle, and every day that moved twice its normal day or more is shaded. It is a continuous futures chart, NG1!, so the marks along the bottom are contract switches. A gap there is a switch, not a move, and no day’s range includes one.
How to read a normal day
- Work out the range: the high minus the low, divided by the open.
- Then take the median of a year of those days, not the average: a few big days pull an average up.
- Compare markets on the same days. Bitcoin trades at weekends, when it moves less, so set its weekdays beside markets that close at weekends.
Gold’s typical week, 5.1% at the median, is in our post on gold, silver and copper, with silver and copper beside it.
The same measure over a week, for 50 coins, is in our post on 50 coins’ normal week, from Bitcoin’s 8.1% to AKE’s 45.0%.
What this does not tell you
This describes one year. We did not test it against luck, and it says nothing about how far any market moves next. A wide normal day doesn’t tell you to buy or sell, and a calm market can still have a big day. Its daily ranges also include wicks. Past data.
Observations, not recommendations.
We’re Signal Pilot Labs. We build the Elite Seven, seven indicators for TradingView, and we post what we measure, including the parts that didn’t work.
See what we build at signalpilot.io.
Published as a TradingView Idea on NG1!. View the chart on TradingView
Past measurement described after the fact. Nothing here is a recommendation or an indication of future results.