Published as a TradingView Idea on AKEUSDT. View the chart on TradingView
How long did the losing runs get? For 50 coins we found the longest run of losing days in the year to 15 October 2026, and looked at what came after five losses in a row.
What we measured
Bybit daily closes for 50 coins, the 365 days from 16 October 2025 to 15 October 2026, in UTC. A losing day closes below the day before. A run counts the losing days in a row, and its fall runs from the close before it started to its last close.
What we found
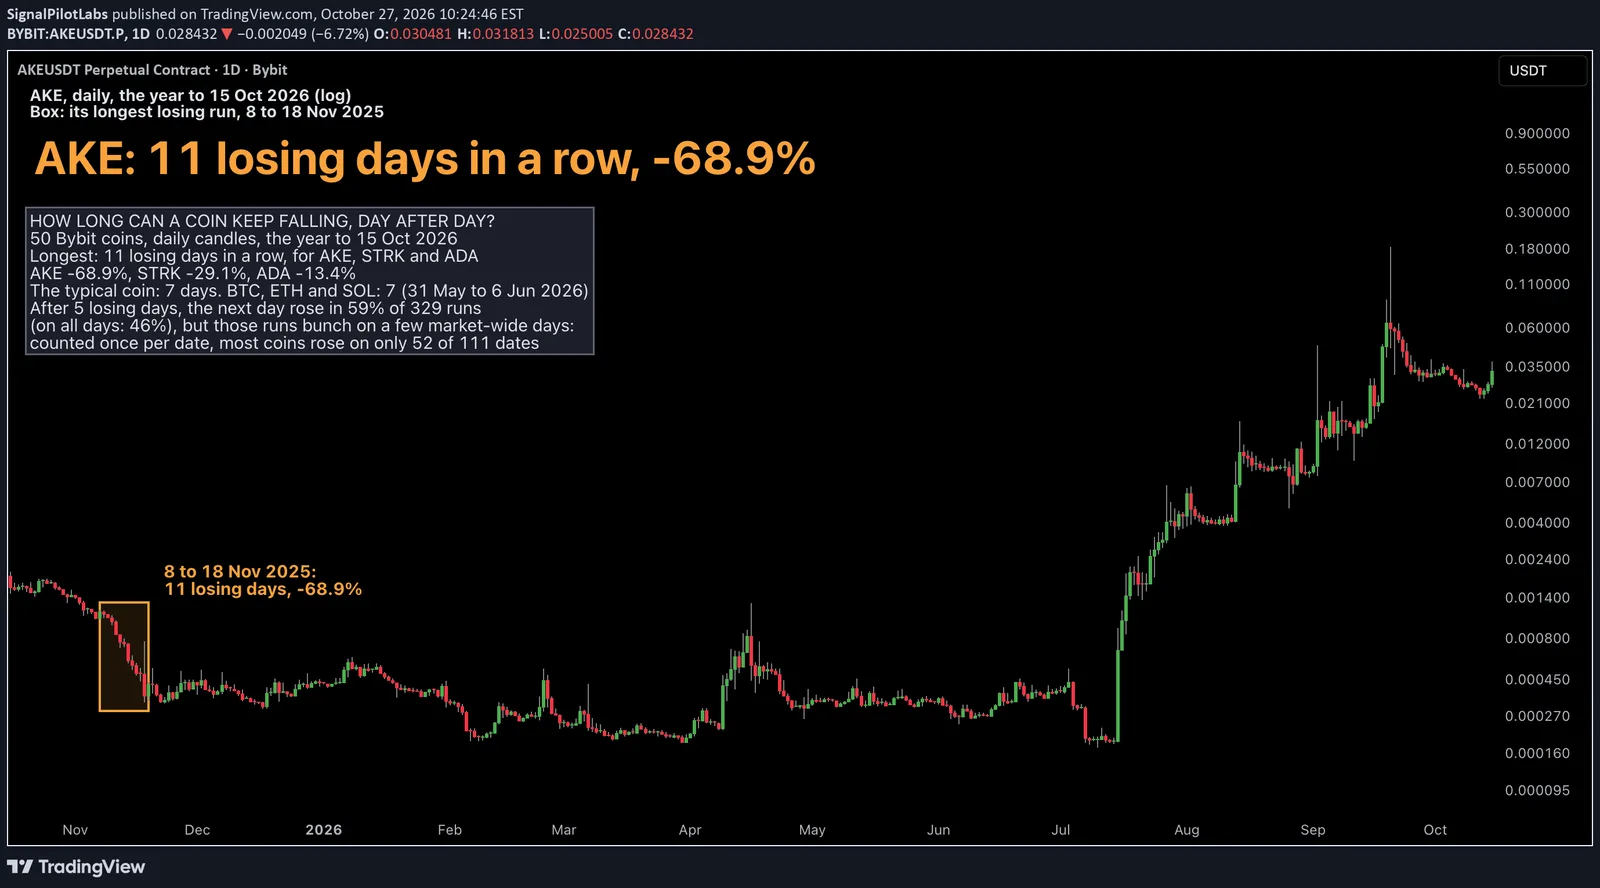
The longest runs were 11 losing days, and three coins had one: AKE from 8 to 18 November 2025, down 68.9%; STRK from 9 to 19 May 2026, down 29.1%; and ADA from 7 to 17 August 2026, down 13.4%. The same length, very different falls.
The median coin’s longest run was 7 days. BTC, ETH and SOL all ran 7, the same 7 days from 31 May to 6 June 2026: Bitcoin fell 17.6%, Ethereum 22.4% and Solana 24.8%.
| Coin | Longest losing run (days) | From | To | Fall over the run (%) | Runs of 5 days or more |
|---|---|---|---|---|---|
| AKE | 11 | 2025-11-08 | 2025-11-18 | -68.9 | 8 |
| STRK | 11 | 2026-05-09 | 2026-05-19 | -29.1 | 8 |
| ADA | 11 | 2026-08-07 | 2026-08-17 | -13.4 | 11 |
| XLM | 10 | 2026-06-19 | 2026-06-28 | -26.2 | 7 |
| WLD | 9 | 2026-06-23 | 2026-07-01 | -41.6 | 15 |
| ENA | 9 | 2025-10-27 | 2025-11-04 | -37.5 | 12 |
| MOVR | 9 | 2025-12-10 | 2025-12-18 | -24.4 | 8 |
| INJ | 9 | 2026-06-16 | 2026-06-24 | -23.6 | 7 |
| BR | 9 | 2025-11-13 | 2025-11-21 | -18.5 | 5 |
| TRUMP | 9 | 2025-12-10 | 2025-12-18 | -15.5 | 11 |
| USELESS | 8 | 2025-11-10 | 2025-11-17 | -48.8 | 2 |
| TIA | 8 | 2026-05-26 | 2026-06-02 | -24.0 | 8 |
| DOT | 8 | 2026-05-26 | 2026-06-02 | -14.4 | 13 |
| RLC | 8 | 2026-07-22 | 2026-07-29 | -13.8 | 9 |
| XPL | 8 | 2026-04-27 | 2026-05-04 | -12.0 | 8 |
| AAVE | 8 | 2026-08-09 | 2026-08-16 | -5.7 | 4 |
| FIL | 7 | 2025-11-08 | 2025-11-14 | -40.8 | 4 |
| LSK | 7 | 2025-11-16 | 2025-11-22 | -37.6 | 8 |
| ZRO | 7 | 2026-02-12 | 2026-02-18 | -29.3 | 9 |
| SOL | 7 | 2026-05-31 | 2026-06-06 | -24.8 | 7 |
| AERO | 7 | 2026-05-31 | 2026-06-06 | -24.0 | 8 |
| ETH | 7 | 2026-05-31 | 2026-06-06 | -22.4 | 5 |
| SUI | 7 | 2026-05-11 | 2026-05-17 | -21.7 | 7 |
| OP | 7 | 2026-05-11 | 2026-05-17 | -21.4 | 8 |
| PENGU | 7 | 2026-09-07 | 2026-09-13 | -20.6 | 6 |
| APT | 7 | 2025-11-25 | 2025-12-01 | -20.2 | 6 |
| ARB | 7 | 2026-05-11 | 2026-05-17 | -19.1 | 5 |
| TAO | 7 | 2025-11-11 | 2025-11-17 | -19.1 | 7 |
| BTC | 7 | 2026-05-31 | 2026-06-06 | -17.6 | 4 |
| XRP | 7 | 2025-11-11 | 2025-11-17 | -14.3 | 10 |
| ONDO | 7 | 2026-06-19 | 2026-06-25 | -14.3 | 6 |
| QNT | 7 | 2025-12-01 | 2025-12-07 | -14.2 | 7 |
| ZEC | 7 | 2026-07-19 | 2026-07-25 | -13.1 | 5 |
| HBAR | 7 | 2026-01-06 | 2026-01-12 | -12.6 | 6 |
| NEAR | 7 | 2026-03-24 | 2026-03-30 | -11.4 | 11 |
| UNI | 7 | 2026-06-17 | 2026-06-23 | -11.1 | 7 |
| DOGE | 7 | 2026-01-06 | 2026-01-12 | -10.0 | 7 |
| DASH | 6 | 2025-11-27 | 2025-12-02 | -31.8 | 6 |
| SAND | 6 | 2026-06-01 | 2026-06-06 | -26.9 | 3 |
| PUMPFUN | 6 | 2026-01-28 | 2026-02-02 | -24.3 | 6 |
| BNB | 6 | 2026-05-31 | 2026-06-05 | -20.4 | 4 |
| XMR | 6 | 2025-11-16 | 2025-11-21 | -20.0 | 1 |
| LINK | 6 | 2026-05-31 | 2026-06-05 | -19.9 | 4 |
| HYPE | 6 | 2025-10-30 | 2025-11-04 | -18.7 | 4 |
| VVV | 6 | 2026-07-27 | 2026-08-01 | -16.0 | 7 |
| LTC | 6 | 2025-12-10 | 2025-12-15 | -9.7 | 3 |
| AVAX | 6 | 2026-01-07 | 2026-01-12 | -7.5 | 6 |
| FARTCOIN | 5 | 2026-01-28 | 2026-02-01 | -30.0 | 2 |
| BCH | 5 | 2025-12-20 | 2025-12-24 | -9.0 | 5 |
| 1000PEPE | 5 | 2026-06-27 | 2026-07-01 | -2.6 | 1 |
After five losses in a row
After a coin’s fifth losing day in a row, the next day closed up in 195 of 329 runs, 59%. Across all days, coins closed up 46% of the time.
That looks like a bounce, but most of those runs ended on the same few days, when the whole market turned: on 12 February 2026 all 19 coins on a run rose. Counted once per date, the 329 runs fall on 111 dates, and on only 52 of them did most of the coins rise. We added that check after seeing the first number, so treat it as a check, not a test.
One correction: our first version of this measure looked at the day after a run ended. A run ends on a day that isn’t a loss, so that day was up or flat by definition. We changed it to the day after the fifth loss, whether the run went on or not, before writing any of this.
Our post on 10% wick days measured how often 50 coins printed a 10% wick in a year.
On the chart
AKE, daily, 16 October 2025 to 15 October 2026, on a log scale: the longest run of all, picked by a rule we set before counting (ties went to the larger fall). The box holds its eleven losing days.
How to count a run on your own chart
- Use daily closes and mark each day that closes below the day before.
- Count the marked days in a row; a day that closes level or higher ends the run.
- For the fall, take the close before the run began and the run’s last close.
- Before reading anything into what came next, check whether the runs ended on the same days as the rest of the market.
What this does not tell you
When a run will end. A run of losses isn’t a signal, and the bounce after five losses comes mostly from a few days when every coin turned together. Past data.
Observations, not recommendations.
We’re Signal Pilot Labs. We build the Elite Seven, seven indicators for TradingView, and we post what we measure, including the parts that didn’t work.
See what we build at signalpilot.io.
Published as a TradingView Idea on AKEUSDT. View the chart on TradingView
Past measurement described after the fact. Nothing here is a recommendation or an indication of future results.