Published as a TradingView Idea on MOVRUSDT. View the chart on TradingView
Many traders read the long/short ratio as a crowd to fade: when nearly everyone is long, expect a drop. We measured it on 50 Bybit coins over the year to 15 October 2026.
What we measured
Bybit’s daily long/short account ratio, the share of accounts net long on each coin’s perpetual. A day counts as an extreme when the ratio sat beyond the top or the bottom 10% of that coin’s previous 90 days: the crowd most long, or most short. Two extremes on the same side count only when they are 7 days or more apart. For each one, the coin’s next 7 days against its own normal week over the year.
What we found
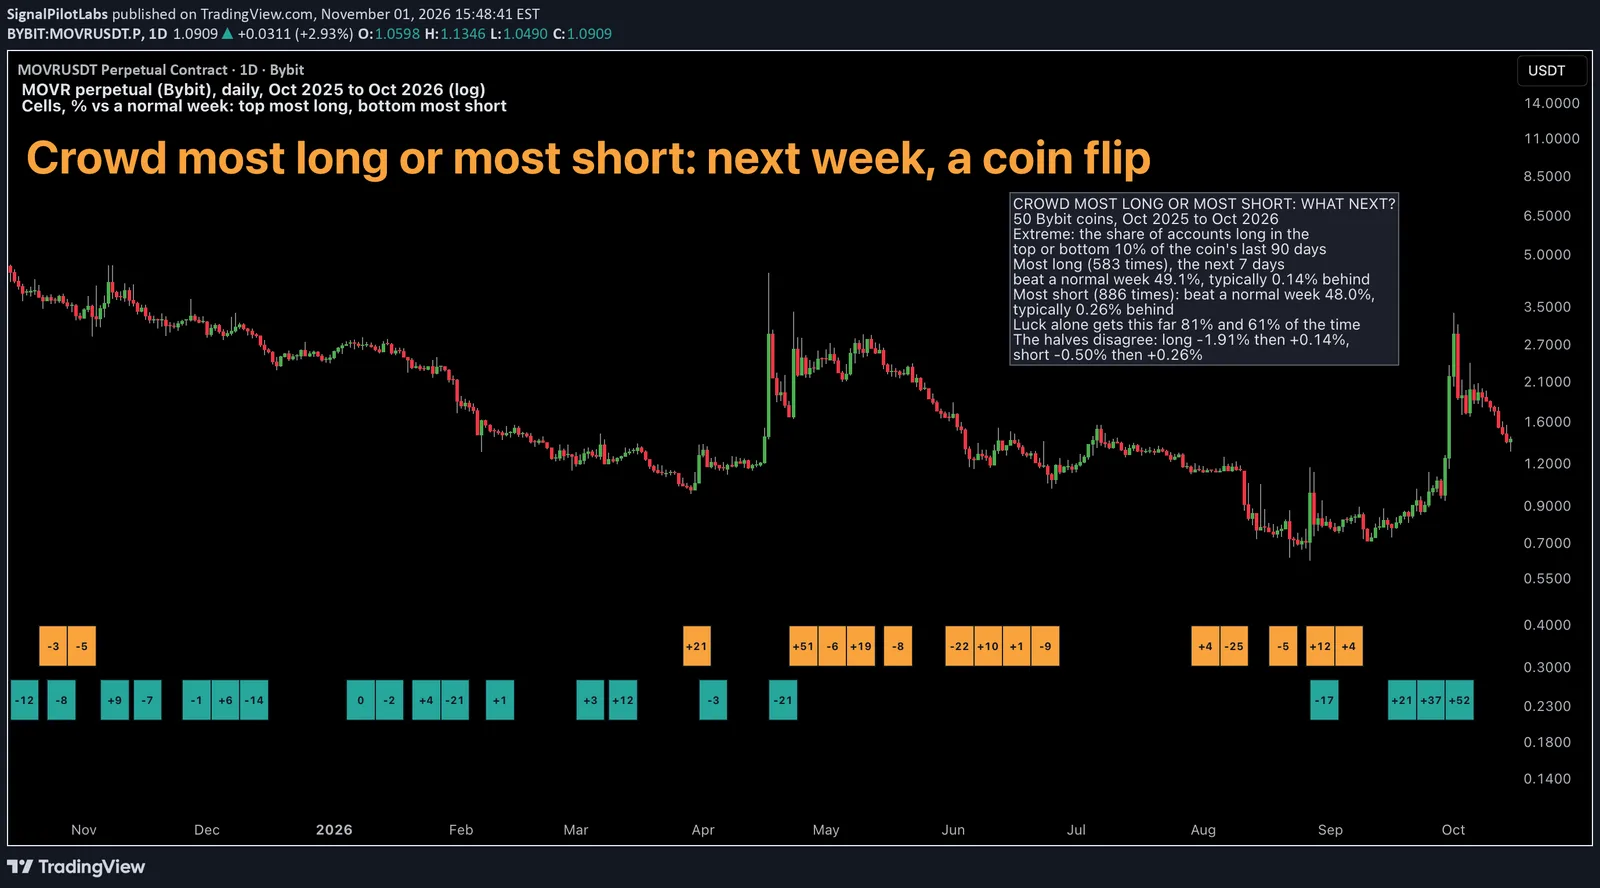
When the crowd was most long, 583 times, the next 7 days beat a normal week 49.1% of the time, with a median of -0.14% against it. When the crowd was most short, 886 times, they beat it 48.0% of the time, a median of -0.26%. Both sides look like ordinary weeks.
| The crowd | Times | Days | Beat a normal week (%) | Median against it (%) | First half (%) | Second half (%) |
|---|---|---|---|---|---|---|
| Most long | 583 | 224 | 49.1 | -0.14 | -1.91 | +0.14 |
| Most short | 886 | 290 | 48.0 | -0.26 | -0.50 | +0.26 |
Is it luck?
Extremes bunch on the same days across coins, so we shifted every coin’s dates by the same number of days, 345 different ways, keeping the bunching. 81% of the shifts for the crowd long, and 61% for the crowd short, came out as far from zero as the real result. The two halves of the year did not agree either.
What to do with it
On Bybit, a crowded long or a crowded short told nothing about the next week, either way. Our post on a year of funding measured what longs paid to hold their trade: 27% over the year on USELESS, 2.6% on BTC.
On the chart
MOVR, the coin with the most extremes (16 crowd long, 20 crowd short), daily, on a log scale. Each cell covers the 7 days after an extreme: orange on top for the crowd most long, teal below for the most short, labelled with MOVR’s return against its normal week. Big weeks came after both kinds: +51% after a crowded long in April, +37% and +52% after crowded shorts in September.
How to check the crowd on your coin
- Take a year of your coin’s daily long/short ratio and its daily closes.
- Mark the days the ratio sits beyond the top or the bottom 10% of its last 90 days.
- Compare the 7 days after each one with the coin’s normal week, then shift the dates to see what luck gives.
What this does not tell you
Which way any coin goes next week. One year, one exchange’s crowd. Past data.
Observations, not recommendations.
We’re Signal Pilot Labs. We build the Elite Seven, seven indicators for TradingView, and we post what we measure, including the parts that didn’t work.
See what we build at signalpilot.io.
Published as a TradingView Idea on MOVRUSDT. View the chart on TradingView
Past measurement described after the fact. Nothing here is a recommendation or an indication of future results.