Published as a TradingView Idea on USELESSUSDT. View the chart on TradingView
Hold a long on a perpetual future and you pay funding every few hours, or get paid it. Over a year that adds up, and how much depends a lot on the coin. Here is the whole year for the 50 most traded perpetuals on Bybit, coin by coin, so you can find yours.
What we measured
The 50 most traded crypto perpetuals on Bybit, ranked by turnover from 11 September to 10 October 2026, each listed for the whole year. Every funding settlement from 14 October 2025 to 14 October 2026, added up. A positive rate means longs pay shorts; a negative one means shorts pay longs. The total is what a long held all year at the same size paid, as a share of the position.
Where longs paid the most
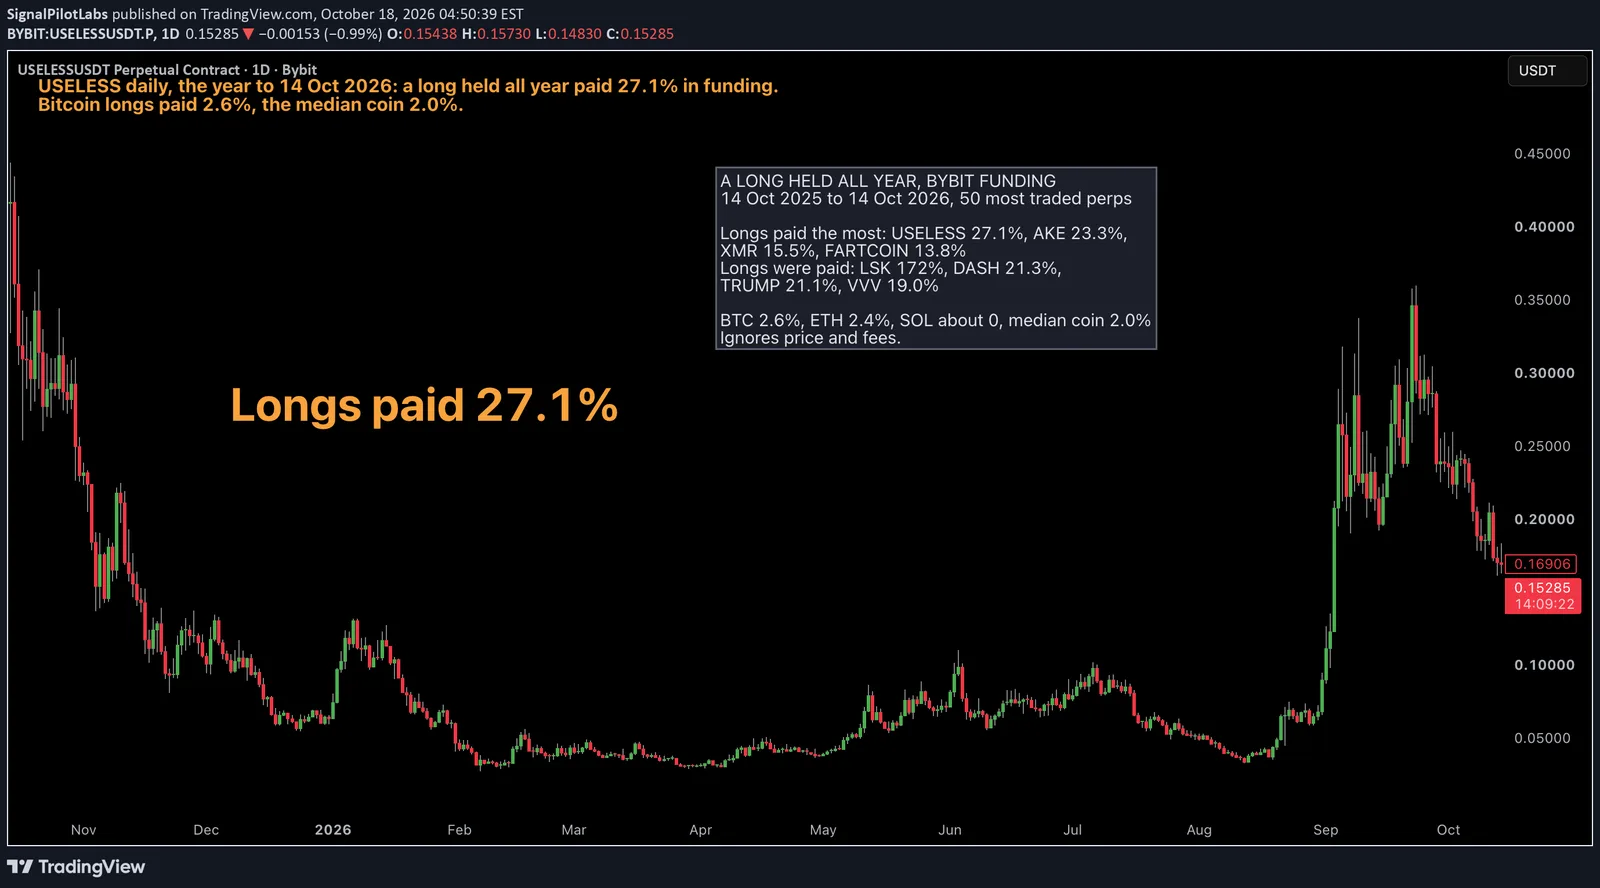
USELESS 27.1%. AKE 23.3%. XMR 15.5%. FARTCOIN 13.8%. BR 7.3%.
On USELESS, longs paid at 99% of the year’s settlements. On $1,000 held all year, that’s $271. Over the same year its price went from 0.416 to 0.167.
The big three
BTC 2.6%, which is $26 on $1,000. ETH 2.4%. SOL about zero. The median coin paid 2.0%, and 40 of the 50 coins sat between minus 10.7% and plus 4.6%.
Where longs were paid
On 17 of the 50 coins, shorts paid longs over the year. LSK is the outlier: longs received 172% of their position, and 141 points of it came in two months, November 2025 and September 2026, when single hourly settlements reached minus 2.5% in November and minus 2% in September. Next: DASH 21.3%, TRUMP 21.1%, VVV 19.0%.
All 50 coins
From the most a long paid to the most a long was paid. A minus sign means longs were paid. The most expensive 30 days is the costliest run of 30 days in a row for a long, on the same coin.
| Coin | Paid by a long over the year (%) | On $1,000 ($) | Settlements where longs paid (%) | Settles every (hours) | Most expensive 30 days (%) |
|---|---|---|---|---|---|
| USELESS | 27.1 | 271 | 99 | 4 | 5.6 |
| AKE | 23.3 | 233 | 97 | 1, 3, 4 | 7.0 |
| XMR | 15.5 | 155 | 98 | 8 | 2.6 |
| FARTCOIN | 13.8 | 138 | 99 | 4 | 2.4 |
| BR | 7.3 | 73 | 92 | 4 | 2.7 |
| SUI | 4.6 | 46 | 76 | 8 | 0.7 |
| PUMPFUN | 4.5 | 45 | 78 | 4 | 0.7 |
| LINK | 3.5 | 35 | 69 | 8 | 0.5 |
| HYPE | 3.2 | 32 | 68 | 8 | 0.6 |
| NEAR | 3.0 | 30 | 70 | 8 | 0.7 |
| PENGU | 3.0 | 30 | 71 | 4 | 0.6 |
| LTC | 2.8 | 28 | 67 | 8 | 0.5 |
| AAVE | 2.8 | 28 | 66 | 8 | 0.4 |
| QNT | 2.8 | 28 | 77 | 8 | 0.7 |
| DOGE | 2.7 | 27 | 67 | 8 | 0.5 |
| ONDO | 2.7 | 27 | 72 | 4 | 0.6 |
| BTC | 2.6 | 26 | 71 | 8 | 0.5 |
| 1000PEPE | 2.6 | 26 | 71 | 8 | 0.7 |
| UNI | 2.6 | 26 | 65 | 8 | 0.5 |
| ADA | 2.5 | 25 | 65 | 8 | 0.5 |
| BNB | 2.4 | 24 | 65 | 8 | 0.5 |
| ETH | 2.4 | 24 | 70 | 8 | 0.5 |
| ARB | 2.4 | 24 | 65 | 8 | 0.5 |
| TIA | 2.3 | 23 | 73 | 4 | 0.8 |
| XPL | 2.2 | 22 | 73 | 4 | 0.6 |
| OP | 1.8 | 18 | 67 | 8 | 0.5 |
| TAO | 1.6 | 16 | 80 | 4 | 0.9 |
| XLM | 1.6 | 16 | 64 | 8 | 0.6 |
| AVAX | 1.5 | 15 | 63 | 8 | 0.5 |
| XRP | 1.2 | 12 | 58 | 8 | 0.5 |
| HBAR | 0.9 | 9 | 58 | 8 | 0.5 |
| ZRO | 0.7 | 7 | 75 | 4 | 0.9 |
| SOL | 0.0 | 0 | 56 | 8 | 0.4 |
| STRK | -0.1 | -1 | 72 | 4 | 0.8 |
| ENA | -1.5 | -15 | 67 | 4 | 0.6 |
| FIL | -1.5 | -15 | 57 | 8 | 0.4 |
| MOVR | -2.2 | -22 | 87 | 4 | 1.1 |
| BCH | -2.9 | -29 | 46 | 8 | 0.5 |
| DOT | -3.5 | -35 | 54 | 8 | 0.6 |
| WLD | -4.3 | -43 | 56 | 8 | 0.5 |
| ZEC | -5.3 | -53 | 71 | 8 | 0.9 |
| AERO | -6.0 | -60 | 65 | 4 | 0.7 |
| RLC | -6.7 | -67 | 76 | 8 | 0.9 |
| INJ | -8.6 | -86 | 54 | 1, 6, 8 | 0.5 |
| APT | -10.7 | -107 | 47 | 8 | 0.5 |
| SAND | -13.2 | -132 | 55 | 1, 8 | 0.6 |
| VVV | -19.0 | -190 | 75 | 4 | 1.3 |
| TRUMP | -21.1 | -211 | 43 | 4 | 0.2 |
| DASH | -21.3 | -213 | 76 | 8 | 0.9 |
| LSK | -172.4 | -1,724 | 67 | 1, 3, 4 | 1.2 |
Before you hold one
Every perpetual on Bybit shows its current funding rate and how often it settles. A rate of 0.01% every 8 hours is three settlements a day, about 11% a year if it never changed. Rates do change, often a lot, so the year’s total above is the better guide to what holding has cost.
What this does not tell you
It ignores price. Funding is charged on a position’s value at each settlement, so a long whose coin rose or fell paid more or less than these numbers; we held the size constant. No trading fees. One exchange, one year, past rates. Funding can change fast: LSK’s was ordinary for months, then it wasn’t.
What it’s good for is knowing what a long costs to hold before you hold it. On most coins it’s small. On a few it’s a quarter of the position a year.
Observations, not recommendations.
We’re Signal Pilot Labs. We build the Elite Seven, seven indicators for TradingView, and we post what we measure, including the parts that didn’t work.
See what we build at signalpilot.io.
Published as a TradingView Idea on USELESSUSDT. View the chart on TradingView
Past measurement described after the fact. Nothing here is a recommendation or an indication of future results.